Abstract
The potent anticancer drug actinomycin D (ActD) acts by binding to DNA GpC sequences, thereby interfering with essential biological processes including replication, transcription and topoisomerase. Certain neurological diseases are correlated with expansion of (CTG)n trinucleotide sequences, which contain many contiguous GpC sites separated by a single base pair. In order to characterize the binding of ActD to CTG triplet repeat sequences, we carried out heat denaturation and CD analyses, which showed that adjacent GpC sequences flanking a T:T mismatch are preferred ActD-binding sites, and that ActD binding results in a conformational transition to A-type structure. The structural basis of the strong binding of ActD to neighboring GpC sites flanking a T:T mismatch was provided by the crystal structure of ActD bound to ATGCTGCAT, which contains a CTG triplet sequence. Binding of two ActD molecules to GCTGC causes a kink in the DNA helix. In addition, using a synthetic self-priming DNA model, 5′-(CAG)4(CTG)16-3′, we observed that ActD can trap the cruciform or duplexes of (CTG)n and interfere with the expansion process of CTG triplet repeats as shown by gel electrophoretic expansion assay. Our results may provide the possible biological consequence of ActD bound to CTG triplet repeat sequences.
INTRODUCTION
Actinomycin D (ActD) (Fig. 1A) is a potent anticancer drug. It binds to DNA by intercalating its phenoxazone ring at a GpC step with the two cyclic pentapeptides of the drug located in the DNA minor groove (1,2). The biological activity of ActD may be related to its binding to DNA, thereby interfering with replication and transcription (3,4). The GpC sequence specificity of ActD, analyzed extensively by a variety of biochemical and biophysical methods (2,5), is due to the strong hydrogen bonds between the NH/C=O groups of threonines of ActD and the corresponding N3/N2 sites of adjacent guanine bases of the GpC step.
Figure 1.
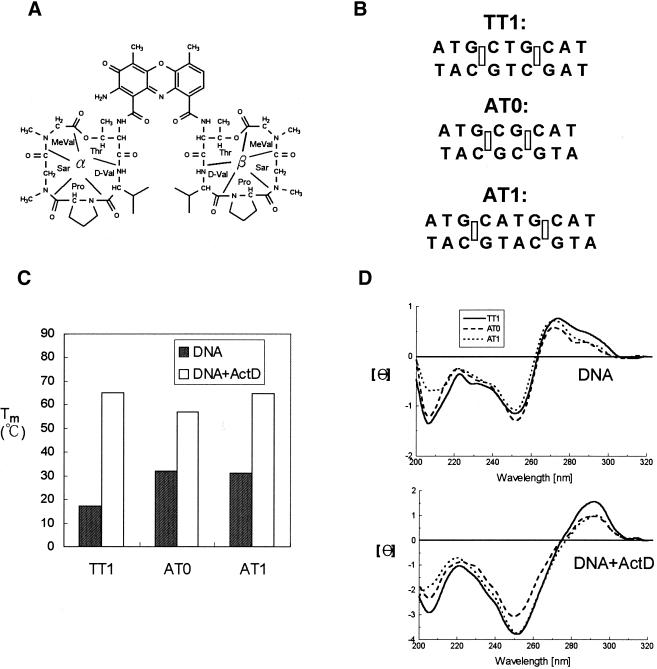
(A) Chemical structure of ActD. The cyclic pentapeptide attached to the quinonoid ring and the benzenoid ring of the phenoxazone group are labeled α and β, respectively. (B) DNA duplexes that were used in this study include AT0, AT1 and TT1 (rectangles represent the binding sites for the phenoxazone ring of ActD). (C) The effect of ActD on the Tm values of AT0, AT1 and TT1 (4 µM) in standard buffer. (D) CD spectra of AT0, AT1 and TT1 (4 µM) in standard buffer alone (top) and with 10 µM ActD are graphed (bottom). The CD spectra of ActD–DNA complexes were obtained by subtracting the spectrum of ActD.
CTG/CAG triplet repeat expansions (TREs) within genes are associated with various neurological diseases, including Huntington’s disease, myotonic dystrophy, spinocerebellar ataxia and spinal and bulbar muscular atrophy (6–9). How these unusual repetitive sequences correlate with the etiology of these diseases and the mechanism by which the repeats are expanded during replication have been under intense study. The massive CTG/CAG expansion found in neurological diseases may be caused by the slipped register of the DNA complementary strands along with the transient formation of hairpins during DNA replication (10). In fact, the transient intrastand hairpin structure containing mismatched base pairs has been proposed to promote DNA slippage and is a causative factor for DNA expansion (11–13). DNA duplexes encoding triplet repeats may easily exchange between duplex and cruciform, especially under negative supercoiling strain (14,15).
Interestingly, when the (CTG)n triplet sequence adopts a hairpin arm (as part of a cruciform) or duplex form between antiparallel CTGs, it contains many GpC binding sites for ActD alternating with T:T mispairs. Previously it has been demonstrated that the binding affinity to a GpC site is also influenced by the flanking sequences. Indeed, a T:T mismatch adjacent to a GpC step provides an excellent binding site for ActD as shown by NMR (16) and gel electrophoretic analysis (17). The molecular basis for tight binding of ActD to a -TGCT- sequence has been provided from the solution structure of the ActD–GATGCTTC complex in which the N-methyl group of N-methylvaline (MeVal) was shown to fit snugly in a cavity at the TpG step created by the T:T mismatched base pair (16). It is of interest to note that -TGCT- is a part of (CTG)n triplet repeat sequences. Here, we have characterized the stabilizing effect of ActD on CTG triplet sequences by spectroscopic analysis, and solved the crystal structure of the ActD–ATGCTGCAT complex in order to understand the structural basis of the tight binding of ActD. In addition, we have measured the ability of ActD to trap the cruciform or duplexes of (CTG)n and interfere with the expansion of CTG triplet repeats shown by gel mobility shift and DNA expansion assays, respectively.
MATERIALS AND METHODS
Drug and oligonucleotides
The synthetic DNA oligonucleotides TT1 (5′-ATGCTGCAT), AT0 (5′-ATGCGCAT), AT1 (5′-ATGCATGCAT) and CTG1 [5′-(CAG)4(CTG)16] were purified by gel electrophoresis. ActD was purchased from Sigma Chemical Co. (St Louis, MO). The concentrations of ActD solutions were determined from its optical density (ε224 nm = 35 280 M–1 cm–1). A[br5U]GCTGCAT was used for the multiple wavelength anomalous diffraction (MAD) experiments. The standard buffer was 50 mM sodium cacodylate buffer solution, pH 7.5.
Melting temperature measurement
The Tm values of DNA duplexes were analyzed as described previously using a Cary-3E UV/VIS spectrophotometer by monitoring the sample absorption at 260 nm (18). The experiments were carried out by increasing the temperature at a rate of 0.5°C/min from 0 to 100°C and the temperature was recorded every 30 s. The Tm values were determined from polynomial fitting of the observed curves and were taken as the temperatures corresponding to half-dissociation of the DNA duplexes. The first derivative of absorption with respect to temperature, dA/dT, of the melting curve was computer generated and used for determining the Tm.
CD spectroscopy
The CD spectra were collected between 320 and 200 nm at 1 nm intervals using a JASCO-720 CD spectropolarimeter. The DNA samples were prepared in an identical manner to those for the Tm measurements. CD spectral analysis was described previously (18).
Crystallography
Crystals were obtained from solutions containing 1.3 mM DNA single strand, 1.3 mM ActD, 40 mM sodium cacodylate buffer (pH 6.0), 10 mM BaCl2, 3 mM spermine, 4% MPD solution, equilibrated at 4°C against 30 ml of 50% MPD, using the vapor diffusion method (19). The crystallographic statistics are listed in Table 1. The DNA in the complex is numbered A1 to T9 in one strand and A10 to T18 in the complementary strand. The two ActD molecules are numbered ActD19 and ActD20. Diffraction data for the ActD–A[br5U]GCTGCAT complex crystal were measured at 110 K at the Structural Biology Center undulator ID 19 beamline at the Advanced Photon Source using fundamental undulator harmonics and a 3 × 3 mosaic CCD detector as described before (20,21). Crystallographic data integration and reduction was done with the program package HKL2000 (22). MAD data were collected from four wavelengths using bromine as the anomalous scattering atom. Phases were calculated as implemented in the crystallographic suite CNS (23). The figure of merit is 0.60/0.91, before/after density modification, respectively. The resulting MAD electron density map at 3.0 Å resolution was used to build the initial models using the program O and gave an initial R value of 0.45. Water molecules were then located from subsequent Fourier (2Fo – Fc) maps and added to the refinements using the procedure implemented in X-PLOR and then the structure was refined by the simulated annealing procedure incorporated in CNS (23). For all data between 50 and 2.6 Å resolution, the Rfactor and Rfree values (5% data) are 0.233 and 0.295, respectively. The DNA force field parameters of Parkinson et al. were used (24). The force field of ActD was generated using the atomic coordinates of its high-resolution crystal structure. Torsion angles were calculated using the program CURVES v.5.3 (25).
Table 1. Crystallographic and refinement data of the ActD–A[br5U]GCTGCAT complex.
| λ for data collection (Å) | 0.9530 | 0.9197 | 0.9196 | 0.8563 |
|---|---|---|---|---|
| inflection point | peak | high remote | ||
| Crystallographic data | ||||
| a = b (Å) | 47.24 | 46.73 | 46.73 | 46.72 |
| c (Å) | 69.45 | 69.57 | 69.58 | 69.58 |
| Space group | P3112 | |||
| Resolution (Å) | 20–2.6 | 20–3.0 | 20–3.0 | 20–3.0 |
| No. of reflections [>0 σ (I)] | 2650 | 3456a | 3477a | 3467a |
| <I/σ(I)> | 29.1 (14.4)b | 24.1 | 21.9 | 23.9 |
| Rmerge (%) | 5.5 (13.9)b | 6.8 | 7.9 | 6.6 |
| Completeness (%) | 96.9 (99)b | 99.5 | 99.5 | 99.4 |
| Multiplicity | 6.9 | 11.1 | 11.1 | 11.2 |
| Refinement data | ||||
| Rfactor/Rfree (5% data) | 0.233/0.295 | |||
| r.m.s.d. (Å) | 0.018 | |||
| r.m.s.d. (°) | 3.1 | |||
| No. of DNA atoms | 362 | |||
| No. of drug atoms | 180 | |||
| No. of waters | 66 |
aIncluding Friedel’s pairs.
bThe numbers in parentheses are from the outermost shell (2.5–2.6 Å) data.
Gel mobility shift assay
DNA fragments (CTG1) at 1 µM were stored overnight with various concentrations of ActD at 4°C in standard buffer. The various species of drug–DNA complexes were resolved into bands according to their complex structures by non-denaturing gel electrophoresis at 160 V in a 12% polyacrylamide slab gel (10 cm × 10.5 cm × 0.75 mm) in TBE buffer (89 mM Tris–borate, 2 mM EDTA, pH 8.3). The gels were then stained with ethidium bromide and bands detected in gel by Imagemaster VDS (Pharmacia).
DNA expansion assay
The DNA polymerase Klenow fragment (KF) devoid of 3′- and 5′-exonuclease activity was used for the DNA expansion assay (Promega). For use in the extension reactions, a DNA (CTG1) 60mer in the duplex and hairpin forms was unfolded (110°C for 10 min) and refolded to hairpins (slow cooling to room temperature). DNA fragments (CTG1) at 1 µM were equilibrated with ActD for 1 h at room temperature in reaction buffer (50 mM Tris–HCl, pH 7.5, 12 mM MgCl2, 1 mM DTT). The enzyme plus dNTP reaction solution was micropipetted into the DNA–ActD complex solution and incubated at 37°C for 30 min. Final enzyme and dNTP concentrations were ∼2 U and ∼1 mM, respectively. An aliquot (10 µl) of the reaction buffer was removed and quenched by adding 10 µl of 40 mM EDTA and 20 M formamide at 100°C for 5 min. The reaction products were examined by denaturing gel electrophoresis at 200 V in 16% polyacrylamide (10 cm × 10.5 cm × 0.75 mm), with 12 M formamide as denaturant, in TBE buffer. The gels were stained with ethidium bromide and bands detected in gel by Imagemaster VDS (Pharmacia).
RESULTS AND DISCUSSION
Tm and CD spectral analysis of ActD bound to DNA duplexes
We characterized the stabilizing and structural effects of ActD on various duplexes containing two related GC step sites by UV melting and circular dichroism analysis. DNA duplexes used in this study include TT1, AT0 and AT1, which are listed in Figure 1B. TT1 was used as the reference sequence, with the AT0 and AT1 sequences for comparison. TT1 (4 µM) showed a lower Tm value (17°C) than AT0 (32°C) and AT1 (31°C) (Fig. 1C). However, the Tm value of TT1 increases (from 17 to 65°C) more than those of AT0 (from 32 to 57°C) and AT1 (from 31 to 64.5°C) upon addition of saturating ActD (10 µM). The data suggest that duplexes containing two GC sites flanking one T:T mispair indeed provide a suitable cavity in the minor groove for ActD binding and form a more stable complex. The Tm value of AT0 duplex with ActD is lower than those of TT1 and AT1. This is due to crowding between two neighboring cyclic peptides of ActD at two overlapping GpC sites resulting in a severe bending of the helix of ∼50° (26).
CD spectra are good indicators of DNA conformation. Figure 1D shows the CD spectra of DNA duplexes with AT0, AT1 and TT1 in the absence (top) and presence (bottom) of ActD, respectively. The CD spectra of ActD–DNA complexes showed a red shift from 275 to 290 nm, indicative of a conformational transition to an A-type structure (18).
Overall crystal structure of the ActD–DNA complex
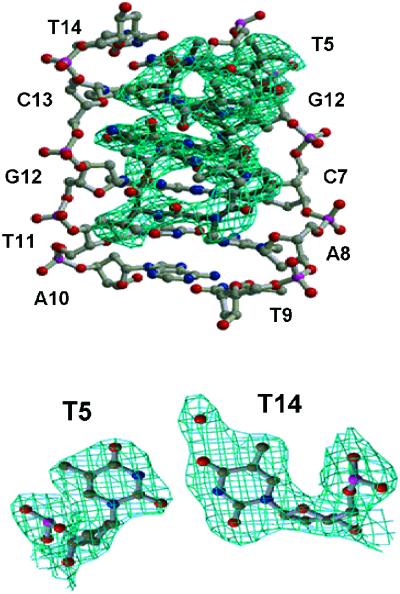
The ActD–ATGCTGCAT complex was solved by the MAD method using a brominated oligonucleotide A[br5U]GCTGCAT. The (CTG)n triplet sequence signature is embedded in the DNA sequence. The final refined electron density map at 2.6 Å resolution was of good quality. Figure 2 shows the phenoxazone plus the two cyclic pentapeptide rings in the minor groove of DNA and the T5:T14 mismatched base pair, respectively.
Figure 2.
The refined (2Fo – Fc) Fourier electron density map showing the five amino acids (threonine, N-methylvaline, sarcosine, proline and D-valine) and the T5·T14 mismatched base pair of the ActD–DNA complex at 2.6 Å resolution.
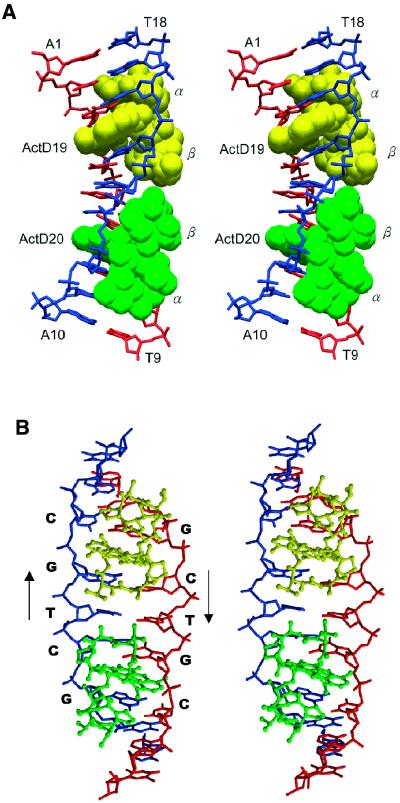
In the complex, two ActD molecules bind at the two GpC sites, separated by a T:T mispair (Fig. 3A and B). The general binding mode of ActD to each of the GpC sites resembles that found in previous crystal structures of ActD–DNA complexes (2). The phenoxazone rings of ActD19 (yellow)/ActD20 (green) intercalate into the G3-C4/G15-C16 and G12-C13/G6-C7 base pairs, respectively, from the minor groove side. Each ActD covers ∼4 bp.
Figure 3.
(A) Stereoscopic drawings of the crystal structure of the 2:1 ActD–(ATGCTGCAT)2 complex (ActD in van der Waals and DNA in skeletal representation). Two ActD molecules, ActD19 (yellow) and ActD20 (green), related by a two-fold symmetry operation, bind to DNA by intercalating the phenoxazone rings at the two GpC steps with cyclic pentapeptide moieties located in the minor groove. (B) Stereoscopic drawings of the ActD–DNA complex (ActD in ball-and-stick and DNA in skeletal line representation) viewed from the minor groove direction.
The proximity of the two ActDs in the minor groove results in contacts between two β peptide rings. The bulky MeVal side chain of the β ring of ActD19 is in van der Waals contact with the N-methyl group of the sarcosine of the β ring of ActD20 and, likewise, crowding arises between the MeVal of the β ring of ActD20 and the N-methyl group of the sarcosine of the β ring of ActD19. Such extensive hydrophobic interactions provide stabilization forces between the two ActD molecules. The contacts between two β rings result in a slight bending of the nonamer DNA duplex in which the two halves are tilting towards the major groove direction (Fig. 3A). The helix axis of the top half (with an A1-T18 terminal base pair) was bent at an angle of ∼15° away from that of the bottom half (with an A10-T9 terminal base pair).
The two bulky peptide rings expand the minor groove width and force the two backbones to unwind, resulting in a ladder-like structure (Fig. 3B). In the complex, ActD maintains its pseudo 2-fold symmetry, with the r.m.s.d. between the two peptide rings being 0.15 Å (using both ActD).
Structural details of the binding site
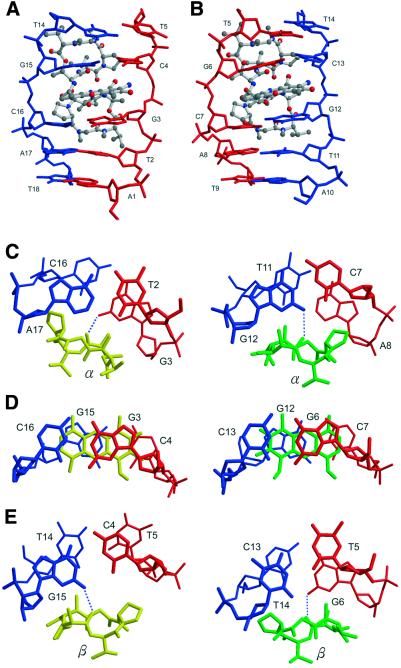
Figure 4A shows a close-up view of the complex at the ActD intercalation site. The two pentanucleotide halves of the complex are related by a local 2-fold symmetry, with the r.m.s.d. between the two halves (DNA + ActD) being 0.79 Å. The strong intermolecular ActD–DNA hydrogen bonds between the G3-N2/N3 (and G12-N2/N3) and the CO/NH of Thr(α) of ActD19, and the G15-N2/N3 (and G12-N2/N3) and the CO/NH of Thr(β) of ActD19 and ActD20, respectively, define the strong sequence preference for two adjacent 5′-G nucleotides from opposite strands of the DNA. The strong G-C preference of ActD binding can sometimes even extrude nucleotides located between a 5′-G and a 3′-C (27,28). The outer edges of the peptide rings (i.e. the sarcosine-MeVal dipeptide part) from ActD reach beyond the flanking base pairs in the minor groove. The methyl group of the MeVal from the β and α ring is wedged between the T14pG15 (and T5pG6) and T2pG3 (and T11pG12) step, respectively.
Figure 4.
Close-up side view of the ActD–TGCAT part (ActD in ball-and-stick and DNA in skeletal representation). The two phenoxazone rings are intercalated individually into the (G3pC4)·(G15pG16) step in (A) and the (G6pC7)·(G12pC13) step in (B), respectively. (C–E) The detailed conformation showing the stacking interactions in the ActD–DNA complex at various base pair steps of the refined structure. The hydrogen bonding between the oxygen atom of the threonine carbonyl group and the hydrogen atom of the guanine N2 amino group is marked by blue dotted lines.
The 3-keto group of phenoxazone nudges against the backbone of the G3pC4 (and G12pC13) step and the 2-amino group of phenoxazone of ActD19/ActD20 is hydrogen bonded (3.04/2.63 Å) to O4′ of the C4/C13 residue, respectively. No evidence of disordering of ActD is found. The binding of ActD causes changes of some DNA backbone torsion angles from those of B-DNA. Strikingly, ActD unwinds the helix significantly, particularly at the (G3pC4)·(G15pC16) and (G6pC7)·(G12pC13) intercalation sites. The sugar pucker of these residues preserves the C2′-endo conformation.
Even though the phenoxazone of ActD is not perfectly 2-fold symmetrical due to the additional C=O/NH2 exocyclic groups on one side of the ring, its intercalation between the G3-C16/G15-C4 (and G6-C13/G12-C7) base pairs remains symmetrical as far as DNA is concerned (Fig. 4A and B). There are extensive stacking interactions between the phenoxazone ring and the guanine bases from both sides of the ring, with the phenoxazone aligned with its major axis parallel to the Watson–Crick hydrogen bonds of the base pairs (Fig. 4D).
The two bulky peptide rings have close contacts with the A-T base pairs (A17-T2 and A8-T11) beyond the G-C base pair, resulting in an asymmetric twisting of the base pair step. The proline side of the peptide ring pushes the cytosine of the G-C base pair towards the major groove side, reducing the base stacking on the DNA strand close to the proline (C16 in the left column or C7 in the right column; Fig. 4C).
The T5-T14 mispair is of the wobble type, with the T5 located towards the major groove side (Figs 2 and 4E). Such a unique T:T base pair conformation generates a cavity in the minor groove near the O2 of T5 where the N-methyl group of MeVal(β) of ActD20 is located, avoiding wedging of the T5pG6 step by the N-methyl group. Our structural observations here agree with an earlier NMR study of the ActD–GATGCTTC complex (16). Taken together, our results provide the structural basis for ActD binding to (CTG)n sequences with high affinity.
ActD interferes with the intrastrand hairpin–duplex interconversion of CTG1
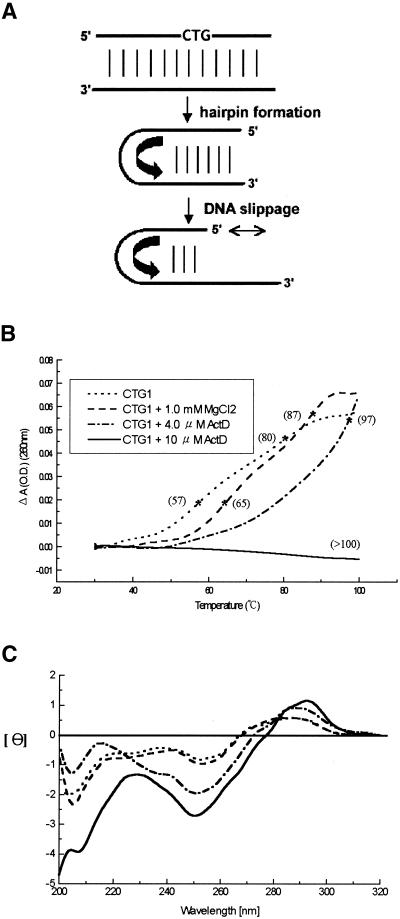
The self-priming sequence CTG1 [5′-(CAG)4(CTG)16-3′] can form intrastrand hairpins consisting of both normal and mismatched base pairs, which promote primer–template slippage during DNA replication (Fig. 5A) (29). The structure of CTG1 offers many GC sites flanking a T:T base pair for ActD binding. ActD greatly elevated the Tm value of CTG1 with increasing ActD concentrations (Fig. 5B). In the presence of 10 µM ActD, the Tm of CTG1 was >100°C, with a concomitant increased peak intensity in the CD spectra of CTG1 (Fig. 5C). These results together suggest that long CTG repeats also show substantial conformational change along with increased thermal stability upon addition of ActD.
Figure 5.
(A) Scheme of hairpin formation and DNA slippage of CTG triplet repeats. (B) The melting profiles and Tm values of CTG1 (1 µM) in standard buffer and with ActD. (C) CD spectra of CTG1 (1 µM) in the same buffer solution. The CD spectra of ActD–DNA complexes were obtained by subtracting the spectrum of ActD alone.
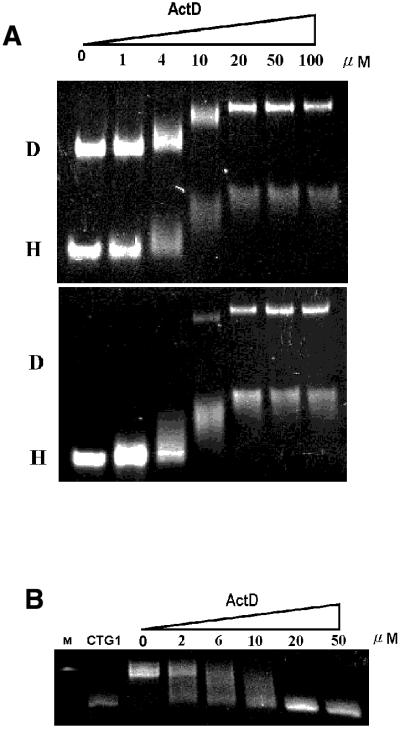
We have utilized CTG1 to examine the interference of ActD with duplex–hairpin interconversion using the gel mobility shift assay. The CTG1 60mer exists in duplex (denoted D) and intrastrand hairpin forms (denoted H) (Fig. 6A, top). Increasing the ActD concentration caused a corresponding decrease in native gel electrophoretic mobility of both the duplex and hairpin forms of CTG1. In another experiment (Fig. 6B, bottom), the samples in the top panel of Figure 3A were heated at 110°C for 10 min, then renatured slowly to room temperature. In the absence or at low concentration of ActD, CTG1 refolded almost entirely to hairpins after renaturation. Interestingly, at higher ActD concentrations, similar amounts of duplex and hairpin complexes were retained after refolding. When CTG1 was refolded to the hairpin form first and ActD added subsequently, no duplex complex could be detected. This confirmed the ability of ActD to trap either the duplex or the hairpin structure depending on the starting conformation of the (CTG) sequence (data not shown).
Figure 6.
(A) Gel mobility shift assay of CTG1 (1 µM) under different concentrations of ActD. D and H denote duplex and intrastrand hairpin forms of CTG1, respectively. (B) The interference assay of ActD on CTG1 (1 µM) expansion using DNA polymerase KF. The first (M) and second (CTG1) lanes represent the 90mer DNA marker and the 60mer (CAG)4(CTG)16 without polymerase, respectively. The other lanes show the 60mer extended with DNA polymerase in the presence of ActD.
ActD interferes with DNA expansion of CTG1
In an earlier study, Petruska et al. (29) used CTG1, which forms a well-defined series of hairpins–loops, to measure the influence of CTG/CTG interactions on strand slippage in polymerase-catalyzed expansion of correctly paired (CAG/CTG) repetitions. They found that the products of polymerase extension were observed to slip and expand in steps of two triplets at a rate of ∼1 step/min at 37°C. Slippage by two triplets is 20 times more frequent that by one triplet, in accordance with the fact that hairpin loops with even numbers of triplets are 1–2 kcal/mol more stable than their odd numbered counterparts. In the present study, we utilized CTG1 as a simple system to examine the interference effect of ActD on expansion during DNA slippage. When DNA polymerase and dNTPs were added, the CTG1 sequence expanded from a 60mer to a 90mer through DNA slippage in 30 min. This result is similar to a previous study (29). However, the size of CTG1 expansion by polymerase was decreased with increasing ActD concentrations (Fig. 6B). The results showed that ActD interferes with DNA slippage rates and replication by intercalating into the GpC step during DNA expansion of the CTG1 sequence. In the presence of a saturating amount of ActD (>20 µM), the expansion of CTG1 was fully inhibited by ActD due to the formation of an extremely thermally stable ActD–CTG1 complex in which no template space was available for replication.
CONCLUSION
Our results here show that ActD can bind to consecutive GpC sites, separated by a T:T mismatched base pair. Some conformational distortions, particularly kinks in the helix, unwinding of the base pairs and widening of the minor groove, were observed. In the (CTG)n triplet repeats sequence, a high clustering of GpC sequences exists, which provide an excellent ActD binding target. Although the biological consequences of ActD binding to the (CTG)n region remain unclear, it is conceivable that ActD binding may trap the (CTG)n stem region of the cruciform resulting from extrusion of the (CTG)n·(CAG)n double-stranded sequence. Alternatively, expansion of the (CTG)n region may be interrupted due to its multiple binding of ActD. Our results may provide the possible consequence of ActD bound to CTG triplet repeat sequences.
SUPPLEMENTARY MATERIAL
The close-up side view of the crystal structure at various base pair steps is available as Supplementary Material at NAR Online.
Acknowledgments
ACKNOWLEDGEMENTS
We thank Drs Sanishvili and Joachimiak for assistance in data collection on the ID 19 beamline at APS and Dr Yu-May Lee for help with the DNA expansion assay. This work was support by a National Institutes of Health grant (USA) and NCS 90-2311-B-001-099 (Taiwan, ROC) to A.H.-J.W.
PDB accession no. 1MNV
REFERENCES
- 1.Sobell H.M. and Jain,S.C. (1972) Stereochemistry of actinomycin binding to DNA. II. Detailed molecular model of actinomycin-DNA complex and its implications. J. Mol. Biol., 68, 21–34. [DOI] [PubMed] [Google Scholar]
- 2.Kamitori S. and Takusagawa,F. (1992) Crystal structure of the 2:1 complex between d(GAAGCTTC) and the anticancer drug actinomycin D. J. Mol. Biol., 225, 445–456. [DOI] [PubMed] [Google Scholar]
- 3.Hurwitz J., Furth,J.J., Malamy,M. and Alexander,M. (1962) The role of deoxyribonucleic acid in ribonucleic acid synthesis. III: The inhibition of the enzymatic synthesis of ribonucleic acid and deoxyribonucleic acid by actinomycin D and proflavin. Proc. Natl Acad. Sci. USA, 48, 1222–1230. [DOI] [PMC free article] [PubMed] [Google Scholar]
- 4.Aivasashvilli V.A. and Beabealashvilli,R.S. (1983) Sequence-specific inhibition of RNA elongation by actinomycin D. FEBS Lett., 160, 124–128. [DOI] [PubMed] [Google Scholar]
- 5.Chen F.M. (1988) Kinetic and equilibrium binding studies of actinomycin D with some d(TGCA)-containing dodecamers. Biochemistry, 27, 1843–1848. [DOI] [PubMed] [Google Scholar]
- 6.Margolis R.L., O’Hearn,E., Rosenblatt,A., Willour,V., Holmes,S.E., Franz,M.L., Callahan,C., Hwang,H.S., Troncoso,J.C. and Ross,C.A. (2001) A disorder similar to Huntington’s disease is associated with a novel CAG repeat expansion. Ann. Neurol., 50, 373–380. [DOI] [PubMed] [Google Scholar]
- 7.Seznec H., Agbulut,O., Sergeant,N., Savouret,C., Ghestem,A., Tabti,N., Willer,J.C., Ourth,L., Duros,C., Brisson,E. et al. (2001) Mice transgenic for the human myotonic dystrophy region with expanded CTG repeats display muscular and brain abnormalities. Hum. Mol. Genet., 10, 2717–2726. [DOI] [PubMed] [Google Scholar]
- 8.Paulson H.L. and Fischbeck,K.H. (1996) Trinucleotide repeats in neurogenetic disorders. Annu. Rev. Neurosci., 19, 79–107. [DOI] [PubMed] [Google Scholar]
- 9.Warren S.T. and Ashley,C.T.,Jr (1995) Triplet repeat expansion mutations: the example of fragile X syndrome. Annu. Rev. Neurosci., 18, 77–99. [DOI] [PubMed] [Google Scholar]
- 10.Pluciennik A., Iyer,R.R., Parniewski,P. and Wells,R.D. (2000) Tandem duplication: a novel type of triplet repeats instability. J. Biol. Chem., 275, 28386–28397. [DOI] [PubMed] [Google Scholar]
- 11.McMurray C.T. (1999) DNA secondary structure: a common and causative factor for expansion in human disease. Proc. Natl Acad. Sci. USA, 96, 1823–1825. [DOI] [PMC free article] [PubMed] [Google Scholar]
- 12.Kovtun I.V. and McMurray,C.T. (2001) Trinucleotide expansion in haploid germ cells by gap repair. Nature Genet., 27, 407–411. [DOI] [PubMed] [Google Scholar]
- 13.Petruska J., Arnheim,N. and Goodman,M.F. (1996) Stability of intrastrand hairpin structures formed by the CAG/CTG class of DNA triplet repeats associated with neurological diseases. Nucleic Acids Res., 24, 1992–1998. [DOI] [PMC free article] [PubMed] [Google Scholar]
- 14.Jakupciak J.P. and Wells,R.D. (1999) Genetic instabilities in (CTG.CAG) repeats occur by recombination. J. Biol. Chem., 274, 23468–23479. [DOI] [PubMed] [Google Scholar]
- 15.Bowater R.P. and Wells,R.D. (2001) The intrinsically unstable life of DNA triplet repeats associated with human hereditary disorders. Prog. Nucleic Acid Res. Mol. Biol., 66, 159–202. [DOI] [PubMed] [Google Scholar]
- 16.Lian C., Robinson,H. and Wang,A.H.-J. (1996) Structure of actinomycin D bound with (GAAGCTTC)2 and (GATGCTTC)2 and its binding to the (CAG)n:(CTG)n triplet sequence as determined by NMR analysis. J. Am. Chem. Soc., 118, 8791–8801. [Google Scholar]
- 17.Liu C. and Chen,F.M. (1996) Actinomycin D binds strongly and dissociates slowly at the dGpdC site with flanking T/T mismatches. Biochemistry, 35, 16346–16353. [DOI] [PubMed] [Google Scholar]
- 18.Hou M.H., Lin,S.B., Yuann,J.M., Lin,W.C., Wang,A.H.-J and Kan,L.S. (2001) Effects of polyamines on the thermal stability and formation kinetics of DNA duplexes with abnormal structure. Nucleic Acids Res., 29, 5121–5128. [DOI] [PMC free article] [PubMed] [Google Scholar]
- 19.Wang A.H.-J. and Gao,Y.G. (1990) Crystallization of oligonucleotides and their complexes with antitumor drugs. Methods, 1, 91–99. [Google Scholar]
- 20.Walsh M.A., Evans,G., Sanishvili,R., Dementieva,I. and Joachimiak,A. (1999) MAD data collection—current trends. Acta Crystallogr., D55, 1726–1732. [DOI] [PubMed] [Google Scholar]
- 21.Gao Y.G., Robinson,H., Sanishvili,R., Joachimiak,A. and Wang,A.H.-J. (1999) Structure and recognition of sheared tandem G x A base pairs associated with human centromere DNA sequence at atomic resolution. Biochemistry, 38, 16452–16460. [DOI] [PubMed] [Google Scholar]
- 22.Otwinowski Z. and Minor,W. (1997) Processing of X-ray diffraction data collected in oscillation mode. Methods Enzymol., 276, 307–326. [DOI] [PubMed] [Google Scholar]
- 23.Brunger A.T., Adams,P.D., Clore,G.M., DeLano,W.L., Gros,P., Grosse-Kunstleve,R.W., Jiang,J.S., Kuszewski,J., Nilges,M., Pannu,N.S. et al. (1998) Crystallography & NMR system: a new software suite for macromolecular structure determination. Acta Crystallogr., D54, 905–921. [DOI] [PubMed] [Google Scholar]
- 24.Parkinson G., Vojtechovsky,J., Clowney,L., Brunger,A.T. and Berman,H.M. (1996) New parameters for the refinement of nucleic acid containing structures. Acta Crystallogr., D52, 57–64. [DOI] [PubMed] [Google Scholar]
- 25.Lavery R. and Sklenar,H. (1988) The definition of generalized helicoidal parameters and of axis curvature for irregular nucleic acids. J. Biomol. Struct. Dyn., 6, 63–91. [DOI] [PubMed] [Google Scholar]
- 26.Chen H., Liu,X. and Patel,D.J. (1996) DNA bending and unwinding associated with actinomycin D antibiotics bound to partially overlapping sites on DNA. J. Mol. Biol., 258, 457–479. [DOI] [PubMed] [Google Scholar]
- 27.Robinson H., Gao,Y.G., Yang,X., Sanishvili,R., Joachimiak,A. and Wang,A.H.-J. (2001) Crystallographic analysis of a novel complex of actinomycin D bound to the DNA decamer CGATCGATCG. Biochemistry, 40, 5587–5592. [DOI] [PubMed] [Google Scholar]
- 28.Chou S.H., Chin,K.H. and Chen,F.M. (2002) Looped out and perpendicular: deformation of Watson-Crick base pair associated with actinomycin D binding. Proc. Natl Acad. Sci. USA, 99, 6625–6630. [DOI] [PMC free article] [PubMed] [Google Scholar]
- 29.Petruska J., Hartenstine,M.J. and Goodman,M.F. (1998) Analysis of strand slippage in DNA polymerase expansions of CAG/CTG triplet repeats associated with neurodegenerative disease. J. Biol. Chem., 273, 5204–5210. [DOI] [PubMed] [Google Scholar]
Associated Data
This section collects any data citations, data availability statements, or supplementary materials included in this article.


