

Abstract
Although most capillary electrophoresis (CE) applications in the nucleic acid field performed so far address DNA analysis, various RNA assays by CE have also been done. Both natural and synthetic RNAs have been examined to evaluate their quantities, sizes and interactions. In this report, we show a novel application of CE in RNA research for the analysis of RNA stable conformers. First, we present a successful adaptation of two different enzymatic methods for the 3′-end labeling of RNAs with commercially available fluorescent probes. Then, we show the high performance of CE with laser-induced fluorescence detection (CE-LIF) assisting the structural studies of transcripts. Using the example of regulatory elements present in the breast cancer gene transcript BRCA1, we demonstrate—by direct comparisons—the advantages of CE-LIF over the traditional slab-gel electrophoresis. These include a better and more reproducible separation of conformers, shorter analysis time and higher detection sensitivity.
INTRODUCTION
For several decades, conventional slab-gel electrophoresis has been fundamental in many methods of nucleic acids characterization, but recently, with the advent of modern capillary electrophoresis with laser-induced fluorescence detection systems (CE-LIF), it has started to lose its dominance in DNA research. This trend has not been followed in the RNA field, in which technology similar to PCR does not exist, and simple methods of direct fluorescent RNA labeling, except for internal labeling of in vitro transcripts, have not been developed.
Applications of CE for RNA analysis described earlier were based on UV detection (1–4) or the LIF detection of the ethidium bromide bound to RNA (5–8). Various non-cross-linked matrixes including polyacrylamide (9), cellulose derivatives (3–5,10), and polyvinylpirolidone (5,8,10) were used as sieving polymers to separate small (1,2,11), medium size (9) and large RNAs (3,4,6–8,12). The analysis of RNA–protein interactions was also described (13). The major obstacle limiting wider applications of CE in the RNA field was, however, the lack of labeling methods allowing suitable fluorescent probes to be introduced to any RNA for the analysis in the CE-LIF format.
Four methods of RNA labeling at the 3′ end have been described. The first two used either T4 RNA ligase (14), or poly (A) polymerase (15,16), and the other two took advantage of the terminal deoxynucleotidyltransferase (TdT) (17) and Klenow fragment of DNA polymerase I from Escherichia coli (18). We have adapted the latter two methods to achieve the fluorescent labeling of in vitro transcripts at their 3′-termini. For this purpose, we applied several different rhodamine derivatives of dUTP which are commonly used for DNA labeling and are compatible with the commercial, CE-based genetic analyzers.
The goal we wanted to reach in our study was to find a new and more reliable way of detecting and analyzing the structural heterogeneity of transcripts. This problem is important when fragments of larger RNAs are taken out of their sequence context for detailed structure characterization. The isolated fragments, in spite of having a single sequence, may form two or more co-existing stable conformers, which seriously complicates their further analysis. In this study, we show some representative examples of structurally homogeneous and heterogeneous fragments of the BRCA1 transcript analyzed by both slab-gel electrophoresis and CE.
MATERIALS AND METHODS
DNA templates and in vitro transcription
The templates for in vitro transcription were synthesized by PCR from gel-purified amplification products of the BRCA1 gene or cDNA fragments as specified in Table 1. Forward primers used in the reamplification reaction contained the T7 RNA polymerase promoter sequence at the 5′ end. PCR was performed in a reaction volume of 20 µl and besides the appropriate template it contained: 1 µM each primer forward and reverse, 10 mM Tris–HCl (pH 9.0), 1.5 mM MgCl2, 50 mM KCl, 0.1% Triton X-100, 200 µM of each of the dNTPs, and 0.5 U Taq polymerase (Promega). PCR thermal conditions were: 95°C for 3 min and 35 cycles of 94°C for 1 s, 55–58°C for 1 s, 72°C for 20 s (see Table 1 for primer sequences and fragment-specific annealing temperatures).
Table 1. Characteristics of PCR products and in vitro transcripts.
| Symbols of PCR products/transcriptsa | DNA templates for PCR | Primer pairs | Tab (°C) | DNA/RNA length (bp/nt) |
|---|---|---|---|---|
| Primary PCR products | ||||
| ex1a-2 | cDNAc | Fex1a 5′-AAAACTGCGACTGCGCGGC | 55 | 220 |
| Rex2 5′-CAGATGGGACACTCTAAGATT | ||||
| ex1b-2 | cDNAd | Fex1b 5′-GGGCAGTTTGTAGGTCG | 55 | 478 |
| Rex2 5′-CAGATGGGACACTCTAAGATT | ||||
| BRCA1/20d | gDNAd | F20 5′-ATATGACGTGTCTGCTCCAC | 55 | 401 or 413 |
| R20 5′-GGGAATCCAAATTACACAGC | ||||
| Reamplification products used for in vitro transcription | ||||
| T7ex1a102/Ex1a102nt | ex1a-2 | T7Fex1a 5′-TAATACGACTCACTATAGGGAAAACTGCGACTGCGCGGC | 55 | 119/102 |
| R102 5′-AGGCCTCCTGAGCGCA | ||||
| T7ex1a/Ex1a | ex1a-2 | T7Fex1a 5′-TAATACGACTCACTATAGGGAAAACTGCGACTGCGCGGC | 55 | 141/124 |
| Rex1a 5′-CTTTACCCAGAGCAGAGG | ||||
| T7ex1a-2/Ex1a-2 | ex1a-2 | T7Fex1a 5′-TAATACGACTCACTATAGGGAAAACTGCGACTGCGCGGC | 55 | 240/223 |
| Rex2 5′-CAGATGGGACACTCTAAGATT | ||||
| T7ex1b/Ex1b | ex1b-2 | T7Fex1b 5′-TAATACGACTCACTATAGGGCAGTTTGTAGGTCG | 55 | 396/379 |
| Rex1b 5′-CAGCCGGTGTTTTTTGTTTT | ||||
| T7ex1a-fl/Ex1a47nt | ex1a-2 | T7Fex1a 5′-TAATACGACTCACTATAGGGAAAACTGCGACTGCGCGGC | 58 | 64/47 |
| Rex1a47bp 5′-GTCCAGGAAGTCTCAGC | ||||
| T7ex1b-fl/Ex1b64nt | ex1b-2 | T7Fex1b 5′-TAATACGACTCACTATAGGGCAGTTTGTAGGTCG | 58 | 81/64 |
| Rex1b64bp 5′-GGACACTCAGTGCCCC | ||||
| T7IVS20wt/IVS20wt | BRCA1/20e | T7F20 5′-TAATACGACTCACTATAGGAAAGCGAGCAAGAGAATC | 58 | 287/270 |
| R20 5′-GGGAATCCAAATTACACAGC | ||||
| T7IVS20+12bp/IVS20+12nt | BRCA1/20e | T7F20 5′-TAATACGACTCACTATAGGAAAGCGAGCAAGAGAATC | 58 | 299/282 |
| R20 5′-GGGAATCCAAATTACACAGC | ||||
aIn vitro transcripts are shown in italics.
bAnnealing temperature.
cQuick Screen cDNA from human testis (Clontech) (27).
dGenomic DNA extracted from the whole blood sample of IVS20+48ins12 carrier or non-carrier.
ePCR products differ in lengths depending on carrier status.
The transcription reactions carried out in a 50 µl volume contained: 10 pmol of DNA template, 400 U T7 RNA polymerase (Promega), 0.5 mM each ribo-NTPs, and 3 mM guanosine in a T7 RNA polymerase buffer supplemented with 10 mM DTT. The incubation temperature was 37°C for 1 h. The transcripts were purified in denaturing 6% polyacrylamide gels.
5′-End labeling of transcripts and native gel electrophoresis
The transcripts were 5′-end labeled with T4 polynucleotide kinase (Promega) and [γ-32P]ATP (4500 Ci/mmol; ICN), and were purified in denaturing polyacrylamide gels. All labeled transcripts were controlled for the number of co-existing stable conformers by electrophoresis, in 6 or 10% native polyacrylamide gels 400/300/0.4 mm (acrylamide/bisacrylamide, 29/1) buffered with 45 mM Tris-borate, at a fixed temperature of 20°C. The electrophoresis was conducted at a constant power of 20 W for 3–5 h, followed by autoradiography at –80°C with an intensifying screen. The preparation of RNA samples for electrophoresis is described in the legend to the figures.
RNA structure probing
The gel-purified 5′-end labeled transcripts were supplemented with an unlabeled tRNA carrier to a final concentration of 8 µM, and subjected to a denaturation and renaturation procedure in a solution containing 20 mM Tris–HCl (pH 7.2), 80 mM NaCl, 20 mM MgCl2, by heating the sample at 75°C for 1 min and slowly cooling it to room temperature. Limited RNA hydrolysis was initiated by mixing 5 µl of the RNA sample described above with 5 µl of a probe solution containing lead ions or S1 nuclease in water at different concentrations, as described in the legend to Figure 2. All reactions were performed at 20°C for 20 min, and stopped by adding an equal volume of stop solution (7.5 M urea, 20 mM EDTA and dyes) and sample freezing. The products of the RNA cleavages were separated in 6% polyacrylamide gels containing 7 M urea, 90 mM Tris-borate buffer and 2 mM EDTA, along with the products of limited digestion of the same RNA with ribonuclease T1 in semi-denaturing conditions (10 mM sodium citrate, pH 4.5, 0.5 mM EDTA, 4 M urea, at 55°C), and with an alkaline hydrolysis ladder prepared by incubating the labeled RNA in hot formamide with 0.5 mM magnesium ions at 100°C. The electrophoresis, performed at 1500 V, was followed by autoradiography at –80°C with an intensifying screen.
Figure 2.

Structure analysis of two BRCA1 intron 20 transcripts: wild-type IVS20wt and containing a 12 nt duplicated sequence IVS20+12nt. (A) CE in non-denaturing conditions of IVS20wt (left) and IVS20+12nt (right) transcripts fluorescently labeled at their 3′ end with TdT and [R110]dUTP (shadowed peaks); ROX-1000 internal standard (gray line). (B) Schematic illustration of the experimentally determined IVS20wt transcript secondary structure. Four independent structure modules (M1–M4) are shown. (C) (Top) Denaturing 6% polyacrylamide gel electrophoresis of 5′-end radiolabeled RNA fragments generated from IVS20wt (left) and IVS20+12nt (right), treated with lead ions (lane Pb) at a concentration of: P1, 0.25 mM; P2, 0.5 mM; P3, 1 mM; and S1 nuclease (lane S1) at a concentration of: S1, 0.5 U/µl; S2, 1 U/µl; S3, 2 U/µl (1 mM ZnCl2 was present in each reaction); lane C, incubation control (no probe); lane F, formamide ladder; lane T1, guanine-specific ladder. Selected guanine residues are numbered according to their positions in the sequence. (Bottom) Proposed secondary structure of the module M2 distinguishing the IVS20wt and IVS20+12nt transcripts. Cleavage sites and intensities are specified for each of the three probes used in this analysis (arrowheads, lead ions; squares, S1 nuclease; and triangles, T1 ribonuclease). RNA structure motifs are also indicated. The other three RNA structure modules are the same in both transcripts. (D) (Top) As in (C, top), but for IVS20+12nt transcript; (bottom) as in (C, bottom), but for M2+12nt module; the inserted 12 nt are shown in gray.
The fluorescent labeling of RNA at the 3′ end
The fluorescent labeling of in vitro transcripts at their 3′ end was achieved with three different 6-carboxyrhodamine derivatives of dUTP: R110, RG6 and TAMRA (Fig. 1A), and either of the two enzymes: Klenow fragment of DNA polymerase I or TdT.
Figure 1.

Efficiency of fluorescent 3′-end labeling of the BRCA1 transcripts. (A) Three rhodamine derivatives of dUTP used for 3′-end labeling of RNAs: [R110]dUTP (left), [RG6]dUTP (middle), [TAMRA]dUTP (right). The maximum emission wavelengths of fluorochromes used are 525, 549 and 572 nm for R110, RG6 and TAMRA, respectively. (B) CE in denaturing conditions of three BRCA1 transcripts: Ex1a47nt, Ex1b64nt and Ex1a-2, labeled with Klenow fragment and [R110]dUTP (top), [RG6]dUTP (middle) and [TAMRA]dUTP (bottom); TAMRA-500 or ROX-1000 internal standard (gray lines). (C) CE in denaturing conditions of three BRCA1 transcripts: Ex1a102nt, Ex1a and Ex1a-2, labeled with TdT and [R110]dUTP (top), [RG6]dUTP (middle), [TAMRA]dUTP (bottom). (D) Relative labeling efficiency of three different RNA molecules with three fluorescent dUTP derivatives using Klenow fragment. The shown labeling efficiency with [TAMRA]dUTP was multiplied by a factor of 4, as the emission intensity of this fluorochrome is four times lower than that for the other two rhodamine derivatives used. The data represent average values obtained in three independent experiments, and [R110]dUTP incorporation is taken as 100%. (E) As in (D), but using TdT to label five different RNAs.
The standard labeling reaction with Klenow fragment was performed in a 10–20 µl volume and contained: 5 µM gel-purified transcript, 20 µM oligodeoxynucleotide templates (ex1a47nt-fl 5′-CAGTCCAGGAAGTCTCA, ex1b64nt-fl 5′-TAGGACACTCAGTGCCC, ex1a-fl 5′-CACTTTACCCAGAGC and ex2-fl 5′-CACAGATGGGACAC) complementary to the 3′ end of the four RNA molecules to be labeled: Ex1a47nt, Ex1b64nt, Ex1a and Ex1a-2, respectively (non-complementary positions underlined), 20 µM labeled dUTP (PE Applied Biosystems), 50 mM Tris–HCl (pH 7.2), 10 mM MgSO4, 0.1 mM DTT, 20 U RNazin and 10 U Klenow fragment (Promega). The mixture containing all the components except the enzyme was heated to 80°C and immediately cooled to assure the efficient hybridization of DNA oligomer to the RNA molecule. The incorporation reaction was performed at 30°C for 30 min and stopped by sample freezing.
The fluorescent labeling with TdT was achieved in conditions in which the transcripts were extended by one single labeled dUTP residue. The molar ratio of RNA/dUTP was 1/0.5. The reaction was performed in a 10 µl mixture containing: 5 µM purified transcript, 2.5 µM labeled dUTP, 25 U TdT (Promega), 20 U RNazin, 100 mM cacodylate buffer (pH 6.8), 0.5 mM CoCl2 and 0.1 mM DTT. The reaction was performed at 37°C for 30 min and stopped by sample freezing.
Conditions of CE
The purified labeled transcripts dissolved in 50 µl of buffer containing 10 mM Tris–HCl (pH 7.2), 40 mM NaCl and 10 mM MgCl2 were denatured at 75°C for 1 min, renatured by slow cooling to room temperature, and analyzed by CE after further dilution in the same buffer (5–50 times depending on the transcript concentration and labeling efficiency). The electrophoresis was performed on a ABI 310 genetic analyzer (PE Applied Biosystems), an instrument equipped with an argon laser which emits the greatest intensity of light at 488 and 514.5 nm. The analysis was conducted in denaturing conditions [4% GeneScan polymer (PE Applied Biosystems), 6.5 M urea, 90 mM Tris-borate buffer and 2 mM EDTA at 42°C], and in non-denaturing conditions (5% GeneScan polymer, 45 mM Tris-borate buffer), using a standard 42 cm long capillary with a diameter of 50 µm (PE Applied Biosystems). The RNA samples were electro-injected together with the internal standard, either the ROX-500, ROX-1000 or TAMRA-500, at 15 kV for 10 s, and electrophoresis was performed for 15–20 min at 13 kV. The virtual filter A, allowing signal detection at wavelengths of 531, 560, 580 and 610 nm, was used in all separations. The results were analyzed using GeneScan software. To obtain reproducible results, all electropherograms were calibrated by fixing the positions of peaks produced by the DNA internal standard.
RESULTS
The labeling of RNA with fluorescent nucleotides
The Klenow fragment of DNA polymerase I from E.coli and TdT were examined for their activity in labeling transcripts with fluorescent nucleotides. In the reaction with Klenow fragment any RNA of known sequence may be extended by a single labeled deoxynucleotide in a DNA template-dependent manner (18). The oligodeoxynucleotides used in our study as templates were 14–17 nt long, and after hybridization to the 3′ portions of transcripts, contained dinucleotide overhangs 5′-YA (Y-T or C). The presence of the A residue at the second position of the template allowed transcript labeling with fluorescent derivatives of the complementary dUTP in the fill-in reaction with Klenow fragment. The dUTPs labeled with three different rhodamine analogs R110, RG6 and TAMRA (Fig. 1A) were tested for the efficiency of their incorporation onto the 3′-termini of three different RNAs. As it turned out, all studied dUTP derivatives could be incorporated to all RNAs. Their efficiency, however, varied, as has been shown by the results of the CE of the labeled transcripts performed in denaturing conditions (Fig. 1B). The labeling with the R110 derivative was most efficient; >50% of all the transcripts were elongated by a single dU residue, in comparison with RG6 being the second most effective. The extent of labeling with TAMRA was only 20% of that obtained with R110 (Fig. 1D). These results reflected differences in the affinity of the Klenow enzyme to the various dUTP derivatives that were used.
The labeling of RNA with TdT is template-independent and its efficiency is sensitive to the length and structure of the acceptor molecule (17). The number of incorporated nucleotides depends on the concentration of the reagents used and on the reaction time (17). In order to achieve a single nucleotide incorporation at the cost of labeling efficiency, the molar quantities of labeled deoxynucleotides that we used were two times lower than those of transcripts, and the reaction time was reduced to 30 min. This resulted in a moderate labeling yield; only ∼10% of the transcripts were charged with [R110]dUTP. The incorporation of TAMRA derivative was equally efficient, but the efficiency of labeling with [RG6]dUTP was by one order of magnitude lower (Fig. 1C and E). It should also be noted that the relative reactivity of the dUTP derivatives specified above was the same for all transcripts tested with each of the labeling methods (Fig. 1D and E).
CE confirms homogeneous RNA structures
The functional significance of the 12 bp insertion/duplication in intron-20 of the BRCA1 gene has been the subject of several recent studies (19–23). In our earlier work, the enhanced expression of a transcript with the insertion, and a causative role of the insertion itself in this effect, were postulated (24). Here, we describe the effect of this variant on the structure of the BRCA1 transcript in the intron-20 portion. Following the recently developed extended protocol for RNA structure analysis in a solution (25), we conducted an initial analysis of the in vitro transcripts (IVS20wt and IVS20+12nt) for their structure homogeneity. Both the traditional slab-gel electrophoresis of radioisotope-labeled transcripts in native gels (data not shown) and the CE of fluorescently labeled RNAs in non-denaturing conditions (Fig. 2A) were performed. Each type of analysis revealed the presence of a single stable conformer, which turned out to be the correct result confirmed by the good fitting of the experimental structure-probing data to a single secondary structure (Fig. 2B). The only structural feature which differentiated a transcript containing the 12 nt insertion from its shorter variant turned out to be the enlarged terminal loop E accommodating the inserted sequence (Fig. 2C and D). The functional role of this structural change has not been clarified yet.
Another example of straightforward structural studies in which CE successfully assisted was the analysis of the 379 nt long BRCA1 exon 1b transcript (Ex1b). This alternative first exon of the BRCA1 gene encoding the 5′-leader sequence was shown to be responsible for the translational downregulation of the BRCA1 gene (26). Also in this case, slab-gel electrophoresis (Fig. 3A) as well as CE (Fig. 3B) performed in native conditions were indicative of a single conformer, and these results proved correct after confronting the structure-probing data (data not shown). The advantage of CE in the above two cases is the possibility of achieving highly reproducible results more quickly.
Figure 3.
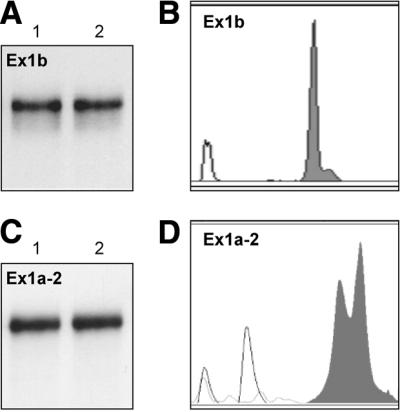
Structure analysis of two BRCA1 transcripts: Ex1a-2 and Ex1b. (A) Non-denaturing 6% polyacrylamide gel electrophoresis of 5′-end radiolabeled Ex1b transcript treated as follows: lane 1, dissolved in the structure-probing buffer (10 mM Tris–HCl pH 7.2, 10 mM magnesium ions, 40 mM NaCl) and heated to 75°C for 1 min (denaturation) and cooled slowly to 20°C (renaturation); lane 2, treated as above but with carrier RNA added to a final concentration of 8 µM. (B) CE in non-denaturing conditions of Ex1b transcript fluorescently labeled at its 3′ end with TdT and [R110]dUTP (shadowed peak); ROX-500 internal standard (gray line). (C and D) As described in (A) and (B) but for Ex1a-2 transcript.
CE reveals a heterogeneous RNA structure
The 223 nt long Ex1a-2 transcript of the BRCA1 exons 1a-2, which includes an alternative leader sequence, migrates as a single conformer in compliance with the result of the non-denaturing polyacrylamide gel electrophoresis (Fig. 3C). Unlike the RNAs described in the preceding section, the structure-probing data collected for that transcript were unable to fit any single secondary structure. The most likely explanation of this discrepancy was the structural heterogeneity of the analyzed transcript, which escaped detection by the native gel electrophoresis. Therefore, CE was performed and demonstrated the presence of two species (Fig. 3D). The knowledge gained with the help of CE strongly facilitated further structural studies of these conformers (26). They were analyzed as a mixture and the cleavage patterns obtained could be assigned to match two secondary structures that were predicted by the Mfold program (27).
Elimination of RNA structure heterogeneity
As described above, the structures of individual conformers present in simple two-component mixtures may still be resolved. However, the 124 nt long BRCA1 Ex1a transcript forms multiple stable conformers as revealed by slab-gel electrophoresis (Fig. 4A) and CE (Fig. 4B and C). It was shown by native slab-gel electrophoresis that neither the components of the reaction buffer used for RNA structure probing, the presence of RNA carrier, nor the subjecting of an RNA sample to the standard denaturation/renaturation procedure could significantly change the observed pattern of conformer separation (Fig. 4A). This indicates the rather high stability of these conformers which are not influenced by the conditions applied. Concerning the results obtained by CE it is worth noting that transcripts labeled with each of the three fluorescent dUTP derivatives gave exactly the same conformer separation patterns (Fig. 4B). This means that none of the different probes attached to the 3′ end is capable of changing the transcript structure. That the resolved peaks indeed represent different conformers of the same transcript was demonstrated by changed CE patterns at elevated temperatures (Fig. 4C) and by the presence of a single peak in the CE conducted in denaturing conditions (Fig. 1C).
Figure 4.

Analysis of structurally heterogeneous BRCA1 Ex1a and transcript truncation to obtain a homogeneous structure. (A) Non-denaturing 10% polyacrylamide gel electrophoresis of 5′-end radiolabeled Ex1a transcript treated as follows: lane 1, dissolved in water and incubated at 20°C for 30 min; lane 2, heated to 75°C for 1 min (denaturation) and cooled slowly to 20°C (renaturation); lane 3, dissolved in the structure-probing buffer (10 mM Tris–HCl pH 7.2, 10 mM magnesium ions, 40 mM NaCl) and incubated at 20°C for 30 min; lane 4, dissolved as described for lane 3 and subjected to the denaturation/renaturation procedure; lane 5, dissolved as described for lane 3, carrier RNA added to a final concentration of 8 µM, and incubated at 20°C for 30 min; lane 6, carrier RNA added and subjected to denaturation/renaturation. (B) CE in non-denaturing conditions of Ex1a transcript fluorescently labeled at its 3′ end with TdT and: [R110]dUTP, [RG6]dUTP, [TAMRA]dUTP (shadowed peaks); TAMRA-500 internal standard (gray line). (C) CE in non-denaturing polymer at temperatures: 30, 45 and 60°C of Ex1a transcript end labeled with [R110]dUTP and Klenow fragment. (D) Non-denaturing 10% polyacrylamide gel electrophoresis of 5′-end radiolabeled Ex1a transcript (0.5 µM) (lane 1), and the same transcript hybridized with 18 nt of Rex1a oligodeoxynucleotide complementary to its 3′ end (lane 2). Hybridization of transcript (1 µM) with oligodeoxynucleotide (1 µM) was performed in 15 mM Tris–HCl (pH 7.2), 10 mM MgCl2, 1.5 mM DTT by heating the sample at 90°C for 1 min and fast cooling. Arrowhead indicates the position of hybrid migration. (E) CE in non-denaturing conditions of Ex1a102nt transcript labeled with TdT and [RG6]dUTP (gray line indicates ROX-500 internal standard).
In cases of structurally heterogeneous transcripts the conformer separation is recommended either prior to or after structure probing and the relevant protocols have been described earlier (25). However, the elimination of structure heterogeneity may also be achieved by other means and transcript elongation or shortening are among the options. For the 124 nt Ex1a transcript, the latter approach was used. A homogenous structure was generated after the hybridization of complementary oligodeoxynucleotide (Rex1a) to the 3′ end of the Ex1a transcript (Fig. 4D). This result suggested that a transcript lacking the hybridized part will be structurally homogeneous. This expectation proved correct as shown by CE (Fig. 4E) and slab-gel electrophoresis (data not shown). The structure-probing results collected for this 22 nt shorter Ex1a102nt transcript fit perfectly into the proposed single secondary structure (26).
DISCUSSION
With the rapid progress of research on transcripts of eukaryotic genes and the entire transcriptomes it has become clear that mRNAs are regulated at many levels by a variety of trans-acting factors (28,29) and cis-elements hidden in their sequences and structures (26,30,31). The structures and functions of these elements need to be precisely characterized, and the structure analysis is usually performed by chemical and enzymatic probing (32,33). When fragments of large RNAs are selected for end labeling and structure analysis it is strongly recommended to check the in vitro transcripts for their structure homogeneity (25). This is usually done by polyacrylamide gel electrophoresis in non-denaturing conditions, which is laborious and time consuming. In this work, we have shown a successful adaptation of CE for this purpose, and have demonstrated its advantages compared to slab-gel electrophoresis. In our experiments we used easily available reagents for labeling transcripts with fluorescent probes, and analyzed the labeled RNAs using generally available equipment. Thus, the proposed RNA-CE-LIF analysis may be widely applicable. Although the labeling reactions may be further optimized, we have shown in this study that the developed procedures work well with the dUTPs containing bulky rhodamine substituents. The advantage of end labeling with one probe molecule per transcript over internal labeling with multiple probes per transcript is obvious. The multiple probes placed at many different locations of the folded transcript may change its original structure. This undesired possibility was demonstrated for single-stranded DNA fragments internally labeled with fluorescent deoxynucleotides and analyzed by the single-strand conformation polymorphism (SSCP) method (34). The RNA fragments analyzed in our study were in the size range of ∼40–400 nt, i.e. they covered the length range of end-labeled transcripts that could be successfully analyzed by chemical and enzymatic probing. This is also the size range of DNA fragments analyzed by SSCP-CE-LIF to detect polymorphisms and mutations (34–36). In principle, the CE conditions optimal for SSCP should also be suitable for the analysis of RNA conformers.
As revealed by direct comparisons of the two electrophoresis methods, the structurally heterogeneous fragments analyzed in our study could be better resolved by CE. Another advantage of the CE separations is their rapidity. The entire analysis, depending on the transcript length and conformation, takes 15–20 min, which compares favorably to the hours required to complete such an analysis by polyacrylamide gel electrophoresis. Moreover, the fluorescence signal detection is at least one order of magnitude more sensitive than radioactivity detection (37). This not only allows the analysis of attomolar quantities of labeled transcripts, but also tolerates the lower efficiencies of labeling reactions.
In conclusion, the methods of fluorescent RNA end labeling described in this work pave the way for RNA structure analysis in the automated CE-LIF format. The detailed RNA structure probing by chemical and enzymatic methods should also be feasible, likewise many other applications for which radiolabeling is being currently used.
Acknowledgments
ACKNOWLEDGEMENTS
This work was supported by the State Committee for Scientific Research, grant nos 6P04B03118 and PBZ/KBN/040/P04/12 and the Foundation for Polish Science, grant nos 117/96 and 8/2000.
REFERENCES
- 1.Saevels J., Van Schepdael,A. and Hoogmartens,J. (1999) Capillary electrophoresis of RNA oligonucleotides: catalytic activity of a hammerhead ribozyme. Anal. Biochem., 266, 93–101. [DOI] [PubMed] [Google Scholar]
- 2.Epperson J.D., Dodge,J., Rill,R.L. and Greenbaum,N.L. (2001) Analysis of oligonucleotides and unincorporated nucleotides from in vitro transcription by capillary electrophoresis in Pluronic F127 gels. Electrophoresis, 22, 771–778. [DOI] [PubMed] [Google Scholar]
- 3.Skeidsvoll J. and Ueland,P.M. (1996) Analysis of RNA by capillary electrophoresis. Electrophoresis, 17, 1512–1517. [DOI] [PubMed] [Google Scholar]
- 4.Todorov T.I., de Carmejane,O., Walter,N.G. and Morris,M.D. (2001) Capillary electrophoresis of RNA in dilute and semidilute polymer solutions. Electrophoresis, 22, 2442–2447. [DOI] [PubMed] [Google Scholar]
- 5.Han F. and Lillard,S.J. (2000) In-situ sampling and separation of RNA from individual mammalian cells. Anal. Chem., 72, 4073–4079. [DOI] [PubMed] [Google Scholar]
- 6.Zabzdyr J.L. and Lillard,S.J. (2002) Electrophoretic profiling of both RNA and protein from a single 250-pL sample. Anal. Chem., 74, 1857–1862. [DOI] [PubMed] [Google Scholar]
- 7.Han F. and Lillard,S.J. (2002) Monitoring differential synthesis of RNA in individual cells by capillary electrophoresis. Anal. Biochem., 302, 136–143. [DOI] [PubMed] [Google Scholar]
- 8.Khandurina J., Chang,H.S., Wanders,B. and Guttman,A. (2002) Automated high-throughput RNA analysis by capillary electrophoresis. Biotechniques, 32, 1226, 1228, 1230. [DOI] [PubMed] [Google Scholar]
- 9.Katsivela E. and Hofle,M.G. (1995) Separation of transfer RNA and 5S ribosomal RNA using capillary electrophoresis. J. Chromatogr. A, 700, 125–136. [DOI] [PubMed] [Google Scholar]
- 10.Zabzdyr J.L. and Lillard,S.J. (2001) UV- and visible-excited fluorescence of nucleic acids separated by capillary electrophoresis. J. Chromatogr. A, 911, 269–276. [DOI] [PubMed] [Google Scholar]
- 11.Cellai L., Onori,A.M., Desiderio,C. and Fanali,S. (1998) Capillary electrophoretic analysis of synthetic short-chain oligoribonucleotides. Electrophoresis, 19, 3160–3165. [DOI] [PubMed] [Google Scholar]
- 12.Ogura M., Agata,Y., Watanabe,K., McCormick,R.M., Hamaguchi,Y., Aso,Y. and Mitsuhashi,M. (1998) RNA chip: quality assessment of RNA by microchannel linear gel electrophoresis in injection-molded plastic chips. Clin. Chem., 44, 2249–2255. [PubMed] [Google Scholar]
- 13.Mucha P., Szyk,A., Rekowski,P., Guenther,R. and Agris,P.F. (2002) Interaction of RNA with phage display selected peptides analyzed by capillary electrophoresis mobility shift assay. RNA, 8, 698–704. [DOI] [PMC free article] [PubMed] [Google Scholar]
- 14.England T.E. and Uhlenbeck,O.C. (1978) 3′-terminal labelling of RNA with T4 RNA ligase. Nature, 275, 560–561. [DOI] [PubMed] [Google Scholar]
- 15.Lingner J. and Keller,W. (1993) 3′-end labeling of RNA with recombinant yeast poly(A) polymerase. Nucleic Acids Res., 21, 2917–2920. [DOI] [PMC free article] [PubMed] [Google Scholar]
- 16.Martin G. and Keller,W. (1998) Tailing and 3′-end labeling of RNA with yeast poly(A) polymerase and various nucleotides. RNA, 4, 226–230. [PMC free article] [PubMed] [Google Scholar]
- 17.Rosemeyer V., Laubrock,A. and Seibl,R. (1995) Nonradioactive 3′-end-labeling of RNA molecules of different lengths by terminal deoxynucleotidyltransferase. Anal. Biochem., 224, 446–449. [DOI] [PubMed] [Google Scholar]
- 18.Huang Z. and Szostak,J.W. (1996) A simple method for 3′-labeling of RNA. Nucleic Acids Res., 24, 4360–4361. [DOI] [PMC free article] [PubMed] [Google Scholar]
- 19.Sobczak K., Kozlowski,P., Napierala,M., Czarny,J., Wozniak,M., Kapuscinska,M., Losko,M., Koziczak,M., Jasinska,A., Powierska,J., Braczkowski,R., Breborowicz,J., Godlewski,D., Mackiewicz,A. and Krzyzosiak,W.J. (1997) Novel BRCA1 mutations and more frequent intron-20 alteration found among 236 women from Western Poland. Oncogene, 15, 1773–1779. [DOI] [PubMed] [Google Scholar]
- 20.Robledo M., Osorio,A., Sentis,C., Albertos,J., Estevez,L. and Benitez,J. (1997) The 12 base pair duplication/insertion alteration could be a regulatory mutation. J. Med. Genet., 34, 592–593. [DOI] [PMC free article] [PubMed] [Google Scholar]
- 21.Dork T., Skawran,B., Stuhrmann,M., Bremer,M. and Karstens,J.H. (1999) BRCA1 expression is not affected by the intronic 12 bp duplication. J. Med. Genet., 36, 262–263. [PMC free article] [PubMed] [Google Scholar]
- 22.Scholl T., Pyne,M.T., Ward,B. and Pruss,D. (1999) Biochemical and genetic characterisation shows that the BRCA1 IVS20 insertion is a polymorphism. J. Med. Genet., 36, 571–572. [PMC free article] [PubMed] [Google Scholar]
- 23.Jasinska A. and Krzyzosiak,W.J. (2001) Prevalence of BRCA1 founder mutations in western Poland. Hum. Mutat., 17, 75. [DOI] [PubMed] [Google Scholar]
- 24.Kozlowski P., Sobczak,K., Jasinska,A. and Krzyzosiak,W.J. (2000) Allelic imbalance of BRCA1 transcript in the IVS20 12-bp insertion carrier. Hum. Mutat., 16, 371. [DOI] [PubMed] [Google Scholar]
- 25.Krzyzosiak W.J., Napierala,M. and Drozdz,M. (1999) RNA structure modules with trinucleotide repeats motifs. In Barciszewski,J. and Clark,B.F.C. (eds), RNA Biochemistry and Biotechnology. Kluwer Academic Publishers, Dordrecht, The Netherlands, pp. 303–314.
- 26.Sobczak K. and Krzyzosiak,W.J. (2002) Structural determinants of BRCA1 translational regulation. J. Biol. Chem., 277, 17349–17358. [DOI] [PubMed] [Google Scholar]
- 27.Mathews D.H, Sabina,J., Zuker,M. and Turner,D.H. (1999) Expanded sequence dependence of thermodynamic parameters improves prediction of RNA secondary structure. J. Mol. Biol., 288, 911–940. [DOI] [PubMed] [Google Scholar]
- 28.Dreyfuss G., Kim,V.N. and Kataoka,N. (2002) Messenger-RNA-binding proteins and the messages they carry. Nature Rev. Mol. Cell Biol., 3, 195–205. [DOI] [PubMed] [Google Scholar]
- 29.Mattick J.S. (2001) Non-coding RNAs: the architects of eukaryotic complexity. EMBO Rep., 2, 986–991. [DOI] [PMC free article] [PubMed] [Google Scholar]
- 30.Schaeffer C., Bardoni,B., Mandel,J.L., Ehresmann,B., Ehresmann,C. and Moine,H. (2001) The fragile X mental retardation protein binds specifically to its mRNA via a purine quartet motif. EMBO J., 20, 4803–4813. [DOI] [PMC free article] [PubMed] [Google Scholar]
- 31.Napierala M. and Krzyzosiak,W.J. (1997) CUG repeats present in myotonin kinase RNA form metastable ‘slippery’ hairpins. J. Biol. Chem., 272, 31079–31085. [DOI] [PubMed] [Google Scholar]
- 32.Ehresmann C., Baudin,F., Mougel,M., Romby,P., Ebel,J.P. and Ehresmann,B. (1987) Probing the structure of RNAs in solution. Nucleic Acids Res., 15, 9109–9128. [DOI] [PMC free article] [PubMed] [Google Scholar]
- 33.Brunel C. and Romby,P. (2000) Probing RNA structure and RNA–ligand complexes with chemical probes. Methods Enzymol., 318, 3–21. [DOI] [PubMed] [Google Scholar]
- 34.Inazuka M., Tahira,T. and Hayashi,K. (1996) One-tube post-PCR fluorescent labeling of DNA fragments. Genome Res., 6, 551–557. [DOI] [PubMed] [Google Scholar]
- 35.Inazuka M., Wenz,H.M., Sakabe,M., Tahira,T. and Hayashi,K. (1997) A streamlined mutation detection system: multicolor post-PCR fluorescence labeling and single-strand conformational polymorphism analysis by capillary electrophoresis. Genome Res., 7, 1094–1103. [DOI] [PMC free article] [PubMed] [Google Scholar]
- 36.Kozlowski P. and Krzyzosiak,W.J. (2001) Combined SSCP/duplex analysis by capillary electrophoresis for more efficient mutation detection. Nucleic Acids Res., 29, e71. [DOI] [PMC free article] [PubMed] [Google Scholar]
- 37.Landers J.P., Oda,R.P., Spelsberg,T.C., Nolan,J.A. and Ulfelder,K.J. (1993) Capillary electrophoresis: a powerful microanalytical technique for biologically active molecules. Biotechniques, 14, 98–111. [PubMed] [Google Scholar]