Abstract
Topoisomerase II plays a crucial role during chromosome condensation and segregation in mitosis and meiosis and is a highly attractive target for chemotherapeutic agents. We have identified previously topoisomerase II and heat shock protein 90 (Hsp90) as part of a complex. In this paper we demonstrate that drug combinations targeting these two enzymes cause a synergistic increase in apoptosis. The objective of our study was to identify the mode of cell killing and the mechanism behind the increase in topoisomerase II mediated DNA damage. Importantly we demonstrate that Hsp90 inhibition results in an increased topoiosmerase II activity but not degradation of topoisomerase II and it is this, in the presence of a topoisomerase II poison that causes the increase in cell death. Our results suggest a novel mechanism of action where the inhibition of Hsp90 disrupts the Hsp90–topoisomerase II interaction leading to an increase in and activation of unbound topoisomerase II, which, in the presence of a topoisomerase II poison leads to the formation of an increased number of cleavable complexes ultimately resulting in rise in DNA damage and a subsequent increase cell death.
INTRODUCTION
Topoisomerase II is required for the viability of all eukaryotic cells and plays important roles in DNA replication, recombination, transcription, chromosome segregation and the maintenance of the nuclear scaffold. In human and other mammalian cells, there are at least two forms (α and β) of the topoisomerase II enzyme (1,2). Topoisomerase II catalyses a transient double-stranded break in the DNA helix, allowing the passing of a second double strand of DNA through the break, which is then religated. Topoisomerase poisons acts by prolonging the lifetime of these open intermediate ‘cleavable complexes’ forming obstructions that eventually lead to DNA damage (3). DNA damage is normally sensed by ATM or ATR complexes upon double-strand breakage, which signals a cascade of events leading to Chk1 phosphorylation that in turn phosphorylates Cdc25A causing its inactivation by nuclear exclusion and degradation. The DNA damage signal via Chk1 also regulates Cdk1 (Cdc2)/Cyclin B, Wee1 and Cdc25A proteins that are crucial for the G2/M transition, by changing their expression, phosphorylation and cellular localization (4). Our research has previously identified topoisomerase II and heat shock protein 90 (Hsp90) as part of a complex (5).
Hsp90 is an essential and ubiquitous molecular chaperone that plays an important physiological role in the folding, activation and assembly of a broad range of client proteins (6). Hsp90 has become a target for cancer therapeutics as Hsp90 is up-regulated in numerous tumour cells (7), also the Hsp90 in these cells is primarily found in multi-protein complexes (8). It is proposed that Hsp90 ‘hides and protects’ mutant and defective proteins during the progression of a cancer. In particular Hsp90 interacts with the numerous mutated proteins found within such tumour cells and acts to prevent their detection by the G1 and G2/M cell cycle checkpoint apparatus (9). Inhibitors of Hsp90 [17-allylamino-17-demethoxygeldanamycin (17-AAG) and its parent compound geldanamycin] bind to the ATP-binding site of Hsp90 and act as a competitive inhibitor for the Hsp90 ATPase activity destabilizing the Hsp90–client protein interaction causing the degradation of a number of client proteins (10–13).
The effect of topoisomerase II poisons in conjunction with Hsp90 inhibitors has received little attention. Previous studies have focused on the use of Hsp90 inhibitors in combination with doxorubicin, which has a number of modes of action, one of which is as a topoisomerase II poison (14,15). Evidence for any synergistic effect is conflicting with synergy being observed for breast cancer derived cell lines (15) but not cells expressing Bcr-Abl (14).
We have shown previously that inhibition of Hsp90 enhances the cell killing properties of topoisomerase II poisons in a p53 independent manner; however, the mode of cell death and its mechanism were not characterized (5). In this paper we demonstrate that inhibition of Hsp90 (geldanamycin) sensitizes cells to a topoisomerase II poison (etoposide), that this effect is synergistic over a range of concentrations and that cell death is via apoptosis. In this paper we also hypothesize that the apoptosis induced by the combination of a topoisomerase II poison and an Hsp90 inhibitor occurs via a previously unidentified, topoisomerase II dependant mechanism. The synergistic killing effect appears to be mediated via an activation of topoisomerase II, which because of the presence of the topoisomerase II poison leads to an increase in DNA damage, for which we propose a model. Understanding the processes behind the drug combination effect is important because it will have profound effects on the way that topoisomerase II poisons will be used with Hsp90 inhibitors in the clinical setting.
MATERIALS AND METHODS
Cell lines
The isogenic human colon cancer cell lines, HCT116 wild type (WT) and p53−/−, were a kind gift from Prof. B. Vogelstein, The John Hopkins Medical Institutions (Baltimore, MD). Cells were maintained in McCoys 5A medium (Sigma-Aldrich Company Ltd, Poole, Dorset, UK) supplemented with 10% foetal calf serum (Invitrogen Ltd, Paisley, Scotland, UK) at 37°C in a 5% CO2 enriched humidified environment.
Drugs
Vepesid® (etoposide) was obtained from Bristol-Myers Pharmaceuticals (Hounslow, UK) and Novantrone® (mitoxantrone) from Cyanamid (Gosport, Hampshire, UK). Geldanamycin was a kind gift from Dr R. J. Schultz, Drug Synthesis and Chemistry Branch, Developmental Therapeutics Program, National Cancer Institute (Rockville, MD). Geldanamycin was also obtained from Tocris Cookson Ltd (Avonmouth, UK) and radicicol was obtained from Sigma-Aldrich Company Ltd.
Antibodies
Rabbit anti-topoisomerase IIα, mouse anti-(pan)actin, β-actin, antibodies were purchased from Lab Vision (UK) Ltd (Newmarket, Suffolk, UK), Chk1 antibody from Abcam Ltd (Cambridge, UK) and the rabbit anti-topoisomerase IIβ (IHIC2) antibody was a kind gift from Prof. I. Hickson (Weatherall Institute of Molecular Medicine, Oxford, UK).
Immunoblotting
Whole cell extracts were separated by 7.5, 10 or 15% SDS–PAGE under reducing conditions and blotted onto Protran® nitrocellulose membrane (Schleicher and Schuell UK Ltd, London, UK). Blots were probed with appropriate primary antibodies and the secondary antibodies conjugated with horse radish peroxidase (DAKOCytomation Ltd Ely, UK) detection was by Supersignal® West Dura Extended Substrate (Perbio Science UK Ltd, Tattenhall, UK) and imaged using a Fluor-S™ bioimager (Bio-Rad Laboratories Ltd, Hemel Hempstead, UK).
Growth inhibition assay
For growth inhibition studies we used the sulforhodamine B (SRB) assay as described previously (16). In brief, cells were seeded into 96-well microtiter plates allowed to adhere overnight and then drugs were added in six replicate wells for a period of up to 7 days. At fixed time points cells were fixed with 3:1 methanol:acetic acid and stained with 0.4% (w/v) SRB.
Detection of apoptosis by time laps florescence microscopy
HCT116 cells were seeded at a density of 1 × 10⁵ cells in 35 mm glass bottom microwell dishes (MatTek, Ashland, MA) and left to adhere for 96 h. The MatTek media volume was adjusted to 2 ml and cells were placed on the CO2 controlled incubated microscope stage for ∼2 h to equilibrate. Cells were treated with 2 µM etoposide (VP16), 500 nM geldanamycin (GA) or the combination of the two in the presence of 15 µg/ml propidium iodide (Sigma-Aldrich Company Ltd) and 40 ng/ml annexinV-FITC (BioSource International, Camarillo, CA). Cells were imaged in a humidified CO2 incubator (at 37°C, 5% CO2) every 15 min using a Zeiss Axiovert 200 with a 20× FLUAR objective (Carl Zeiss Ltd, Welwyn Garden City, Hertfordshire, UK). Excitation of FITC was performed using an argon ion laser at 488 nm. Emitted light was reflected through a 505–550 nm bandpass filter from a 540 nm dichronic mirror. Propidium iodide was excited using a green helium neon laser at 543 nm and detected through a 570 nm long-pass filter. Data capture and analysis was performed using LSM510 version 3.2 software (Carl Zeiss Ltd). Four fields from within an individual treatment were studies and individual cells scored for their initial staining with annexinV-FITC and/or PI, a minimum of 350 cells per treatment were followed (only the initial staining event is used to produce a score for a particular cell). Data are represented as normalized to time zero.
Alkaline single cell gel electrophoresis ‘Comet’ assay
Treated cells were harvested, 1 ml of 1% low melting point agarose added, transferred to a polysine microscope slide (BDH, Poole, UK) coated with 1% agarose on ice and allowed to set. The slides were incubated in the dark in lysis buffer (100 mM Tris, pH 10.5, 2.5 M NaCl, 100 mM EDTA, 1% v/v dimethyl sulfoxide and 1% v/v Triton X-100) on ice for 1 h and washed four times for 15 min with dH2O. DNA was then allowed to unwind by incubation with 50 mM NaOH, 1 mM EDTA, pH 12 for 1 h in the dark at 4°C. The slides were then subjected to electrophoresis at 20 V for 20 min, stained with 2.5 µg/ml propidium iodide for 1 h and destained with dH2O for 1 h. Images were captured using a Leica AS LMD microscope (Leica Microsystems, Milton Keynes, UK) and comet tail lengths were measured using Leica LMD version 3.1.0.2 software. The data shown in Figure 5 represent at least three independent drug treatments per time point.
Small-scale preparation of topoisomerase II extracts
Topoisomerase II was extracted from cells according to the manufacturer's instructions, Topoisomerase II assay kit (Topogen Inc., Columbus, OH), with minor modifications: NP40 was added to the nuclear lysis buffer, to a final concentration of 1%, and an equal volume of 0.5 M NaCl was added to the resuspended nuclei.
Topoisomerase II DNA decatenation assay
Nuclear extracts were assayed for topoisomerase II activity using a Topoisomerase II assay kit (Topogen Inc.). The nuclear extracts were incubated with geldanamycin (GA) or radicicol (RD) on ice for 15 min, then 0.25–2 µl of these reactions were incubated with 0.125 mg kinetoplast DNA (kDNA) in the presence of topoisomerase II assay buffer (50 mM Tris–HCl, pH 8.0, 120 mM KCl, 10 mM MgCl2, 0.5 mM ATP, 0.5 mM DTT and 30 µg/ml BSA) at 37°C for 30 min. Reactions were stopped by the addition of 1/5 vol of 5× AGE loading buffer and subjected to agarose gel electrophoresis and DNA visualized using a FX™ molecular Imager (Bio-Rad Laboratories Ltd).
In vivo complex of enzyme (ICE) assay
The ICE assay was performed as described previously (17). Briefly, cells were seeded at 1 × 10⁶ cells per 150 mm dishes (five dishes for each treatment) and allowed to adhere overnight. The cells were then exposed to the drugs for 1 h, collected and lysed with 1 ml 1% sarkosyl in TE buffer (10 mM Tris–HCl, pH 8.0, 1 mM EDTA). The cell lysates were then placed into polyallomer tubes containing 3 ml caesium chloride step gradients of 1.82, 1.72, 1.50 and 1.37 g/ml. Samples were then subjected to centrifugation at 20°C in a Beckman SW41 rotor at 30 000 r.p.m. for 24 h. Approximately 500 µl of each fraction was collected from the bottom of the tube. A 100 µl aliquot of each fraction was diluted with 100 µl of 25 mM sodium-phosphate buffer, pH 6.5, and applied onto applied onto pre-soaked (25 mM sodium-phosphate buffer, pH 6.5, for 15 min) Protran® nitrocellulose membranes using a slot blot vacuum manifold. Membranes were washed with sodium-phosphate buffer and immunoblotted with anti-human topoisomerase IIα antibodies. The DNA content of each fraction was visualized by agarose gel electrophoresis.
RESULTS
The combination of a topoisomerase II poison and an Hsp90 inhibitor cause synergistic apoptosis cell death
In our previous studies we demonstrated that topoisomerase II and Hsp90 were part of a complex and that Hsp90 inhibition enhances the cell killing properties of topoisomerase II poisons in a p53 independent manner. We now want to show that this synergy occurred over a range of drug ratios, that the mode of cell death is apoptosis and that the combination affects the timing of the initiation of apoptosis.
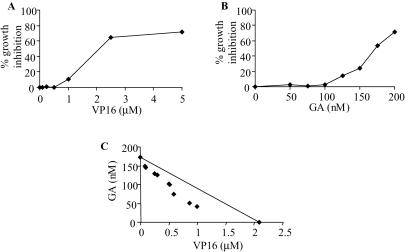
We tested the sensitivity of cells, in which the interaction between Hsp90 and topoisomerase II has been disrupted by geldanamycin. Cells were treated with a broad range of etoposide (VP16) concentrations, a topoisomerase II poison and geldanamycin alone in order to determine the concentrations at which 50% growth inhibition occurred, using the SRB assay, these concentrations were found to be 2.1 µM etoposide (Figure 1A) and 175 nM geldanamycin (Figure 1B). The concentrations of the two drugs were decreased and used in a number of different combinations, the results shown in Figure 1C show that the combinations tested are synergistic according to the isobolar method (18). These drugs have little or no effect when used in isolation at the concentrations tested.
Figure 1.
Growth inhibition assays for HCT116 WT cells. HCT116 WT cells were seeded at a density of 3 × 10³ per well in 96-well flat-bottomed plates and were treated with etopside (VP16), geldanamycin (GA) or combinations of both for 7 days. At a fixed time point, cells were fixed, stained with SRB and read at A570 nm. (A) Single VP16 dose response curve. Points represent the average of six replicates as a percentage growth inhibition of cells after 7 days. (B) Single GA dose response curve. Points represent the average of six replicates as a percentage growth inhibition of cells after 7 days. (C) Concentrations of VP16 and GA, in combination, resulting in 50% growth inhibition. The line on the graph connects the points at which the single drug concentrations give 50% inhibition. Combinations that plot below that line are synergistic (18).
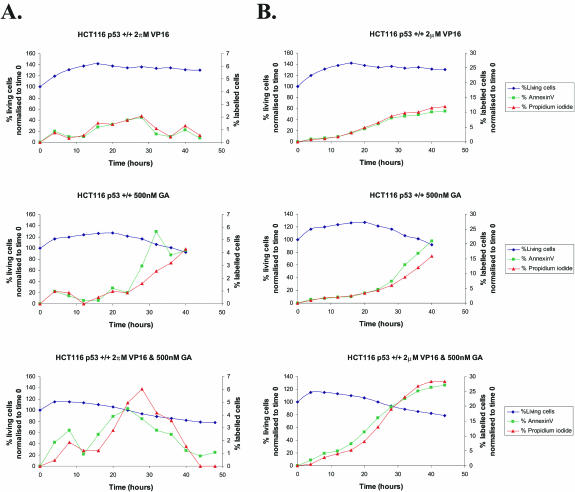
Previously apoptosis for cells treated with doxorubicin and geldanamycin was established using nuclear fragmentation observation (14,15). To demonstrate that the combination of etoposide (topoisomerase II poison) and geldanamycin (Hsp90 inhibitor) causes cell death by apoptosis in HCT116 cells and importantly the timing of this event; HCT116 cells were treated with 2 µM etoposide, 500 nM geldanamycin or the combination of the two, over a period of 48 h, the cells were imaged every 15 min. Figure 2A demonstrates the percentage of cells undergoing apoptosis, as indicated by the binding of annexin-V. Figure 2B represents the cumulative total percentage of cells displaying DNA damage or undergoing apoptosis. This clearly shows that a greater percentage of cells treated with the combination of etoposide and geldanamycin are undergoing apoptosis compared with those treated with the single drugs. Also in the combination, apoptosis detection (>5% of cells being Annexin V positive) occurs at ∼5 h whereas this is only achieved at 20 h for etoposide and 25 h for geldanamycin.
Figure 2.
Combined etoposide (VP16) and geldanamycin (GA) treatment of HCT116 cells causes cellular death by apoptosis. HCT116 cells were seeded at a density of 1 × 10⁵ cells in 35 mm glass bottom microwell dishes, left to adhere for 96 h. And were treated with 2 µM etoposide (VP16), 500 nM geldanamycin (GA) or a combination of the two over a period of 48 h. Cells were imaged every 15 min in the presence of 15 µg/ml propidium iodide (PI) and 40 ng/ml annexin-V-FITC (AnnV) using a Zeiss Axiovert 200. FITC was excited at 488 nm and emitted at 540 nm. PI fluorescence was excited at 543 nm and emitted at 570 nm. Data capture and analysis was carried out using LSM510 version 3.2 software. Individual cells were scored for annexin-V and/or PI, cell percentages and were normalized to time zero. (A) Percentage of cells binding annexin-V and PI over time. (B) Cumulative total percentage of cells binding annexin-V and PI. Lines on graphs; Navy blue = viable cells; green = annexin-V; red = propidium iodide. For information, at the 5 h time point the staining of the control cells, no drug treatment was 0.6% with PI and 0.6% with annexinV.
From these results we conclude that the drug combination is effective over a range of drug ratios (1 µM etoposide:42.5 nM geldanamycin to 80 nM etoposide:150 nM geldanamycin), that cell death is via apoptosis and more importantly that this process occurs 15 h earlier in the combination treated cells. In addition, FACs cell cycle analysis data show that there is virtually no change in the cell cycle distribution when the different treatment groups are compared, up to 2 h (data not shown).
Topoisomerase II is not degraded in response to Hsp90 inhibition
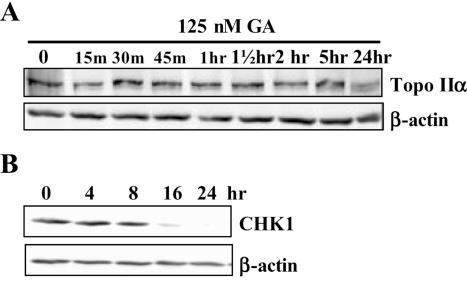
Previous studies have shown that upon inhibition of Hsp90, interacting proteins such as Bcr-Abl are targeted to the proteasome for degradation (14). To test whether inhibition of Hsp90 causes degradation of topoisomerase II total cell lysates, from HCT116 cells treated with 125 nM geldanamycin over a period of 24 h, were subjected to western blot analysis using an anti-topoisomerase IIα antibody. Degradation was not observed until 24 h (Figure 3A).
Figure 3.
The effect of geldanmycin on topoisomerase IIα and Chk1 degradation. HCT116 cells were treated with 1.3 µM geldanamycin over a 24 h period and total cell extracts taken as indicated above the lanes. Cell lysates were separated on a 10% SDS–polyacrylamide gel and subsequent western blots were probed with anti-human topoisomerase IIα (A) anti-human Chk1 (B) and β-actin antibodies. The parallel non-drug treated cells only control gave a result equivalent to the time zero sample.
Chk1 is degraded in response to Hsp90 inhibition
Chk1 is a key component of the DNA repair/cell death decision-making machinery (4). We wished to determine whether Chk1 plays a role in the synergistic cell killing observed for an Hsp90 inhibitor and a topoisomerase II poison. HCT116 cells were treated with geldanamycin over a period of 24 h and subjected to western blot analysis using an anti-Chk1 antibody. Figure 3B shows that Chk1 is not degraded in HCT116 until 8–16 h following treatment with geldanamycin. This is in agreement with previous studies that showed that Chk1 was degraded following treatment with the Hsp90 inhibitor 17-AAG (19).
In conclusion we have demonstrated that following treatment with an Hsp90 inhibitor topoisomerase II α degradation does not occur for at least 5 h after Hsp90 inhibition (this is also true for topoisomerase II β, data not shown) and that Chk1 is not degraded for at least 8 h. However, apoptosis can be observed at 5 h and substantial DNA damage at 1 h (see below).
Hsp90 inhibition causes an increase in topoisomerase II catalytic activity
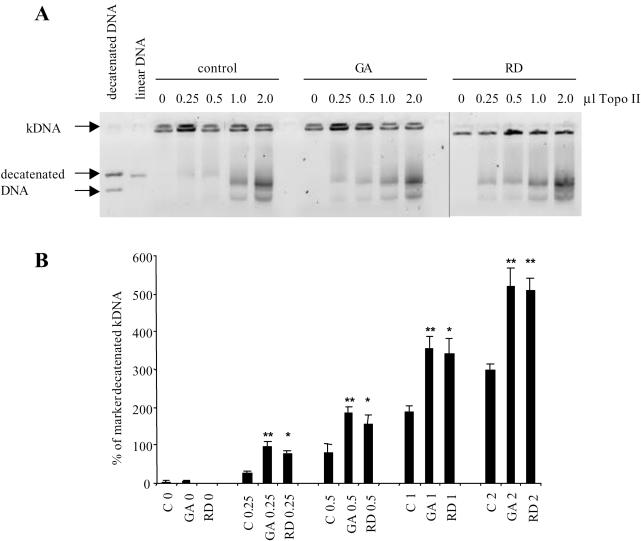
As topoisomerase II is not degraded when Hsp90 is inhibited, we tested the possibility that topoisomerase II would be released from the complex, which would result in the increased topoisomerase II activity. This in turn, could then be incorporated into lethal cleavable complexes when a topoisomerase II poison is present. This would ultimately cause increased DNA damage and subsequent cell death. An increase in topoisomerase II activity was initially tested for in cells treated with geldanamycin, within each experimental set we observed an increase in topoisomerase II activity over the non-drug treated control; however, the amount observed between experiments was highly variable. More reproducible data were obtained using nuclear extracts from sub-confluent HCT116 WT cells that were incubated at 37°C with kDNA. The same nuclear extract was treated with Hsp90 inhibitors, geldanamycin and radicicol, or an equal volume of diluent and then incubated with kDNA. The decatenated bands, the results from three independent experiments, Figure 4A and B, demonstrates that Hsp90 inhibition results in a significant increase in topoisomerase II catalytic activity. Treatment groups were compared using a one-way analysis of variance followed by a comparison of treatment means versus control using the Bonferroni comparison and was noted as significant if P < 0.05.
Figure 4.
The effect of Hsp90 inhibition upon topoisomerase II activity. Decatenation of kDNA by a range of volumes (µl) of topoisomerase II extracted from HCT116 WT cells. Extracts were incubated with the Hsp90 inhibitors geldanamycin (GA) or radicicol (RD) or an equal volume of diluent. An equivalent volume of the extract was then added to the kDNA assay mixture. (A) A representative image of the effect of Hsp90 inhibition upon topoisomerase II activity. (B) Graphical representation of band densitometry analysis. Bars represent the mean of three independent experiments and the error bars represent the SE. Treatment groups were compared using a one-way analysis of variance followed by a comparison of treatment means versus control using the Bonferroni comparison and was noted as significant if P < 0.05, * = P < 0.05, ** = P < 0.01.
Combined etoposide and geldanamycin treatment causes increased DNA damage in HCT116 cells
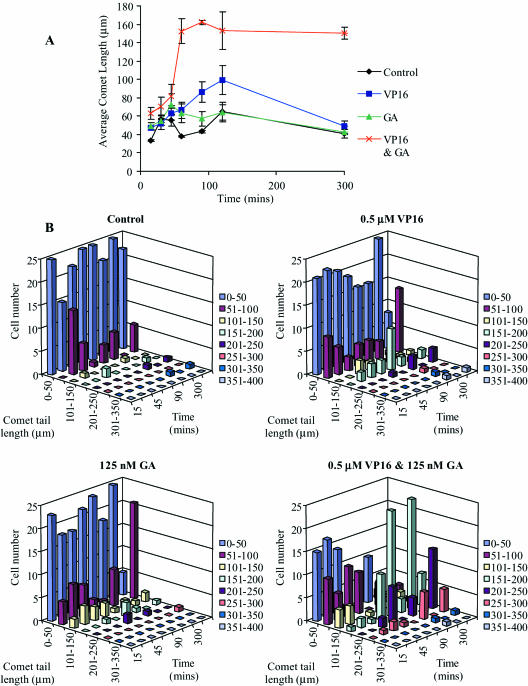
As the activity of topoisomerase II is increased in the presence of an Hsp90 inhibitor we hypothesized that in the presence of a topoisomerase II poison this would lead to increased DNA damage. The extent of DNA damage in HCT116 cells, when treated with the 0.5 µM etoposide and 125 nM geldanamycin combination, was determined by the comet assay, comet tails are proportional to the amount of DNA damage (20). After 30 min treatment, comet tails were detected and measured. The average comet tail length clearly revealed that more DNA damage occurred when the cells were treated with the combination of etoposide and geldanamycin (Figure 5A). After 5 h (300 min) the levels of DNA damage in the cells treated with the single drugs were almost back to control levels. However, cells treated with the drug combination still contained large amounts of damaged DNA, at this time point. Etoposide and geldanamycin when used alone caused DNA damage as determined by the formation of comet tails, but the majority of these only measured between 0 and 50 µm after subtraction of background levels in untreated samples. However, the combination of etoposide and geldanamycin caused an increase in the number of larger comet tail lengths, the majority of which were between 151 and 200 µm (Figure 5B). These results show that there is a dramatic increase in DNA damage observable at 1 h with the combination drug treatment and that this DNA damage remains constant possibly at a far greater level than DNA repair mechanisms can sustain. As a comment on the comet assay data, the early observable DNA damage is likely to be caused as a result of the presence of cleavable complexes; the later observable damage is probably a combination of cleavable complexes and apoptotic induced DNA degradation, with the relative contributions changing over time.
Figure 5.
The effect of drug combinations on comet tail formation. HCT116 cells were treated with etoposide, geldanamycin or a combination of the two over a period of 24 h and the comet tails lengths of 25 cells per drug treatment were determined. (A) Demonstrates the average comet tail length variation over time. Black line and diamond = untreated control; blue line and square = etoposide only treatment; green line and triangle = geldanamycin only treatment; red line and cross = geldanamycin and etoposide combined treatment. (B) Demonstrates the distribution of comet tail lengths over time with the doses as indicated.
Combined etoposide and geldanamycin treatment causes increased topoisomerase II–DNA cleavable complex formation in HCT116 cells, ICE assay
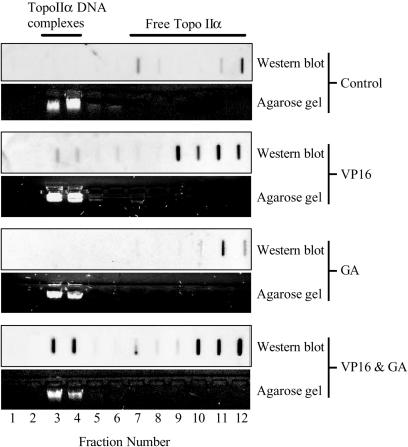
If our hypothesis is correct we would predict that the increase in DNA damage, at 1 h, is mediated via topoisomerase II–drug stabilized cleavable complexes. To confirm that the increase in DNA damage was topoisomerase II mediated HCT116 WT cells were treated with 2 µM etoposide, 500 nM geldanamycin or the combination of the two drugs for 1 h. The cells were then lysed and cell lysates were applied onto pre-formed CsCl step gradients and subjected to ultra-centrifugation for 24 h. Fractions were collected and applied onto nitrocellulose membranes and the presence of the DNA enzyme complex was tested for using an antibody against topoisomerase IIα. The DNA content of each fraction was estimated by agarose gel electrophoresis. There were no topoisomerase IIα–DNA complexes in the control or the geldanamycin treated cells. As expected, etoposide when used alone produced some topoisomerase IIα–DNA complexes; however, the amount of complexes dramatically increased when the two drugs were used in combination (Figure 6).
Figure 6.
Effect of VP16 and GA on topoIIα–DNA complexes. Cells were treated with 2 µM VP16, 500 nM GA and the combination of the two for 1 h. Cells were collected and lysed with 1% sarkosyl, loaded onto pre-formed CsCl step gradients and centrifuged at 30 000 r.p.m. for 24 h. Fractions were collected and applied onto nitrocellulose membranes, which were immunoblotted with anti-human topoisomerase IIα antibodies. Lanes 13–18 not shown.
DISCUSSION
Hsp90 inhibitors enhance the efficacy of topoisomerase II poisons (Figure 1) (5,14,15). Effective killing and topoisomerase II associated DNA damage is achieved after 1 h after treatment.
Many previous models for the sensitization of cell to drugs when used in combination with Hsp90 inhibition have focused on the degradation of Hsp90 client proteins. Hypoxia-inducible factor 1α (HIF-1α) an oxygen-regulated transcription factor which plays a critical role in the tumour cell response to hypoxia is associated with Hsp90, and degradation of HIF-1α by the proteasomal pathway is induced by geldanamycin (21). Inhibition of Hsp90 by geldanamycin has also been demonstrated to cause the degradation of ErbB-2 via proteolytic fragmentation leading to the formation of intracellular vesicles (22). Chk1 immunoprecipitates with Hsp90 and the role of Chk1 degradation following Hsp90 inhibition in sensitization of cells to topoisomerase I poisons has been the subject of a number of recent publications (23–25). Proposing that, at least in part, this effect is mediated through removal of the DNA damage induced cell cycle blockade. However, it is important to note that it is degraded 8–16 h following treatment with 17-AAG or geldanamycin (Figure 3B) (19).
Topoisomerase II poisons induce apoptotic cell death by causing double-strand breaks in the DNA. The enzyme is required to be present in order to generate the drug stabilized cleavable complex therefore its degradation would be counter productive if the enhanced cell killing effect is mediated via topoisomerase II. Figure 3A clearly shows that topoisomerase II is not degraded. On the contrary drug induced dissociation of the interaction between topoisomerase II and Hsp90 by geldanamycin or radicicol leads to an increase in topoisomerase II activity (Figure 4), this effect would be advantageous to the stabilization of the topoisomerase II cleavable complex. Increased topoisomerase mediated cell killing should equate with a concomitant increase in topoisomerase II-specific DNA damage as shown in Figures 4 and 6.
Topoisomerase II induced DNA damage is normally sensed by ataxia-telangiectasia mutated (ATM) or Rad3-related kinase (ATR), which signal a cascade of events leading to cell cycle arrest mediated via Chk1, allowing DNA repair or apoptotic death [for a review see (4)] When considering the role of Hsp90 inhibition as a blockade removal processes, i.e. the degradation of Chk1, the timing of events should be considered. Firstly Chk1 is only degraded after 8 h, at the earliest, whereas there is a massive increase in DNA damage at 1 h in the combination treatment (Figure 5) and the ICE assay (Figure 6), which is also performed at 1 h confirms that the majority of this is topoismerase II mediated. Our previous clonogenic assays studies were performed with 1 h exposure to the drugs which was then washed out also support an early pre 8 h event (5).
Therefore from the data outlined above we propose the following model to explain the synergistic co-operation of a topoisomerase II poison with an Hsp90 inhibitor. This proposal requires that following Hsp90 inhibition an active form of topoisomerase II be released. This was raised as a possibility, in our previous paper (5) along with an alternate where the effect could be due to independent activities of the drugs as described recently for topoisomerase I, where Hsp90 inhibitor-induced degradation of Chk1 sensitized tumour cells to chemotherapy due to loss of DNA damage check point control. The key to our model is that the lethal topoisomerase II mediated damage is observed at 1 h as opposed to a model based on Chk1 degradation where DNA damage could not occur until post 8 h, because the Chk1 block would still be present.
Our study is not alone in proposing that Hsp90 client proteins may be released, in an active form, after protection. This has been demonstrated previously for the dissociation of the Hsp90-Hsf-1 heterocomplexes, which results in the formation of active Hsf-1 trimers that are then able to regulate heat shock gene transcription (26).
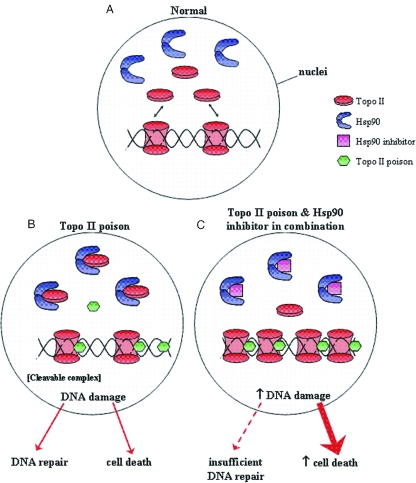
Figure 7 outlines our model. Under normal conditions within the nuclei topoisomerase II performs its function of maintaining DNA topology (Figure 7A). Upon treatment with a topoisomerase II poison, the topoisomerase II is locked onto the DNA holding it in an open conformation (cleavable complex). The Hsp90 protects a population of the topoisomerase II by association (Figure 7B). The Hsp90 inhibitor disrupts the Hsp90-topoisomerase II interaction thus leading to an increase in unbound topoisomerase II and activation, which if in the presence of a topoisomerase II poison, would lead to the formation of more cleavable complexes (Figure 7C). This would ultimately result in an increase in DNA damage and subsequently cell death. A caveat to this is that a certain amount of topoisomerase II may already be complexed with Hsp90 in the non-drug treated cell.
Figure 7.
Potential model for the mechanism of action. (A) Under ‘normal’ conditions, in the nuclei, topoisomerase II performs its function of maintaining DNA topology. (B) Upon treatment with a topoisomerase II poison, the topoisomerase II is locked onto the DNA holding it in an open conformation (cleavable complex). However, under these conditions a proportion of the topoisomerase II forms an inactive complex with Hsp90. (C) Hsp90 drugs disrupt the direct Hsp90–topoisomerase II interaction thus leading to an increase in unbound topoisomerase II which, if then treated with a topoisomerase II poison, leads to the formation of more cleavable complexes. This would ultimately result in an increase in DNA and subsequently cell death.
In conclusion our work establishes that Hsp90 and topoisomerase II form a complex and that upon treatment with an Hsp90 inhibitor and a topoisomerase II poison, a synergistic inhibition effect is observed. Inhibition of Hsp90 causes an increase in topoisomerase II activity in vitro, which is further evidence that disruption of Hsp90 interactions can lead to the activation of client proteins. This may not be a complete answer and there may indeed be a contribution from cell cycle blockade removal. It is, however, an interesting alternative model, which, following further investigation, could lead to a beneficial less toxic chemotherapeutic regime.
Acknowledgments
We thank Dr F. Burrows for his comments on this manuscript. Prof. B. Vogelstein The Johns Hopkins Oncology Centre for the HCT116 cell lines and Dr R. J. Schultz, Drug Synthesis and Chemistry Branch, Developmental Therapeutics Program, National Cancer Institute (Rockville, MD) NCI for geldanamycin. This work was supported by the North West Cancer Research Fund Grant CR525 and The Royal Liverpool and Broadgreen University Hospitals NHS Trust R&D support fund, grant number 2578. Funding to pay the Open Access publication charges for this article was provided by The School of Clinical Sciences, University of Liverpool.
Conflict of interest statement. None declared.
REFERENCES
- 1.Tsai-Pflugfelder M., Liu L.F., Liu A.A., Tewey K.M., Whang-Peng J., Knutsen T., Huebner K., Croce C.M., Wang J.C. Cloning and sequencing of cDNA encoding human DNA topoisomerase II and localization of the gene to chromosome region 17q21-22. Proc. Natl Acad. Sci. USA. 1988;85:7177–7181. doi: 10.1073/pnas.85.19.7177. [DOI] [PMC free article] [PubMed] [Google Scholar]
- 2.Jenkins J.R., Ayton P., Jones T., Davies S.L., Simmons D.L., Harris A.L., Sheer D., Hickson I.D. Isolation of cDNA clones encoding the beta isozyme of human DNA topoisomerase II and localisation of the gene to chromosome 3p24. Nucleic Acids Res. 1992;20:5587–5592. doi: 10.1093/nar/20.21.5587. [DOI] [PMC free article] [PubMed] [Google Scholar]
- 3.Fortune J.M., Osheroff N. Topoisomerase II as a target for anticancer drugs: when enzymes stop being nice. Prog. Nucleic Acid Res. Mol. Biol. 2000;64:221–253. doi: 10.1016/s0079-6603(00)64006-0. [DOI] [PubMed] [Google Scholar]
- 4.Sancar A., Lindsey-Boltz L.A., Unsal-Kacmaz K., Linn S. Molecular mechanisms of mammalian DNA repair and the DNA damage checkpoints. Annu. Rev. Biochem. 2004;73:39–85. doi: 10.1146/annurev.biochem.73.011303.073723. [DOI] [PubMed] [Google Scholar]
- 5.Barker C.R., Hamlett J., Pennington S.R., Burrows F., Lundgren K., Lough R., Watson A.J.M., Jenkins J.R. Int. J. cancer. 2006 doi: 10.1002/ijc.21717. In press. [DOI] [PubMed] [Google Scholar]
- 6.Young J.C., Moarefi I., Hartl F.U. Hsp90: a specialized but essential protein-folding tool. J. Cell Biol. 2001;154:267–273. doi: 10.1083/jcb.200104079. [DOI] [PMC free article] [PubMed] [Google Scholar]
- 7.Ferrarini M., Heltai S., Zocchi M.R., Rugarli C. Unusual expression and localisation of heat-shock protein in human tumour cells. Int. J. Cancer. 1992;51:613–619. doi: 10.1002/ijc.2910510418. [DOI] [PubMed] [Google Scholar]
- 8.Kamal A., Thao L., Sensintaffar J., Zhang L., Boehm M.F., Fritz L.C., Burrows F.J. A high-affinity conformation of Hsp90 confers tumour selectivity on Hsp90 inhibitors. Nature. 2003;425:407–410. doi: 10.1038/nature01913. [DOI] [PubMed] [Google Scholar]
- 9.Maloney A., Workman P. HSP90 as a new therapeutic target for cancer therapy: the story unfolds. Expert Opin. Biol. Ther. 2002;2:3–24. doi: 10.1517/14712598.2.1.3. [DOI] [PubMed] [Google Scholar]
- 10.Beliakoff J., Whitesell L. Hsp90: an emerging target for breast cancer therapy. Anticancer Drugs. 2004;15:651–662. doi: 10.1097/01.cad.0000136876.11928.be. [DOI] [PubMed] [Google Scholar]
- 11.Goetz M.P., Toft D.O., Ames M.M., Erlichman C. The Hsp90 chaperone complex as a novel target for cancer therapy. Ann. Oncol. 2003;14:1169–1176. doi: 10.1093/annonc/mdg316. [DOI] [PubMed] [Google Scholar]
- 12.Isaacs J.S., Xu W., Neckers L. Heat shock protein 90 as a molecular target for cancer therapeutics. Cancer Cell. 2003;3:213–217. doi: 10.1016/s1535-6108(03)00029-1. [DOI] [PubMed] [Google Scholar]
- 13.Kamal A., Boehm M.F., Burrows F.J. Therapeutic and diagnostic implications of Hsp90 activation. Trends Mol. Med. 2004;10:283–290. doi: 10.1016/j.molmed.2004.04.006. [DOI] [PMC free article] [PubMed] [Google Scholar]
- 14.Blagosklonny M.V., Fojo T., Bhalla K.N., Kim J.S., Trepel J.B., Figg W.D., Rivera Y., Neckers L.M. The Hsp90 inhibitor geldanamycin selectively sensitizes Bcr-Abl-expressing leukemia cells to cytotoxic chemotherapy. Leukemia. 2001;15:1537–1543. doi: 10.1038/sj.leu.2402257. [DOI] [PubMed] [Google Scholar]
- 15.Munster P.N., Basso A., Solit D., Norton L., Rosen N. Modulation of Hsp90 function by ansamycins sensitizes breast cancer cells to chemotherapy-induced apoptosis in an RB- and schedule-dependent manner. Clin. Cancer Res. 2001;7:2228–2236. [PubMed] [Google Scholar]
- 16.Skehan P., Storeng R., Scudiero D., Monks A., McMahon J., Vistica D., Warren J.T., Bokesch H., Kenney S., Boyd M.R. New colorimetric cytotoxicity assay for anticancer-drug screening. J. Natl Cancer Inst. 1990;82:1107–1112. doi: 10.1093/jnci/82.13.1107. [DOI] [PubMed] [Google Scholar]
- 17.Subramanian D., Furbee C.S., Muller M.T. ICE-bioassay isolating in vivo complexes of enzyme to DNA. In: Osheroff N., Bjornsti M.A., editors. Methods in Molecular Biology DNA Topoisomerase Protocols Part II Enzymology and Drugs. Humana Press; 2001. pp. 137–147. [DOI] [PubMed] [Google Scholar]
- 18.Tallarida R.J. The interaction index: a measure of drug synergism. Pain. 2002;98:163–168. doi: 10.1016/s0304-3959(02)00041-6. [DOI] [PubMed] [Google Scholar]
- 19.Arlander S.J., Eapen A.K., Vroman B.T., McDonald R.J., Toft D.O., Karnitz L.M. Hsp90 inhibition depletes Chk1 and sensitizes tumor cells to replication stress. J. Biol. Chem. 2003;278:52572–52577. doi: 10.1074/jbc.M309054200. [DOI] [PubMed] [Google Scholar]
- 20.Turner S.D., Wijnhoven S.W., Tinwell H., Lashford L.S., Rafferty J.A., Ashby J., Vrieling H., Fairbairn L.J. Assays to predict the genotoxicity of the chromosomal mutagen etoposide—focussing on the best assay. Mutat. Res. 2001;493:139–147. doi: 10.1016/s1383-5718(01)00170-x. [DOI] [PubMed] [Google Scholar]
- 21.Mabjeesh N.J., Post D.E., Willard M.T., Kaur B., Van Meir E.G., Simons J.W., Zhong H. Geldanamycin induces degradation of hypoxia-inducible factor 1alpha protein via the proteosome pathway in prostate cancer cells. Cancer Res. 2002;62:2478–2482. [PubMed] [Google Scholar]
- 22.Tikhomirov O., Carpenter G. Geldanamycin induces ErbB-2 degradation by proteolytic fragmentation. J. Biol. Chem. 2000;275:26625–26631. doi: 10.1074/jbc.M003114200. [DOI] [PubMed] [Google Scholar]
- 23.Flatten K., Dai N.T., Vroman B.T., Loegering D., Erlichman C., Karnitz L.M., Kaufmann S.H. The role of checkpoint kinase 1 in sensitivity to topoisomerase I poisons. J. Biol. Chem. 2005;280:14349–14355. doi: 10.1074/jbc.M411890200. [DOI] [PubMed] [Google Scholar]
- 24.Ho C.C., Siu W.Y., Chow J.P., Lau A., Arooz T., Tong H.Y., Ng I.O., Poon R.Y. The relative contribution of CHK1 and CHK2 to Adriamycin-induced checkpoint. Exp. Cell Res. 2005;304:1–15. doi: 10.1016/j.yexcr.2004.10.016. [DOI] [PubMed] [Google Scholar]
- 25.Maude S.L., Enders G.H. Cdk inhibition in human cells compromises chk1 function and activates a DNA damage response. Cancer Res. 2005;65:780–786. [PubMed] [Google Scholar]
- 26.Hu Y., Mivechi N.F. HSF-1 interacts with Ral-binding protein 1 in a stress-responsive, multiprotein complex with HSP90 in vivo. J. Biol. Chem. 2003;278:17299–17306. doi: 10.1074/jbc.M300788200. [DOI] [PubMed] [Google Scholar]


