Abstract
In animals, transcription factor binding sites are hard to recognize because of their extensive variation. We therefore characterized the general relationship between a specific protein-binding site and its DNA sequence and used this relationship to generate a predictive algorithm for searching other DNA sequences. The experimental process was defined by studying hepatocyte nuclear factor 1 (HNF1), which binds DNA as a dimer on two inverted-repeat 7-bp half sites separated by one base. The binding model was based on the equivalence of the two half sites, which was confirmed in examples where specific modified sites were compared. Binding competition analysis was used to determine the effects of substitution of all four bases at each position in the half site. From these data, a weighted half-site matrix was generated and the full site was evaluated as the sum of two half-site scores. This process accurately predicted even weak binding sites that were significantly different from the consensus sequence. The predictions also showed a direct correlation with measured protein binding.
INTRODUCTION
Despite extensive knowledge of DNA binding by transcription factors, determination of binding sites requires detailed experimentation, an approach that is incompatible with the extraordinary amount of new genomic sequencing. Computer prediction will be essential, but will require more exact prediction methods than those now in use. The current methods frequently predict sites that do not bind (1). Conversely, they also miss many important sites (2). Computer prediction is especially inaccurate for relatively weak binding sites. These weaker sites differ from the consensus and are hard to find; nevertheless, they can be important. The most dependable widely used computer prediction systems utilize weight matrices, two-dimensional tables compiled from alignments of sequences in a database (reviewed in 2,3). Such databases, however, are biased towards easily recognized strong binding sites. There are a few examples of alternate approaches where matrices have been derived from direct experimental data, e.g. functional assays of transcription (4) or DNA binding (5). Like this latter study, we started with measurement of DNA binding.
To develop a general predictive algorithm derived from a factor’s DNA-binding properties, we focused on a single well characterized factor, hepatocyte nuclear factor 1 (HNF1). Our analysis took advantage of two resources: the large number of HNF1 sites that have been experimentally defined (reviewed in 6), and a study by Cereghini et al. (7) that provided detailed competition analysis for a set of binding sites. HNF1 binds DNA as a homo- or heterodimer of two peptides, HNF1α and HNF1β (or vHNF1), and its binding sites are critical in liver gene regulation (8,9). The albumin promoter site at –60, for example, is essential for both direct promoter activity (7,10) and regulation by distant enhancers (11).
HNF1α and β are members of the homeobox family of transcription factors. Their divergent homeodomains are highly similar to each other (8) and bind to sites that are experimentally indistinguishable (7). The HNF1 DNA-binding domain also includes a region derived from the first two α-helical regions of a POU DNA-binding domain, on the N-terminal side of the homeodomain. In an intact POU domain, this region binds to the DNA backbone but without any base-specific contacts (12), suggesting that this extra HNF1 domain enlarges the region of DNA–protein interaction without affecting binding-site specificity. HNF1α and β also have a highly conserved dimerization domain at the N-terminal.
The current study was undertaken with three goals: to fully characterize the binding interactions of HNF1 as a resource for the study of liver gene expression; to define an algorithm that can rigorously predict HNF1 binding to DNA at any sequence, identify even weak new HNF1 sites and predict the strength of their binding interactions; and to work out a straightforward laboratory process that can generate similar algorithms for other DNA-binding factors starting from limited information about their binding sites.
MATERIALS AND METHODS
Plasmids and HNF1 purification
Plasmid 6HIS/HNF1DB (13) encodes the dimerization and DNA-binding domains of HNF1α (residues 1–281) fused to a six-histidine peptide in pET-14b (Novagen), with MW = 32 215 Da. Following transfection into Escherichia coli strain BL21DE3pLysS (Novagen), peptide was affinity-purified on Ni-NTA resin (Novagen) according to the supplier’s protocols. Protein was quantified using the Bradford method (Biorad) and purity was verified on SDS–acrylamide gels.
Oligonucleotide binding sites
All binding site oligonucleotides had the same design except for substitutions at numbered positions in the two 7-bp HNF1 half sites (underlined): top strand, 5′-tcgaTGTG1G2T3T4A5A6T7GA9T10T11A12A13C14C15GTT-3′. Unpurified complementary oligonucleotides, as provided by the supplier, were dissolved, annealed at 68°C for 15 min and allowed to cool slowly to room temperature. The complementary oligonucleotides were designed with seven asymmetric base pairs to minimize self-annealing. A few of the annealed mixtures were analyzed on 20% acrylamide/6 M urea gels, which showed a single duplex band that contained 80–90% of the detectable DNA, with very weak bands of unannealed full-length and shorter oligonucleotides. In one experiment, annealed oligonucleotides were purified from the gels and used in competition assays. These competitions were not significantly different from those that used unpurified oligonucleotide duplexes. Labeling of four-base 5′-protruding ends (lower case) by fill-in with Klenow DNA polymerase I and other details of gel-shift assays were carried out as previously described (14).
Gel-shift analyses
Protein-binding reactions were carried out in a 10 µl volume containing 25 mM HEPES, pH 7.9, 100 mM NaCl, 9 mM MgCl2, 0.25 mM EDTA and 18% glycerol. Reactions were incubated for 10 min at room temperature before loading the electrophoresis gel. Electrophoresis, in 6% acrylamide gels and 0.5× Tris-borate–EDTA running buffer, was also carried out at room temperature. Gels were dried and the signals quantified by densitometry of autoradiograms.
DNA competition analysis used 4 ng of HNF1 protein, a constant amount (2 ng) of labeled oligonucleotide duplex as the primary binding site and a variable ratio (0.25–800-fold) of an unlabeled competitor binding site. Data were fitted to sigmoidal curves and the ratio of competitor to labeled probe at 50% competition (C1/2) was determined by interpolation. The C1/2 determinations represent data accumulated from two to four experiments.
For analysis of protein binding and dissociation (15), 1 ng of labeled DNA was incubated with varying amounts of recombinant HNF1α protein. Binding fraction was plotted versus protein concentration and fitted to sigmoidal curves. To compensate for the presence of a non-binding oligonucleotide component, the binding and non-binding fractions were measured and binding was calculated as the ratio of binding to binding at saturation (16). For Scatchard analysis (17,18), values below 80% were used in double logarithmic plots, which were fitted to linear equations for slope determination.
Matrix compilation and weighting
Using Excel (Microsoft), a program was written to calculate a total matrix score for a specific binding site and normalize these values to the range of possible values (minimum 0, maximum 100%). The matrix scores were plotted in semilogarithmic plots versus 1/C1/2 and the fit was measured by linear regression analysis. For scanning DNA sequences, a computer program was written to calculate two matrix scores at a specified interval, combine them as a sum or product, normalize the scores to the maximum possible value, and report all sites detected above a specific cut-off. Methods for weighting specific values in the matrix are described below.
RESULTS
Preliminary analysis
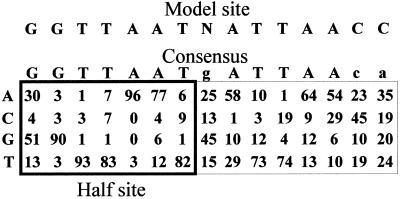
A database of 65 HNF1 binding sites was compiled and the sequences aligned according to an idealized HNF1 binding site, GGTTAAT N ATTAACC (19), hereafter referred to as the model site. Sites in the database showed a wide range of patterns. Half sites ranged from 7/7 to as few as 1/7 matches with the model; stronger half sites averaged 6.3, weaker half sites 4.5. Full sites combined similar or divergent half sites in all possible combinations. The average site matched 10.8 of the 14-base model site, but functional sites with as few as 7/14 matches have been characterized. To provide a more discriminating approach (2,3), the relative frequency of nucleotides at each position was tabulated in a simple matrix (Fig. 1).
Figure 1.
HNF1 site and half-site matrix. The matrix was compiled by aligning 65 binding sites to a model binding site with greatest similarity on the left, and tabulating the percent frequency of bases in each position. The consensus sequence shows the most frequent bases; those with a frequency of <50% are in lower case. The half-site matrix comprised the first seven columns of the full-site matrix and had a consensus identical to the model half site.
Scores were calculated from the matrix by adding the value for the base in each position. These scores were correlated with data obtained from a study of a HNF1 binding site competition published by Cereghini et al. (7). C1/2 values were calculated from their competition analysis of 12 binding sites. These comparisons (data not shown) showed a nearly linear relationship between 1/C1/2 and matrix score for the four strongest sites, but wide divergence for the weaker ones. Since the matrix was generated from a database, it appeared likely that the values could be modified to give a better correlation with measured binding. To simplify this problem, we modeled dimeric binding by using a half-site matrix to represent the monomer and combined two scores to represent the dimer. The seven columns on the left of the full count matrix were used as the initial half-site matrix. Use of the half-site matrix reduced the number of potential variations to be considered by four orders of magnitude, from 414 (2.7 × 10⁸) to 47 (1.6 × 10⁴). Two processes were compared. Scores from the two half sites (separated by one base and on opposite DNA strands) were added (the sum algorithm) or multiplied (the product algorithm) together. The product algorithm was directly analogous to the behavior of dimeric second-order binding and was more sensitive to the contributions of individual half sites than the sum algorithm. It was possible to alter a few numbers in the matrix by trial and error so that either algorithm gave a linear correlation with 1/C1/2. Adjustment was relatively easy for these 12 binding sites, because only a few bases differed from the model site, but the analysis demonstrated the feasibility of a more extended approach. This extension, however, required binding analysis from a comprehensive set of sites.
Measurement of binding affinity by competition analysis
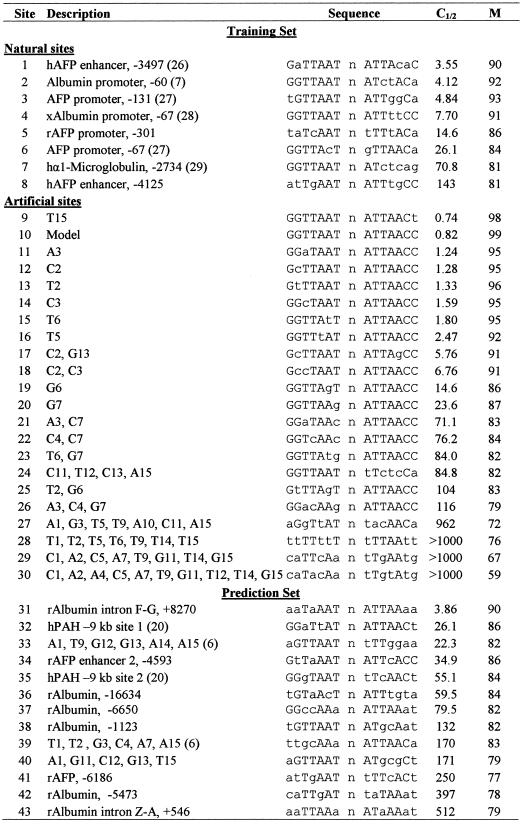
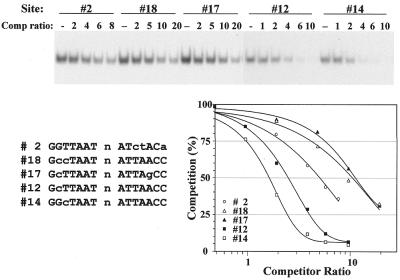
Binding competition analysis was carried out as described in Materials and Methods, using recombinant HNF1 protein, a labeled oligonucleotide and varying ratios of an unlabeled competitor. Initial studies utilized the model binding site (site 10) as the labeled probe, but this site was too strong to demonstrate competition by weaker binding sites. In contrast, the weaker site 2 demonstrated competition by both stronger and weaker sites over a range of three orders of magnitude and was used for subsequent comparisons of binding competition. For all oligonucleotides in the study, the measured values for C1/2 were determined as the ratio of competitor that gave 50% competition of site 2 (Table 1). A representative experiment (Fig. 2) characterized the effects of C substitutions in positions 2 and 3 and demonstrated that combining the two substitutions caused similar reduction of binding strength whether they were in the same or opposite half sites.
Table 1. HNF1 sites.
Within groups, sites are ranked by relative binding strength. Training set binding sites are listed in two categories: natural sites were from known regulatory modules of liver genes; artificial sites were designed for this study. The prediction set binding sites are further described in the text. h, designated human gene sites; r, rat; x, Xenopus. Sites not designated with one of these letters were conserved in multiple species. The dyad-repeat sequences of each site were listed, while the full structure of the oligonucleotides is described in Materials and Methods. Bases that deviated from the model half site are shown in lower case. C1/2 is the ratio of competing oligonucleotide that gave 50% competition of site 2. M, the matrix score, was calculated using the final weighted half-site matrix.
Figure 2.
Representative competition analysis showing the equivalent effects of a substitution in either half site. Analyses of five unlabeled binding-site oligonucleotides are illustrated, in competition with labeled site 2. The experiment examined single base changes to C in positions 2 (site 12) or 3 (site 14), and a combination of these changes in the same (site 18) or opposite (site 17) half sites. The plot shows the values from the single illustrated experiment, while the values in Table 1 were averaged from multiple experiments.
Matrix adjustment to reflect binding
Starting with the frequency matrix, the half-site matrix and the half-site matrix that was modified to fit the Cereghini et al. (7) binding data, DNA sequences were searched and test sites selected for competition analysis. These searches all demonstrated a large number of potential binding sites and it was evident that those with higher scores were likely to bind as predicted. Such analysis demonstrated two new binding sites in known regulatory regions (sites 5 and 8), but the discrimination of weaker sites appeared limited. A more systematic approach was carried out in several stages. Each stage improved the discrimination of both the sum and product algorithms. Overall, binding sites were selected from the list of known sites to provide a wide range of variations (sites 1–8), and other sites were designed (sites 9–31) so that all possible individual base changes and some specific combinations were included in the analysis (Table 1).
Two processes were used to convert the contributions of individual base changes to a value in the matrix. For single substitutions (sites 9 and 11–20), a set of C1/2 values for a series of oligonucleotides was plotted versus matrix score. This set included the model site 10, an oligonucleotide that contained a single base substitution, and several others without the substitution. The degree of correlation was evaluated by least-squares linear regression. The value for the substituted base was systematically varied and the value that gives a maximum R2 value was substituted into the matrix. The same approach was effective for the few sites in our series that compared two substitutions, e.g. sites 12, 14, 17 and 18 in Figure 2. The process could have been extended to all sites in the matrix, but had several limitations. First, it would have required 28 different competition comparisons to provide only a single measurement for the effects of each base. Secondly, it did not measure the effects of multiple base substitutions that might interact with each other. Thirdly, it could not utilize the vast majority of natural sites, because they contained multiple substitutions.
For a set of binding sites with multiple base changes, independent optimization of some bases improved the overall fit, while others reduced it. However, if an adjusted value was substituted into the matrix before the next modification, then the correlations were successively improved and the values eventually converged. This behavior suggests that the effects of single substitutions were dependent and could not be isolated from each other in the mathematical analysis. The procedure was standardized to the order left-top to right-bottom and repeated several times through the entire matrix until the values converged.
Binding site prediction
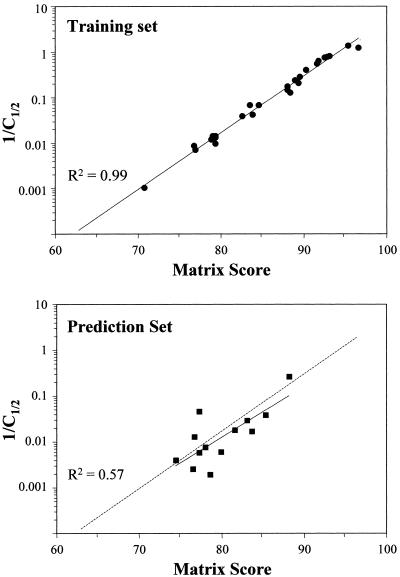
Once the adjustment system was worked out, additional oligonucleotides were designed and analyzed to complete a representative training set (sites 1–30). The training set matrix was adjusted so that the correlation with 1/C1/2 fitted a line with an R2 value of 0.99 (Fig. 3, top). Sites 28–30 were not included because they did not show measurable binding. This weighted matrix was then evaluated for detection of weak binding sites and prediction of the binding strength. Two extended DNA sequences were searched, a 70-kb sequence consisting of the rat albumin–α-fetoprotein (AFP) locus (J. Locker, unpublished results) and a comparable region of the human genome (GenBank accession no. AC008076). The searches indicated a large number of binding sites (see Discussion), of which eight were analyzed for binding. Seven of these sites (sites 35, 37–39, 41–43) were selected because their weak binding could discriminate predictions made with sum and product algorithms, while the eighth was an unusual high-scoring site containing only A:T base pairs (site 32). Four additional sites were studied: two recently described sites (sites 33 and 36) that critically regulate the PAH gene (20) and two sites (sites 34 and 38) reported as non-binding (6) but predicted to bind by our analysis. The sum (Fig. 3, bottom) but not the product algorithm (data not shown) scores showed a very strong correspondence with predictions based on the training set. Moreover, these predictions were accurate even for weak binding sites with as many as seven bases differing from the 14-base model site.
Figure 3.
Site matrices and competition analysis. Top, a weighted half-site matrix was derived from the competition values of 27 training set oligonucleotides using the sum algorithm, as described in Materials and Methods. Bottom, this training set-derived matrix was then used to generate scores for 13 oligonucleotides in the prediction set, which were plotted against measured competition values and displayed with a dotted line fitted to the training set values. C1/2 is the ratio of competitor to labeled site 2 oligonucleotide at 50% competition.
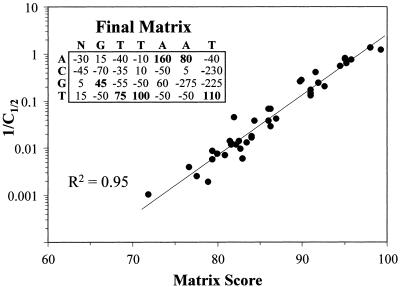
A final weighted half-site matrix was calculated from the entire set of competition data (Fig. 4), with R2 = 0.95 and the scores obtained with this matrix are listed in Table 1. In screening an extended sequence, the final matrix was approximately twice as selective as the training matrix at higher cut-off scores (Table 2), increasing discrimination above a selected cut-off and accuracy of binding site predictions. Nevertheless, the effect was relatively limited and tended to push selected scores up by only a few points. At the medium strength cut-off, the discrimination was between somewhat weaker or stronger binding, not between binding and non-binding. Inspection of the 50 rat Alb–AFP locus sites over this cut-off indicated that the vast majority resembled the model HNF1 site and would be expected to bind with close to the predicted strength. The training set was tested with more divergent sites which were mostly well below the medium strength cut-off. Since the final matrix was calculated from only 40 sites, analysis of more sites could further improve the correlations. However, this improvement might be limited, because several base substitutions under-represented in the training matrix were better represented in the final compilation, where each single-base substitution in the half site was represented by at least two different oligonucleotides (Table 3).
Figure 4.
Correlation using the final weighted half-site matrix. The training and prediction set competition values were combined and used to generate a more accurate half-site matrix. The matrix scores were compared with C1/2 as in Figure 3.
Table 2. Relative discrimination of the training and final matrix.
| Cut-off | Training matrix | Final matrix | ||||
|---|---|---|---|---|---|---|
| Score | Matches | Fraction (%) | Score | Matches | Fraction (%) | |
| Strong (site 2) | 89 | 8 | 0.012 | 92 | 2 | 0.0028 |
| Medium (site 6) | 83 | 100 | 0.14 | 84 | 50 | 0.072 |
| Weak (site 7) | 79 | 365 | 0.53 | 81 | 147 | 0.21 |
| Very weak (site 43) | 78 | 405 | 0.59 | 79 | 307 | 0.44 |
| Lowest positive value | 55 | 16999 | 24.6 | 57 | 15732 | 22.8 |
The 70-kb rat Alb–AFP locus was analyzed. The matrix scores were normalized over the full range of values. Lowest positive value was the minimum score at which the matrix yielded a positive value for binding. The greatest difference between the final matrix and training matrix was increased discrimination at the highest cut-off values, but discrimination was more similar for weaker sites.
Table 3. Base frequency in tested half sites.
| Position | 1 | 2 | 3 | 4 | 5 | 6 | 7 |
|---|---|---|---|---|---|---|---|
| A | 17 | 6 | 5 | 11 | 68 | 72 | 10 |
| C | 2 | 3 | 9 | 6 | 2 | 2 | 3 |
| G | 46 | 57 | 6 | 6 | 6 | 2 | 3 |
| T | 15 | 14 | 66 | 57 | 4 | 5 | 64 |
Consensus sequence bases are italicized. A total of 80 half sites in 40 oligonucleotides was used to calculate the final weighted half-site matrix.
The correlation with C1/2 values was very strong but obviously not perfect. Some of the small deviations presumably reflected the accuracy of the experimental measurements. Alternatively, the averaging process could not fully compensate for synergistic or complementary effects of multiple base substitutions. The final training set matrix (data not shown) was very similar to the training matrix—the main difference was that the training set matrix had more extreme values in the first column. The new matrix provided a considerable improvement in detection of HNF1 sites. In comparison, scores obtained with the simple frequency matrix or a similar matrix downloaded from TRANSFAC (http://transfac.gbf.de) showed only moderate correlation with the full set of competition values (R2 = 0.59–0.60) and little correlation with the prediction set (R2 = 0.19).
Relationship to protein binding affinity
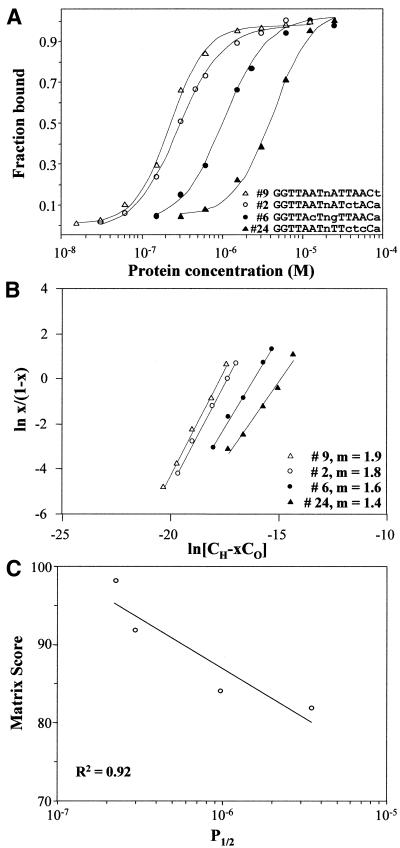
Further studies evaluated the relationship between matrix scores and HNF1 DNA-binding properties. The competition analysis provided C1/2 values that were related to the dissociation constant, KD, but these were based on simplified experimental conditions and empirical comparison with a single binding site. For this further analysis, four binding sites (sites 2, 6, 9 and 24) were chosen with C1/2 values ranging over more than two orders of magnitude, from 0.74 to 84.8, and gel-shift assays were carried out with a range of protein concentrations (Fig. 5A). P1/2, the molar concentration of HNF1α at 50% binding, ranged from 2.3 × 10⁻⁷ to 3.5 × 10⁻⁶. For the two stronger sites (sites 9 and 2), Scatchard binding analysis demonstrated a slope of close to 2 (Fig. 5B) indicating second-order binding as a dimer (n = 2). For these sites, KD was calculated from the relationship KD = (P1/2)n, as 5.1 × 10⁻¹⁴ and 8.9 × 10⁻¹⁴, respectively (15). The other two sites (sites 6 and 24) had slopes significantly <2, suggesting that their binding was intermediate between first and second order. In both cases, one half site was much weaker than the other. In site 6, the G in position 9 greatly weakened that half site, while site 24 had four substitutions in one half site and none in the other. The values suggested that monomer binding on the stronger half site was a significant fraction of the total binding at these weakened asymmetric sites. If binding at all four sites was considered second order, the calculated KD values ranged from 5.1 × 10⁻¹⁴ to 1.2 × 10⁻¹¹, almost three orders of magnitude. As an alternative reflecting composite second- and first-order binding, the measured slopes (1.9–1.4) from the Scatchard plots were used as values for n and gave a five order of magnitude range for KD, from 2.3 × 10⁻¹³ to 2.3 × 10⁻⁸. Because of this ambiguity, the relationship of the matrix score to binding was compared in several ways. The relationship between P1/2 (or KD = P1/22) and matrix score was nearly linear (Fig. 5C), with an R2 of 0.92 when fitted to a simple linear equation. Moreover, a plot of matrix score versus alternative KD values calculated using the Scatchard slopes also gave a linear correlation with the same R2 value of 0.92. In each of these cases, the modified half-site matrix was directly related to the chemical parameters of protein binding.
Figure 5.
Protein binding relationships. (A) Protein binding curves. The relationship between protein concentration and binding was demonstrated for four binding sites. The illustrated data are from a single experiment. P1/2, the molar concentration of HNF1 at 50% binding, was calculated by interpolation. Recombinant HNF1α MW = 32 215. Values were the average of two determinations. (B) Scatchard plots. Binding values of <80% were plotted in semilogarithmic plots. x, the binding fraction; CH, the molar concentration of HNF1; CO, the molar concentration of binding-site oligonucleotide; m, the measured slope. (C) Relationship between measured dissociation constant (KD) and binding competition (C1/2). P1/2 was plotted against scores obtained with the final weighted half-site matrix (Fig. 4). The line was a simple linear regression of the values.
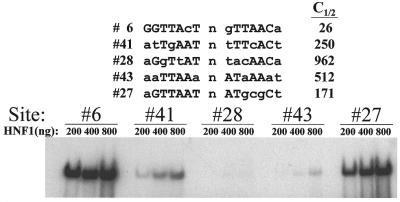
Since binding competition was demonstrated over a larger range than direct protein binding, the ability of weak sites to bind HNF1 was further characterized in a gel-shift assay at room temperature (Fig. 6). Binding of a very weak site (site 43, C1/2 = 512) was easily detected using experimental conditions of medium sensitivity. The biological significance of such weak binding is unclear, but it can be detected, quantified and predicted with the systems described here.
Figure 6.
The limit of detectable protein binding. Five oligonucleotides, representing the intermediate to low range of C1/2, were labeled and bound to increasing amounts of protein. The dried gel was exposed for 24 h at room temperature to XAR-5 film using a Lightning Plus intensifying screen (Dupont).
DISCUSSION
Experimental characterization of binding sites
Our studies were intended to establish a routine laboratory procedure that could experimentally determine the entire range of binding by a factor and describe this binding by a computer algorithm that could reliably search other sequences. The competition assays were carried out using expedient experimental conditions that enabled us to efficiently analyze a large number of sites. Unpurified commercial oligonucleotides were annealed and directly labeled or used as competitors, usually without further characterization. The gel-shift and competition conditions were experimentally optimized to provide uniform easily measured binding, short film exposures and consistent competition curves (Fig. 2). As our algorithms developed, the Cereghini et al. (7) data were displaced and fell on a parallel line, presumably because of differences in the way their competitions were carried out. Thus, the model also fit their data, but the most essential experimental parameter was to make the measurements internally consistent.
A selected group of sites were analyzed under more rigorous conditions (Fig. 5) to determine P1/2 and KD. As expected, these values showed a simple linear relationship to C1/2 (data not shown). It is recognized that gel-shift analysis, though frequently used, is not the most accurate way to determine binding constants (16), but the purpose of our analyses was to determine how the matrix predictions correlated with true binding, which did not require the most precise determination of KD. Even so, the measured KD of 5.1 × 10⁻¹⁴ was consistent with other transcription factors. For example, the dimeric HLH factor MASH-1 had a KD of 1.4 × 10⁻¹⁴ (15), while a monomeric homeodomain factor, Dlx3 had a KD of 7.8 × 10⁻⁸ (18).
In principle, the analysis can start from a single binding oligonucleotide, which can be randomly substituted to generate a preliminary set of competitors. The preliminary assessment can then be followed by more systematic variation of bases. This process differs significantly from generation of consensus sequences or matrices using verified natural sites, because these are biased towards strong, easily recognized sites. Similarly, the widely used ‘selected and amplified binding’ (SAAB) procedure (21), in which transcription factor-bound DNA segments are amplified by PCR, is also biased toward the most strongly bound sites. For our approach, it is useful, but not essential, to start with a model of the binding site, which can facilitate the subsequent analysis. Analysis of HNF1 was simplified by the features already established for this factor, dimeric binding at two seven-base half sites on opposite DNA strands, with a fixed separation of one base. The use of recombinant protein also facilitated analysis and enabled direct correlation with KD. Except for calculation of specific parameters like KD, however, the same analysis can be carried out on factors present in crude cell extracts. Comparison of highly purified to unpurified oligonucleotides showed little difference. Moreover, although we averaged multiple determinations of C1/2, the minor variation from one determination to another also did not significantly affect the overall weighting of the matrix. It there fore does not appear necessary to carry out the competitions with the highest precision.
There were two other features that facilitated our experimental approach. First was the use of a half-site matrix. For HNF1, the equivalent additive contribution of half sites was experimentally verified. It is possible, however, that another class of dimeric factor might bind differently. For example, initial binding of a monomer at a strong site might recruit a second monomer to dimerize and bind a weak site in a manner that would make the two sites non-equivalent. As a further advantage, the binding of heterodimeric factors can be described by combining two different half-site matrices. Like most dimeric transcription factors, HNF1 monomers bind only at a fixed distance, though a few factors, like CTF/NF1, bind as dimers with variable spacing between half sites. For such complex binding, Roulet et al. (5) have described an algorithm that includes two half-site matrices and an additional factor that compensates for the effect of half-site spacing.
A second feature of our analysis was simultaneous variation of multiple bases in a single oligonucleotide competitor, which allowed comparison of a larger number of base variations per oligonucleotide. This process presumed the approximate independence of each position in determining the score matrix. However, independence was not observed for another DNA-binding protein, the bacteriophage repressor Mnt, where substitution at one of two positions significantly modified the binding of the other base (22). Such interactions probably also affected our analysis, suggested by the inability to perfectly linearize the correlation. The small magnitude of the effect may reflect specific properties of the HNF1 DNA-binding domain. Alternatively, the contributions non-equivalent base combinations had only a fractional effect on the entire matrix score. We did not test all combinations of two or more base substitutions and cannot rule out a larger effect for untested combinations.
For searching DNA sequences, we wrote a computer program to use two (half-site) matrices in a single search. As an alternative for use in other DNA analysis programs, the weighted half-site matrix was combined with the corresponding reverse-complement matrix into a single matrix that gave identical searches and scores. To make it compatible with programs that do not allow negative numbers, the matrix was also translated into a positive numbers by adding 230 to each position. This translated matrix also gave identical searches, but with different cut-off scores.
A model of the HNF1 DNA-binding domain
The weighted half-site matrix is a profile of the specific binding interactions. By convention, the binding site was written as a single-strand sequence, but the actual protein DNA contacts were presumably on both strands. For HNF1, the strongest interactions were through an A:T base pair in position 5 and a T:A base pair in position 7. Though the latter was designated as a T, the main interaction was with A on the opposite strand, because bacterial methylation of this A in one half site greatly reduced binding (11,23). The strongest disruptions occurred through introduction of a G:C base pair in position 6 and G:C or C:G base pairs in position 7. Thus, like other homeodomain binding sites (24), there was a significant bias toward A:T base pairs. Rather strong, but previously cryptic, HNF1 sites could be entirely composed of A:T base pairs (e.g. site 32).
In addition to detecting cryptic sites, the weighted half-site matrix can also be used for rational mutagenesis. For example, the introduction of G:C and G:C into positions 6 and 7 of one half site will effectively inactivate a binding site, even while matching the model site at 12 of 14 base pairs. Conversely, sites that differ at seven of 14 base pairs may still have significant binding (e.g. site 36).
Biological relationships
The cut-off point for biologically significant binding was unclear. The weakest functionally characterized site we found was in the human α1-microglobulin gene enhancer (site 7), which had a matrix score of 81 and was approximately two orders of magnitude weaker than the strongest binding sites. However, binding was easily demonstrated to much weaker sites, and it would be possible to demonstrate still weaker binding with modified experimental conditions: higher protein concentrations, longer film exposures, binding and electrophoresis at lower temperatures, and competition using binding sites weaker than site 2.
We carried out searches of extended DNA sequences and detected very large numbers of sites. Extrapolation of these detections to the entire genome was limited by G+C content and other special local sequence properties, as well as the fact that the matrix was compiled from only 40 binding sites. Even so, the vast majority of sites above the medium-strength cut-off would be likely to show significant binding and the extrapolated number of such sites in the genome was several orders of magnitude greater than the number of HNF1 molecules in the cell. Thus, despite the limited accuracy of the extrapolation, the range of the predictions had important implications for the mechanism of transcriptional regulation by HNF1, and for the interpretation of binding sites detected by any algorithm.
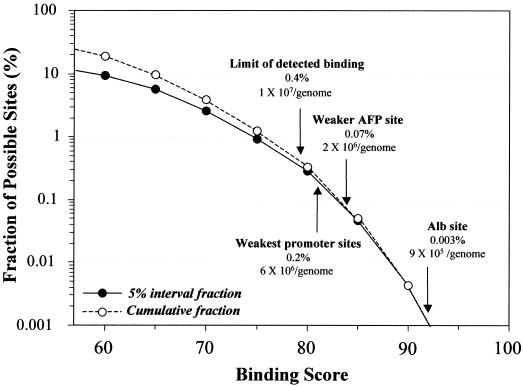
Analysis of a 70 000 bp (35% G+C) region containing the rat Alb–AFP locus provided typical results (Fig. 7). A search with the cut-off at a matrix score of 92, the maximum that detected the strong albumin promoter site, detected two sites (0.03%, which extrapolated to 1 × 10⁵ per genome). Detection of the weaker functional AFP promoter site required a cut-off of 84, and detected 50 sites. Nevertheless, the matrix algorithm can be considered highly selective. Binding predicted at the limit detected by gel-shift assay (matrix score = 79) corresponded to only 0.44% of all DNA sequences, i.e. 1 × 10⁷ sites per haploid genome. In contrast to this large number of potential sites, Lichtsteiner and Schibler (25) calculated only 1–2 × 10⁴ HNF1 molecules per cell. Clearly, simple scanning of DNA sequences cannot discriminate even strong sites that actually regulate genes. Sites that function in vivo must be distinguished by context, that is, their direct relationship to other regulatory elements. This makes it difficult to establish a lower limit for functional binding sites. In the right context, even a very weak site might function in a regulatory module if adjacent factors stabilized HNF1 binding.
Figure 7.
Estimation of genomic binding sites. The weighted half-site matrix was used to detect potential HNF1 binding sites in a 70 000 bp sequence from the rat Alb–AFP locus. The results are presented as the number of sites in 5% matrix score intervals (interval fraction) and the total number of sites detected in the same intervals (cumulative fraction). The plot was cut off at 57%, the score for the lowest possible positive matrix score. Representative values were extrapolated to a genome of 3 × 10⁹ bp.
Overall, our approach has greatest utility for characterizing known regulatory regions and their interactions with a single transcription factor. Identifying a new regulatory region is a more difficult problem because demonstration of a site for a single factor, no matter how accurate the binding prediction, is simply not enough to predict that a region is functional. Even so, the solution to such higher-order prediction may not be far away. The required level of prediction might be accomplished by combining accurate analysis of only a few kinds of sites, along with experimentally determined ‘grammatical’ rules for their association.
Acknowledgments
ACKNOWLEDGEMENTS
We are grateful to Drs Eric Bouhassira, John Greally and Abdissa Negassa (Albert Einstein College of Medicine) for helpful discussions, and to Dr Marco Pontoglio (Pasteur Institute) for providing the recombinant HNF1 expression plasmid. National Health Institute Grants CA68440 and CA76354 supported this work.
REFERENCES
- 1.Fickett J.W. (1996) Quantitative discrimination of MEF2 sites. Mol. Cell. Biol., 16, 437–441. [DOI] [PMC free article] [PubMed] [Google Scholar]
- 2.Roulet E., Fisch,I., Junier,T., Bucher,P. and Mermod,N. (1998) Evaluation of computer tools for the prediction of transcription factor binding sites on genomic DNA. In Silico Biol., 1, 21–28. [PubMed] [Google Scholar]
- 3.Bucher P. (1999) Regulatory elements and expression profiles. Curr. Opin. Struct. Biol., 9, 400–407. [DOI] [PubMed] [Google Scholar]
- 4.Kraus R.J., Murray,E.E., Wiley,S.R., Zink,N.M., Loritz,K., Gelembiuk,G.W. and Mertz,J.E. (1996) Experimentally determined weight matrix definitions of the initiator and TBP binding site elements of promoters. Nucleic Acids Res., 24, 1531–1539. [DOI] [PMC free article] [PubMed] [Google Scholar]
- 5.Roulet E., Bucher,P., Schneider,R., Wingender,E., Dusserre,Y., Werner,T. and Mermod,N. (2000) Experimental analysis and computer prediction of CTF/NFI transcription factor DNA binding sites. J. Mol. Biol., 297, 833–848. [DOI] [PubMed] [Google Scholar]
- 6.Tronche F., Ringeisen,F., Blumenfeld,M., Yaniv,M. and Pontoglio,M. (1997) Analysis of the distribution of binding sites for a tissue-specific transcription factor in the vertebrate genome. J. Mol. Biol., 266, 231–245. [DOI] [PubMed] [Google Scholar]
- 7.Cereghini S., Blumenfeld,M. and Yaniv,M. (1988) A liver-specific factor essential for albumin transcription differs between differentiated and dedifferentiated rat hepatoma cells. Genes Dev., 2, 957–974. [DOI] [PubMed] [Google Scholar]
- 8.Rey-Campos J., Chouard,T., Yaniv,M. and Cereghini,S. (1991) vHNF1 is a homeoprotein that activates transcription and forms heterodimers with HNF1. EMBO J., 10, 1445–1457. [DOI] [PMC free article] [PubMed] [Google Scholar]
- 9.Mendel D.B., Hansen,L.P., Graves,M.K., Conley,P.B. and Crabtree,G.R. (1991) HNF-1α and HNF-1β (v HNF-1) share dimerization and homeo domains, but not activation domains and form heterodimers in vitro. Genes Dev., 5, 1042–1056. [DOI] [PubMed] [Google Scholar]
- 10.Tronche F., Rollier,A., Herbomel,P., Bach,I., Cereghini,S., Weiss,M. and Yaniv,M. (1990) Anatomy of the rat albumin promoter. Mol. Biol. Med., 7, 173–185. [PubMed] [Google Scholar]
- 11.Vorachek W.R., Steppan,C.M., Lima,M., Black,H., Bhattacharya,R., Wen,P., Kajiyama,Y. and Locker,J. (2000) Distant enhancers stimulate the albumin promoter through complex proximal binding sites. J. Biol. Chem., 275, 29031–29041. [DOI] [PubMed] [Google Scholar]
- 12.Ghosh D. and Locker,J. (1996) Transcription factor families and DNA-binding domains. In Locker,J. (ed.), Transcription Factors—Essential Data. Wiley, Chichester, pp. 82–104.
- 13.Fourel G., Ringeisen,F., Flajolet,M., Tronche,F., Pontoglio,M., Tiollais,P. and Buendia,M.A. (1996) The HNF1/HNF4-dependent We2 element of woodchuck hepatitis virus controls viral replication and can activate the N-myc2 promoter. J. Virol., 70, 8571–8583. [DOI] [PMC free article] [PubMed] [Google Scholar]
- 14.Wen P. and Locker,J. (1994) A novel hepatocytic transcription factor that binds the α-fetoprotein promoter-linked coupling element. Mol. Cell. Biol., 14, 6616–6626. [DOI] [PMC free article] [PubMed] [Google Scholar]
- 15.Meierhans D., el-Ariss,C., Neuenschwander,M., Sieber,M., Stackhouse,J.F. and Allemann,R.K. (1995) DNA binding specificity of the basic-helix–loop–helix protein MASH-1. Biochemistry, 34, 11026–11036. [DOI] [PubMed] [Google Scholar]
- 16.Carey J. (1991) Gel retardation. Methods Enzymol., 208, 103–117. [DOI] [PubMed] [Google Scholar]
- 17.Chadwick P., Pirrotta,V., Steinberg,R., Hopkins,N. and Ptashne,M. (1970) The λ and 434 phage repressors. Cold Spring Harbor Symp., 35, 283–294. [Google Scholar]
- 18.Feledy J.A., Morasso,M.I., Jang,S.I. and Sargent,T.D. (1999) Transcriptional activation by the homeodomain protein distal-less 3. Nucleic Acids Res., 27, 764–770. [DOI] [PMC free article] [PubMed] [Google Scholar]
- 19.Tronche F. and Yaniv,M. (1992) HNF1, a homeoprotein member of the hepatic transcription regulatory network. Bioessays, 14, 579–587. [DOI] [PubMed] [Google Scholar]
- 20.Lei X.D. and Kaufman,S. (1998) Identification of hepatic nuclear factor 1 binding sites in the 5′ flanking region of the human phenylalanine hydroxylase gene: implication of a dual function of phenylalanine hydroxylase stimulator in the phenylalanine hydroxylation system. Proc. Natl Acad. Sci. USA, 95, 1500–1504. [DOI] [PMC free article] [PubMed] [Google Scholar]
- 21.Blackwell T.K. and Weintraub,H. (1990) Differences and similarities in DNA-binding preferences of MyoD and E2A protein complexes revealed by binding site selection. Science, 250, 1104–1110. [DOI] [PubMed] [Google Scholar]
- 22.Man T.K. and Stormo,G.D. (2001) Non-independence of Mnt repressor–operator interaction determined by a new quantitative multiple fluorescence relative affinity (QuMFRA) assay. Nucleic Acids Res., 29, 2471–2478. [DOI] [PMC free article] [PubMed] [Google Scholar]
- 23.Tronche F., Rollier,A., Bach,I., Weiss,M.C. and Yaniv,M. (1989) The rat albumin promoter: cooperation with upstream elements is required when binding of APF/HNF1 to the proximal element is partially impaired by mutation or bacterial methylation. Mol. Cell. Biol., 9, 4759–4766. [DOI] [PMC free article] [PubMed] [Google Scholar]
- 24.Pabo C.O. and Sauer,R.T. (1992) Transcription factors: structural families and principles of DNA recognition. Annu. Rev. Biochem., 61, 1053–1095. [DOI] [PubMed] [Google Scholar]
- 25.Lichtsteiner S. and Schibler,U. (1989) A glycosylated liver-specific transcription factor stimulates transcription of the albumin gene. Cell, 57, 1179–1187. [DOI] [PubMed] [Google Scholar]
- 26.Sawadaishi K., Morinaga,T. and Tamaoki,T. (1988) Interaction of a hepatoma-specific nuclear factor with transcription-regulatory sequences of the human alpha-fetoprotein and albumin genes. Mol. Cell. Biol., 8, 5179–5187. [DOI] [PMC free article] [PubMed] [Google Scholar]
- 27.Feuerman M.H., Godbout,R., Ingram,R.S. and Tilghman,S.M. (1989) Tissue-specific transcription of the mouse α-fetoprotein gene promoter is dependent on HNF-1. Mol. Cell. Biol., 9, 4204–4212. [DOI] [PMC free article] [PubMed] [Google Scholar]
- 28.Schorpp M., Kugler,W., Wagner,U. and Ryffel,G.U. (1988) Hepatocyte-specific promoter element HP1 of the Xenopus albumin gene interacts with transcriptional factors of mammalian hepatocytes. J. Mol. Biol., 202, 307–320. [DOI] [PubMed] [Google Scholar]
- 29.Rouet P., Raguenez,G., Tronche,F., Yaniv,M., N’Guyen,C. and Salier,J.P. (1992) A potent enhancer made of clustered liver-specific elements in the transcription control sequences of human α1-microglobulin/bikunin gene. J. Biol. Chem., 267, 20765–20773. [PubMed] [Google Scholar]


