Abstract
Valuable information on protein–membrane organization may in principle be obtained from polarized-light absorption (linear dichroism, LD) measurement on shear-aligned lipid vesicle bilayers as model membranes. However, attempts to probe LD in the UV wavelength region (<250 nm) have so far failed because of strong polarized light scattering from the vesicles. Using sucrose to match the refractive index and suppress the light scattering of phosphatidylcholine vesicles, we have been able to detect LD bands also in the peptide-absorbing region (200–230 nm). The potential of refractive index matching in vesicle LD as a general method for studying membrane protein structure was investigated for the membrane pore-forming oligopeptide gramicidin incorporated into the liposome membranes. In the presence of sucrose, the LD signals arising from oriented tryptophan side chains as well as from n→π* and π→π* transitions of the amide chromophore of the polypeptide backbone could be studied. The observation of a strongly negative LD for the first exciton transition (≈204 nm) is consistent with a membrane-spanning orientation of two intertwined parallel gramicidin helices, as predicted by coupled-oscillator theory.
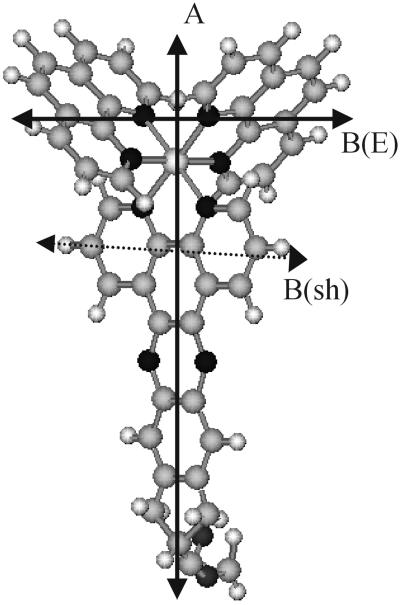
Structural properties of biologically active molecules in membranes are difficult to assess under solution conditions. Most of the traditional experimental methods, such as ESR, NMR, and diffraction techniques, require specific labeling, contrast, crystallization, or very high concentrations, conditions that can be difficult to obtain or that may seriously alter the natural environment of the molecules in question. We recently proposed a method based on polarized-light absorption (linear dichroism, LD) for studying the orientational behavior of molecules in a liposomal membrane. The only prerequisite is that the molecule absorbs in the visible-to-UV region of the spectrum (1). The membrane environment used is that of a lipid vesicle, with the possibility to vary lipid content, buffer conditions, and other membrane components. The liposomes are shear-deformed into ellipsoids in a laminar shear flow, and the molecular orientation can be assessed from LD, the differential absorption between light polarized parallel and perpendicular to the flow direction (LD = Apar − Aperp). LD reports on the orientation of the electronic transition moments: for example, a transition oriented parallel to the lipid chains will give a negative LD signal, whereas a transition oriented parallel to the lipid-bilayer surface will give positive LD. To further explore the method, a series of ruthenium complexes has been used (2), their advantage being on one hand, a stereochemically well-defined scaffold with tunable membrane interaction properties, and on the other, being chromophores that display well-characterized transitions spanning all three dimensions (Fig. 1).
Fig 1.
Structure of the membrane probe Ru(phen)2dppzcpCOOCH3 with the transition moment directions along which the resolved spectral components are polarized (22). Transition moment A coincides with the long-axis of the dppz moiety, B(sh) is directed along the short-axis of the dppz ligand, B(E) is directed between the centers of the two phenanthrolines, and B(A2) is at an angle of ≈80° to B(E) and perpendicular to the plane in the picture. All B transitions are polarized perpendicular to transition A.
So far, however, one shortcoming of the method has been the substantial light scattering that the liposomes give rise to, the scattering being strongly polarized and therefore disturbing the LD spectrum. This light scattering, mainly arising from the difference in refractive index between the lipid bilayer of the liposomes and the surrounding buffer solution, is difficult to model quantitatively, its origin being the differential scattering of partially aligned ellipsoidal shells in directions parallel and perpendicular to the flow. By shortening the optical path length, the scattering can be reduced so as to allow observation of membrane protein chromophores in the near-UV region (3), but its presence still makes the spectral interpretation difficult.
The principle of using refractive index matching to reduce scattering of biological objects is not new (4). It is widely used to suppress unwanted neutron scattering in small-angle neutron scattering techniques for studying macromolecular systems. More specifically, sucrose has been used as contrast-enhancer in small angle x-ray scattering (5). Sucrose is used for cryoprotection of cell and liposomal solutions and cell-modeling purposes (different forms of saccharides being naturally present at or in the cell membranes), and it is known from calorimetry and x-ray diffraction that sucrose does not significantly alter lipid bilayer packing or phase transition temperature, except at extreme dehydration (6).
Gramicidin has, since the discovery of this antibiotic oligopeptide in 1939 (7), evolved to become an archetype model of a membrane channel. It has a characteristic sequence of alternating d- and l-amino acids and can form two main types of membrane channel or pore structures. Both types consist of two 15-residue peptides, either forming a N-terminal-to-N-terminal helical dimer (HD) of β-helices, with a lower helical rise than the common α-helix, or forming an intertwined double helix (DH) with parallel peptide β-helix chains. Both structures provide a transmembrane pore with a diameter large enough to transport ions (8). The two types can interchange in a bilayer environment, and the equilibrium seems to sensitively depend on bilayer thickness, lipid content, and sample preparation (9).
Methods
Soybean l-α-phosphatidylcholine (type II-S, approximate composition: phosphatidylcholine, 24%; phosphatidylethanolamine, 20%; inositol phosphatides, 14%; the remainder being other phospholipids, lipids, and carbohydrates), gramicidin D, and sucrose (SigmaUltra) were purchased from Sigma and used without further purification. Gramicidin D contains gramicidin A, B, and C at the approximate ratio 80:5:15 (HCO-l-Val-Gly-l-Ala-d-Leu-l-Ala-d-Val-l-Val-d-Val-l-Trp-d-Leu-l-Trp-d-Leu-l-Trp-d-Leu-l-Trp-NHC2H4OH, where gramicidin B and C differ by a Phe or a Tyr in residue 11). The chloride salt of Ru(phen)2dppzcpCOOCH3 (phen = 1,10-phenanthroline, dppzcpCOOCH3 = 12-cyano-12,13-dihydro-11H-cyclopenta-dipyrido[b:3,2-h:2′,3′-j]phenazine-12-carboxylic acid methyl ester; Fig. 1) was synthesized by standard methods (10, 11). Liposomes for LD measurements were prepared by dissolving lipids in buffer (5 mM phosphate buffer, pH 7) containing different amounts of sucrose (10%, 30%, and 50% wt/wt). The optical rotation of a 50% (wt/wt) sucrose solution is <3° (1-mm optical path length) within the wavelength interval used, and thus does not affect the LD by more than fractions of a percent. The solution was subjected to 30 min of forceful shaking, frozen (liquid N2) and thawed (40°C) five times, and extruded 11 times by using a syringe extruder (LiposoFast Basic, Avestin, Ottawa) through a polycarbonate filter with 100-nm pores. The ruthenium complex was included at a later stage (≈1:100 complex-to-lipid ratio) by adding a small amount of concentrated solution to the liposomes. Gramicidin-containing liposomes were prepared by dissolving gramicidin and lipids in CH2Cl2 in molar ratios 1:50. The solvent was evaporated in a rotatory evaporator and the lipid film was subjected to vacuum for a few hours to remove remaining solvent. Buffer or buffer containing 50% sucrose was then added to the flask, and the film was suspended by vortex treatment. The liposomes were then prepared according to the protocol outlined above.
LD was measured on a Jasco (Tokyo) 720 instrument equipped with an Oxley prism (B. Halle Nachfl., Berlin) (12, 13), using a Couette cell to orient the sample in a shear flow of 3,100 s−1 (14). The probing light beam enters the Couette cell radially; the horizontally polarized light is thus parallel to the flow direction, and the vertically polarized light is perpendicular to the flow. A positive LD signal signifies that the transition moment is oriented parallel to the membrane surface, whereas a negative LD signal indicates an orientation parallel to the lipid chains, normal to the membrane. In general, the reduced LD, LD/Aiso, equals S⋅3(1 − 3〈cos2α〉)/4, where α is the angle between the membrane normal and the transition moment direction, 〈cos2α〉 denotes an ensemble average, and the effective membrane orientation factor S gauges the degree of deformation and the relative alignment of the liposomes in the flow (2). With this definition, S is 1 for the hypothetical case of liposomes deformed to infinitely long cylinders oriented perfectly parallel to the flow, and 0 for spherical or unoriented liposomes.
Theoretical LD predictions for the peptide π→π* transitions were made by using the matrix formulation of the coupled oscillator model (15), where the interacting transitions were modeled to have a transition moment directed either between the midpoint of the carbonyl bond and the nitrogen atom in each amide moiety (16) or between the nitrogen and the carbonyl oxygen (17). Although the different directions resulted in predicted spectra that varied somewhat in shape, the signs of the bands were not changed. For the space coordinates of the peptide group atoms, the α-helix coordinates were generated in the hyperchem molecular modeling software, whereas the structures for the N-to-N HD (18) and the parallel intertwined DH (19) were retrieved from database sources.
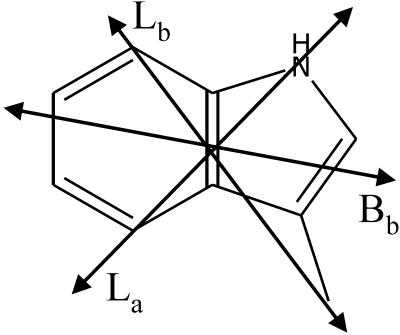
The n→π* transitions of the peptide groups were represented as vectors pointing out of the plane formed by the carbon, oxygen, and nitrogen. The total sum of the squares of the (x, y, z) components of the transition moments were used to calculate the LD. Correspondingly, the transitions of the tryptophan chromophores were modeled as vectors between the nitrogen and the 4-carbon of the phenyl ring (La), between the linking carbon and the 7-carbon of the phenyl ring (Lb) and slightly tilted from the long axis of the indole moiety (Bb) (Fig. 2) (20, 21), and the LD was calculated as for the n→π* transitions.
Fig 2.
Approximate transition moment directions of the tryptophan residues used to calculate the expected LD of a gramicidin DH (β DH). The Bb transition is the strongest and occurs close to 220 nm. The Lb transition occurs at slightly longer wavelengths (≈290 nm) than the La transition (≈280 nm) (20, 21).
Results and Discussion
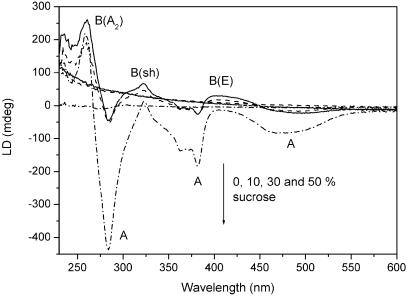
Fig. 1 shows the structure of the membrane probe Ru(phen)2dppzcpCOOCH3, with the main transition moment directions indicated: A, which is polarized parallel with the long axis of the dppzcp ligand, and three B transitions polarized in the plane perpendicular to A [B(sh), B(E), and B(A2)] (2, 22, 23). Fig. 3 shows the flow LD spectra of pure liposomes in buffer containing different amounts of sucrose, as well as the LD spectra of the same liposomes, with a small amount (≈1:100) of Ru(phen)2dppzcpCOOCH3 added. The presence of LD shows unambiguously that the metal complex is incorporated in and oriented by the liposome membrane, and the sign pattern of the spectrum indicates that it is inserted with its dppz tail (the A transition moment in Fig. 1) parallel with the lipid chains (negative LD peaks), whereas all three B transitions are oriented mainly parallel to the lipid surface (positive LD). The substantial light scattering from the liposomes when prepared in pure buffer, visible as a strongly sloping positive turbidity background in LD, is reduced in the 10% and 30% sucrose buffer, to practically vanish in the 50% sucrose buffer. This can be considered a refractive index matching effect, aqueous solution with 50% sucrose having a refractive index of 1.42 at 589 nm and 20°C, comparable to the refractive index estimated for the lipid bilayer (1.42–1.45). At the same time as the turbidity LD baseline is reduced, the true absorption LD spectrum from the probe chromophore becomes stronger with more distinct features. The sucrose will increase the viscous drag in the solution, thereby increasing the deformation of the liposomes and giving them a higher orientational order. The eliminated scattering is also seen in the absorption spectrum, where the characteristic turbidity tail practically disappears when going from nonsucrose to 50% sucrose buffer (data not shown). This change is also visible to the eye: the liposome solution in pure buffer is opaque whereas the 50% sucrose buffer liposome solution is perfectly clear.
Fig 3.
LD of soy lipid liposomes (sloping spectra) and the membrane probe Ru(phen)2dppzcpCOOCH3 in the bilayer of the same liposomes (structured spectra), in the presence of varying sucrose concentrations (0%, 10%, 30%, and 50% wt/wt) in the aqueous buffer. The arrow shows increasing sucrose concentrations.
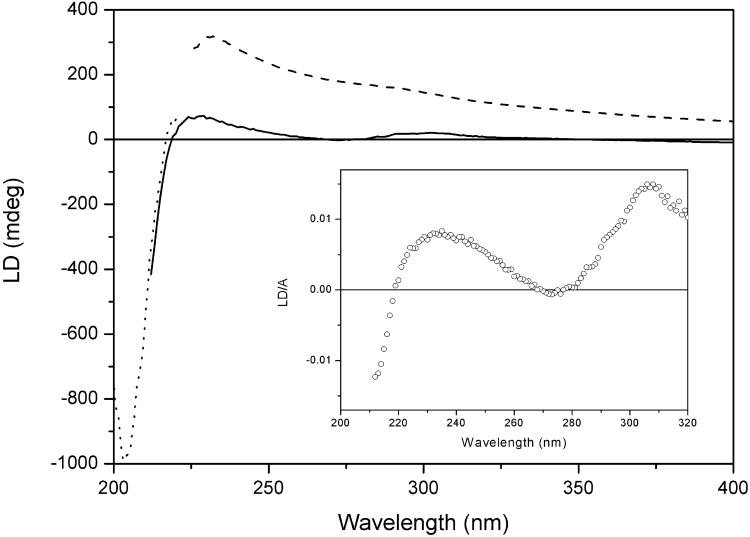
Fig. 4 shows the LD of gramicidin D oriented in the lipid bilayer with (solid line) and without (dashed line) 50% sucrose present in the buffer. The advantage of the scattering-reducing sucrose becomes even more evident here: the nonsucrose sample shows a strong background due to turbidity LD, obviating any observation of absorption LD signals from the peptide. By contrast, the sucrose sample has no scattering, and the true LD peaks due to the absorption bands of the probes are easily discernible.
Fig 4.
LD of gramicidin D in liposomes in the presence (solid line) and absence (dashed line) of 50% sucrose in the buffer. The sample was diluted four times with sucrose buffer to reach 200 nm (dotted line spectrum, scaled). (Inset) The reduced LD (LD/A) of the sucrose-containing sample.
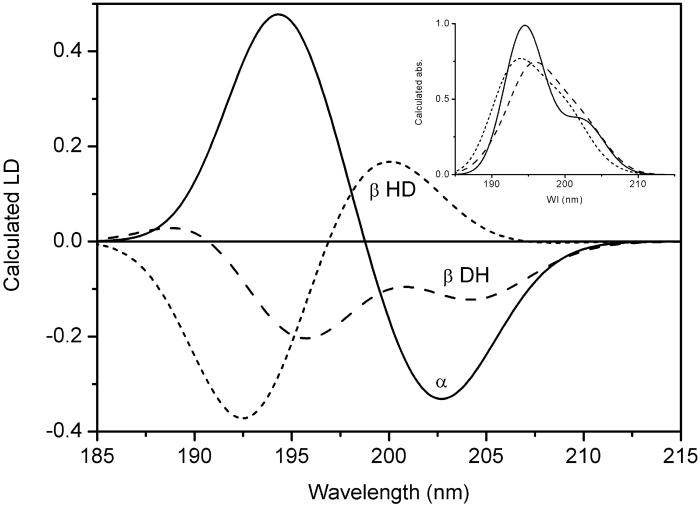
At shorter wavelengths, the LD spectrum is dominated by the peptide transitions: the positive signal at 230 nm can be assigned an n→π* transition polarized perpendicular to the plane of the amide bond whereas the negative LD around 204 nm is due to an exciton component from coupled amide π→π* transitions. Coupled-oscillator calculations using Schellman's matrix method (15) were carried out for three trial peptide-helix conformations: an α-helix (α), a dimeric β-helix channel form (β HD), and an intertwined parallel β-helix (β DH) (8). Their respective predicted LD and absorption spectra are shown in Fig. 5. In an α-helix polypeptide the π→π* transitions have been shown experimentally to couple to produce one exciton transition polarized parallel to the helix axis at lower energy (205 nm) and two degenerate transitions perpendicular to the helix axis at higher energy (190 nm) (24), a pattern also reproduced in our calculations. The calculated LD spectrum of the HD (β HD) is not in accordance with the LD we observe, because it predicts the LD at 204 nm to be positive; on the contrary, we observe a negative LD band at 204 nm for our membrane-associated gramicidin, in accordance with the LD predicted for the intertwined membrane-spanning double β-helix structure (β DH). The LD/A ratio at 204 nm for this structure is calculated to be −0.45 (assuming S = 1). On the other hand, the n→π* transitions, observed as a positive band at 230 nm, are predicted from calculations with noninteracting transitions to show positive LD for all three structures, with a LD/A ratio ranging from 0.3 (β HD) to 0.45 (β DH) to 0.7 for the α-helix, all assuming S = 1.
Fig 5.
Calculated coupled-oscillator LD for the peptide π→π* transition of gramicidin in different possible conformations: α-helix (solid line; α), a parallel intertwined double β-helix (long dash; β DH), and a HD of β-helices (short dash; β HD). (Inset) The calculated absorption for the same structures. The π→π* transition moment was taken to be directed along a line connecting the middle of the carbonyl bond and the nitrogen of the amide group (16). An alternative polarization with the transition moment directed between the carbonyl carbon and the nitrogen (17) gave a similar result. The values for the LD and absorption are relative, with the maximal absorbance set to 1.
Near 300 nm we also see a split LD signal due to the indole side-chain chromophore of the tryptophan residues. The positive LD maximum of the tryptophan band is shifted to longer wavelengths (300 nm) compared with the absorption spectrum, corresponding to a positive contribution from the Lb transition at longer wavelength and a negative contribution from the La transition at shorter wavelength (transitions strongly overlapping) (21). The Lb transition has a transition moment pointing in the direction between the linking side-chain carbon and the six-membered ring of the indole chromophore, the positive LD indicating it to be preferentially aligned parallel with the membrane surface, whereas the La transition, making almost a right angle with the Lb transition moment in the plane of the chromophore (Fig. 2) (21), gives a negative LD and thus is more parallel with the lipid chains. In total, there are eight tryptophan residues per dimeric channel or DH, with somewhat different orientations to the helix axis (18, 19). Our calculation of the expected LD of the eight tryptophan residues, assuming them to be similarly oriented as in the double HD structure (19), in fact shows that the La band should be negative and the Lb band positive, with approximately the same size. The LD/A ratio of the Lb band was predicted to be 0.57, comparable to the magnitudes predicted for the n→π* and π→π* transitions of the peptide bands. That the La band is not so strongly negative in our LD spectrum (Fig. 4) is consistent with a certain rotational mobility around the linking bond, a mobility that would lower the La contribution more than it would the Lb contribution, because the latter is more parallel to the bond axis (Fig. 2). In fact, the observed LD/A ratio (Fig. 4 Inset) of the Lb band is of the same magnitude as the LD/A ratios in the n→π* and π→π* bands. The indole moiety of tryptophan could be expected to insert itself among the lipid molecules giving it an orientation with the aromatic plane preferentially parallel with the lipid chains, in agreement with the observed small negative LD of the La transition moment. The more perpendicular orientation (parallel to the bilayer surface) of the Lb transition may reflect the side chain preferentially pointing perpendicular to the gramicidin helix. The Bb transition of tryptophan, at ≈220 nm, is calculated to have a LD/A of + 0.2 (with S = 1), but despite it being more intense than the La and Lb bands, it would not be discernible in the LD on the background of strong overlapping π→π* and n→π* transitions from the peptide bonds.
It is interesting to note that the calculated LD/A values of all four bands for the double β-helix structure (the π→π*, n→π*, and the tryptophan La and Lb bands) agree in signs and relative magnitudes with the observed LD/A (Fig. 4 Inset). This finding suggests that the gramicidin helices indeed adopt one distinct conformation and orientation in the membrane environment, and that the small observed LD/A ratios are mainly caused by a small S, i.e., the rather small degree of deformation and alignment of the vesicles.
If all gramicidin molecules were forming membrane-spanning helices, and these were all perfectly aligned perpendicular to the membrane surface and the flow-deformed liposome membrane in turn behaving as a perfectly oriented infinite cylinder, a negative extreme LD/A ratio equal to −1.5 would have been theoretically expected (2). Our calculations indicate that this value should be substantially lowered by mutual cancellations from overlapping bands, reaching a hypothetical value of only −0.45 in the long-axis band of the intertwined helices (Fig. 5, β DH). From the LD behavior of the metal complex membrane orientation probe (LD/A = −0.008 for the A polarized transition at 350 nm), we note that the membrane is far from perfectly oriented. To get a rough estimate of the degree of membrane orientation, we can compare the behavior of the probe molecule in a lamellar liquid crystal (23), in which its orientation factor S was found to be close to 0.5 and thus represented a remarkably high orientational degree. Assuming that the degree of local orientation of the probe within the lamellar and vesicle bilayers is similar, this indicates that the liposome-membrane orientation is quite poor and that the LD/A of gramicidin should at most amount to 0.02–0.03, if the helices were perfectly oriented across the membrane. Thus, we note that the gramicidin helices are at least as well oriented as the probe molecule, if not better. The observed LD/A ratios are the largest we have measured for this type of system and clearly indicate that gramicidin in this phospholipid membrane forms well-aligned intertwined transmembrane helices.
Conclusion
The use of LD on liposomes to examine molecules oriented in the lipid bilayer has evident potential for studying membrane proteins and other systems not amenable to x-ray or NMR techniques. The scattering from the liposomes has, however, been an obstacle when the molecules of interest absorb at short wavelengths, and therefore impeded study of biomolecules such as peptides or nucleic acids.
By refractive index matching with sucrose we have demonstrated that it is possible to reduce the scattering of the liposomes without seriously altering their characteristics. We have also found that the sucrose-containing liposomal solutions give more intense LD spectra because of increased viscous shear forces on the liposomes, which in turn permits more reliable assignment of transition moment orientations. Especially, it is demonstrated that the improved method allows the assessment of orientation of aromatic peptide residues and peptide transitions needed for determining the conformation and the organization of peptides and proteins in a membrane environment.
Abbreviations
LD, linear dichroism
HD, helical dimer
DH, double helix
References
- 1.Ardhammar M., Mikati, N. & Nordén, B. (1998) J. Am. Chem. Soc. 120 9957-9958. [Google Scholar]
- 2.Ardhammar M., Lincoln, P. & Nordén, B. (2001) J. Phys. Chem. B 105 11363-11368. [Google Scholar]
- 3.Rodger A., Rajendra, J., Marrington, R., Ardhammar, M., Nordén, B., Hirst, J. D., Gilbert, A. T. B., Dafforn, T. R., Halsall, D. J., Woolhead, C. A., et al. (2002) Phys. Chem. Chem. Phys. 4 4051-4057. [Google Scholar]
- 4.Wells H. G., (1897) The Invisible Man: A Grotesque Romance (Harper & Brothers, New York).
- 5.Kiselev M. A., Lesieur, P., Kisselev, A. M., Lombardo, D., Killany, M. & Lesieur, S. (2001) J. Alloys Comp. 328 71-76. [Google Scholar]
- 6.Nagase H., Ueda, H. & Nakagaki, M. (1997) Biochim. Biophys. Acta 1328 197-206. [DOI] [PubMed] [Google Scholar]
- 7.Dubos R. J. (1939) J. Exp. Med. 70 1-17. [DOI] [PMC free article] [PubMed] [Google Scholar]
- 8.Wallace B. A. (1990) Annu. Rev. Biophys. Biophys. Chem. 19 127-157. [DOI] [PubMed] [Google Scholar]
- 9.Galbraith T. P. & Wallace, B. A. (1998) Faraday Discuss. 111 159-164. [DOI] [PubMed] [Google Scholar]
- 10.Önfelt B., Lincoln, P. & Nordén, B. (1999) J. Am. Chem. Soc. 121 10846-10847. [Google Scholar]
- 11.Hiort C., Lincoln, P. & Nordén, B. (1993) J. Am. Chem. Soc. 115 3448-3454. [Google Scholar]
- 12.Davidsson Å. & Nordén, B. (1976) Chemica Scripta 9 49-53. [Google Scholar]
- 13.Kizel V. A., Krasilov, Y. I. & Shamraev, V. N. (1964) Opt. Spectrosc. 17 248-249. [Google Scholar]
- 14.Nordén B., Kubista, M. & Kurucsev, T. (1992) Q. Rev. Biophys. 25 51-170. [DOI] [PubMed] [Google Scholar]
- 15.Bayley P. M., Nielsen, E. B. & Schellman, J. A. (1969) J. Phys. Chem. 73 228-243. [DOI] [PubMed] [Google Scholar]
- 16.Peterson D. L. & Simpson, W. T. (1957) J. Am. Chem. Soc. 79 2375-2382. [Google Scholar]
- 17.Clark L. B. (1995) J. Am. Chem. Soc. 117 7974-7986. [Google Scholar]
- 18.Ketchem R. R., Hu, W. & Cross, T. A. (1993) Science 261 1457-1460. [DOI] [PubMed] [Google Scholar]
- 19.Chen Y., Tucker, A. & Wallace, B. A. (1996) J. Mol. Biol. 264 757-769. [DOI] [PubMed] [Google Scholar]
- 20.Albinsson B. & Norden, B. (1992) J. Phys. Chem. 96 6204-6212. [Google Scholar]
- 21.Albinsson B., Kubista, M., Nordén, B. & Thulstrup, E. W. (1989) J. Phys. Chem. 93 6646-6654. [Google Scholar]
- 22.Lincoln P., Broo, A. & Nordén, B. (1996) J. Am. Chem. Soc. 118 2644-2653. [Google Scholar]
- 23.Ardhammar M., Lincoln, P., Rodger, A. & Nordén, B. (2002) Chem. Phys. Lett. 354 44-50. [Google Scholar]
- 24.Brahms J., Pilet, J., Damany, H. & Chandrasekharan, V. (1968) Proc. Natl. Acad. Sci. USA 60 1130-1137. [DOI] [PMC free article] [PubMed] [Google Scholar]


