Abstract
Very short alanine peptide helices can be studied in a fixed-nucleus, helix-forming system [Siedlicka, M., Goch, G., Ejchart, A., Sticht, H. & Bierzynski, A. (1999) Proc. Natl. Acad. Sci. USA 96, 903–908]. In a 12-residue sequence taken from an EF-hand protein, the four C-terminal peptide units become helical when the peptide binds La3+, and somewhat longer helices may be made by adding alanine residues at the C terminus. The helices studied here contain 4, 8, or 11 peptide units. Surprisingly, these short fixed-nucleus helices remain almost fully helical from 4 to 65°C, according to circular dichroism results reported here, and in agreement with titration calorimetry results reported recently. These peptides are used here to define the circular dichroism properties of short helices, which are needed for accurate measurement of helix propensities. Two striking properties are: (i) the temperature coefficient of mean peptide ellipticity depends strongly on helix length; and (ii) the intensity of the signal decreases much less rapidly with helix length, for very short helices, than supposed in the past. The circular dichroism spectra of the short helices are compared with new theoretical calculations, based on the experimentally determined direction of the NV1 transition moment.
A long-standing goal in the study of peptide helices has been to relate the properties of helix formation in standard peptides (for example, in alanine-based peptides; refs. 1–3) to those observed when the helix is initiated by a helical template or an actual fixed helical nucleus (4–7). The first results obtained by using a synthetic template to initiate helix formation (4–6) showed little relation to the results found with standard peptides. In particular, alanine residues added to the synthetic template were reported (4–6) to have a lower helix propensity than in alanine-based peptides. The synthetic template used in these initial studies was acetyl-l-Pro-l-Pro, only one of whose three conformers is productive in initiating a helix (4–6). Bierzynski and coworkers (7) succeeded in nucleating short alanine-rich helices with a helical nucleus obtained by binding La3+ to a 12-residue peptide (P1) modeled on an EF-hand protein. The four C-terminal peptide units become helical when P1 binds La3+, and longer helices can be made by adding residues at the C terminus of P1. The NMR structure (7) of a second peptide P2, with four additional residues (A3Q) added to, P1 defines the structure of the fixed helical nucleus, and agrees with earlier work (8) on the ligands that coordinate La3+. All but one of the participating ligands lie outside the helix in the N-terminal direction; the side-chain -COOH group of Glu 12, inside the helix, participates in binding La3+. Recently, Bierzynski and coworkers made an extensive study of helix propagation in this system (to be published), and they found a helix propensity for alanine in good agreement with results from standard alanine-based peptides (A. Bierzynski, personal communication).
Circular dichroism (CD) has long been a key method of measuring helix formation by peptides (9). The strong negative CD band centered at 222 nm is well suited for this purpose, because it depends on the structure and properties of the helix backbone, and because few interfering side-chain bands, except for Trp, Tyr, and Phe, exist. Little is known, however, about the far-UV CD bands of very short helices, and their properties are expected to depend strongly on helix length for very short helices (10). Because short helices formed by standard peptides are only marginally stable, and they form partly frayed helices, it has been difficult to study this problem. The effect of varying helix length on measured values of helix propensities was studied (and good agreement was found) by comparing results for peptides from 12–22 residues measured by two independent methods: CD and the kinetics of amide proton exchange (11).
The short, fixed-nucleus helices formed by the addition of La3+ (7) are ideally suited to the study of the CD bands of very short helices because almost complete helix formation is found, as reported earlier by Bierzynski and coworkers (7) and by us, in a collaborative study with Lopez et al. (12) of the enthalpy of alanine helix formation. The same enthalpy value, within error, was found for forming an alanine-based helix (−0.9 ± 0.1 kcal/mol per residue) in this fixed-nucleus system as found earlier with standard alanine-based peptides (13), and a new titration calorimetry study by Bierzynski and coworkers also agrees within error (personal communication). The La3+-bound helices are resistant to thermal unfolding by the test that the unfolding enthalpy per residue is constant, independent of both helix length and temperature, if the helices remain fully helical in the temperature interval studied (5–45°C) (12). The peptides studied (12) include peptides P1 and P2 of Bierzynski and coworkers (7) and a longer peptide P3, which contains seven additional residues (A6Q) joined to the C-terminal end of the P1 sequence. The CD spectra of these three short peptide helices are studied here.
The CD-based test for resistance to thermal unfolding of the La3+-bound helices is as follows. We assume that heat-induced unfolding will produce a curved (sigmoidal) profile of CD versus temperature, as observed with the partly helical peptides (P1–P3) formed in the absence of La3+; these partially formed helices undergo further helix unfolding with increasing temperature. The La3+-bound helices are likely to show a decrease in chiroptical power with increasing temperature, as predicted by the rule of Kauzmann and Eyring (14), and the decrease should be approximately linear if the increase in temperature is not large. If, however, partial unfolding occurs, an additional loss of helical CD will take place, and the overall change in helix ellipticity should be proportionately larger if partial helix unfolding occurs.
The standard empirical procedure for representing the variation with helix length of the mean residue ellipticity of a fully formed helix has the form (15):
 |
where [θH](Np) is the mean peptide ellipticity of a helix with Np peptide units, [θH](∞) is the mean peptide ellipticity of an infinite helix, and x is an empirical constant, about four peptide units (11, 15, 16). (If mean residue ellipticity is used instead of mean peptide ellipticity, then x should be decreased by one for the blocked peptides studied here, which have one more peptide unit than amino acid residues.) This form of length dependence (Eq. 1) is expected if, as sometimes supposed, only H-bonded peptide CO groups contribute to the helical CD spectrum. The peptide CO groups at the C terminus of an α-helix are not H bonded; three nonbonded CO groups occur if the α-COOH group is blocked with an amide group, as in the peptides studied here, or four nonbonded CO groups if the α-COOH group is unblocked. When x = 4, Eq. 1 predicts that a short helix with only four helical peptide units should have no helical CD spectrum. It is surprising and interesting, therefore, to observe that La3+-bound P1, with four helical peptide units, does have a substantial CD spectrum. (See also ref. 7.)
Several theoretical studies of α-helix chiroptical properties (ORD and CD) have considered the effects of helix length (10, 18–21). All of these studies predicted that short α-helices should have CD spectra substantially different from those of long α-helices. In addition to smaller amplitudes, it was predicted that the negative band near 205 nm should not be detectable for helices with <10–15 peptides.
Moffitt (22) predicted that exciton (23) interactions among the first amide ππ* (NV1) transition dipole moments in the infinite α-helix give rise to a strong, parallel-polarized (relative to the helix axis) absorption band on the long-wavelength edge of the ππ* band and two, degenerate, perpendicularly polarized absorption bands on the short-wavelength edge. The negative CD band observed near 205 nm in long α-helices results from the parallel-polarized Moffitt exciton band. This band can also be identified in calculations of short helices (18, 20, 21). However, only in helices longer than 10–15 peptides was the parallel-polarized band predicted to lie on the long-wavelength edge of the exciton band and to be sufficiently well resolved to give rise to a discrete negative band in the 200–205 region.
Recently, experimental (24) and ab initio (25, 26) studies have demonstrated that the NV1 transition dipole moment direction differs by 15–20° between primary and secondary amides. The direction of the NV1 transition dipole is characterized by the angle it makes with the carbonyl bond direction. This angle, τ, is defined as positive for rotation toward the amide nitrogen. Clark (24) found that the transition moment direction for the secondary amide in N-acetylglycine has τ = −55°, whereas that for the primary amide in propanamide has τ = −37°. This latter value is in good agreement with the value of τ = −41° determined for myristamide by Peterson and Simpson (27). Previous calculations of α-helix CD used the transition moment direction characteristic of primary amides (27) or similar theoretical values because reliable data on the more appropriate secondary amide group were not available. Calculations of oligopeptide and protein CD with transition moment direction for a secondary amide (24) lead to marked improvement in agreement with experiment (28, 29). In this paper, we show that Clark's (24) transition moment direction predicts CD spectra for short helices that are in qualitative agreement with the experimental data presented here, in contrast to the direction used in earlier calculations.
Materials and Methods
Peptide Synthesis, Purification, and Stock Solution Preparation.
Peptides P1 [Ac-DKDGDGYISAAE-NH2], P2 [Ac-DKDGDGYISAAEAAAQ-NH2], P3 [Ac-DKDGDGYISAAEAAAAAAQ-NH2] were made as described (12). The peptides were purified and analyzed by a Waters Millennium HPLC (Waters) equipped with a 996 photodiode array detector, and a 474 fluorescence detector. Molecular weights were confirmed by a Finnigan LCQ mmass spectrometer (Thermo Finnigan, San Jose, CA) using an electrospray ionization mode. Peptide stock solutions were stored at −20°C before use. Concentrations were determined as described (12). The lanthanum chloride heptahydrate (99.999%) is from Aldrich. The concentration of the lanthanum chloride stock (9.71 mM ± 0.15%) was determined by titration with EDTA and NaOH. The standard solution of the disodium salt of EDTA (0.1000 N) is from J.T. Baker, and the concentration of NaOH stock (0.0981 N) was determined by using a standard HCl solution (0.00997 N from J.T. Baker).
CD Spectroscopy.
All CD measurements described here were made by using 1.0-mm cells. In measuring thermal transition curves, the ellipticity at 222 nm for each peptide was measured versus temperature on an Aviv 62 DS spectropolarimeter (Aviv Associates, Lakewood, NJ) as described (12). The ellipticity at 250 nm was also recorded versus temperature and then set to zero for normalization of the 222 nm data by linear fitting. Measurements of CD spectra from 260 to 185 nm were made at 4°C by using a Jasco J-715 spectropolarimeter (Jasco, Tokyo) equipped with a Neslab RTE-140 temperature control unit (Thermo Neslab, Portsmouth, NH) and a cylindrical water-jacketed quartz cell. The ellipticity was calibrated with (+)-10-camphorsulfonic acid. The sample contains peptide (50 μM for P1, 40 μM for P2, and 30 μM for P3), 1 mM Tris⋅HCl (pH 6.9), and 0.1 N NaClO4, with or without 1 mM lanthanum chloride. Both the concentrations of peptide and lanthanum chloride were adjusted so that the dynode voltage (Aviv CD) or the HT voltage (Jasco CD) could be properly controlled, giving reliable ellipticity data down to 185 nm. At these concentrations, each peptide remains saturated with bound lanthanum. The ellipticity was recorded every 1 nm and averaged over 64 s of acquisition time. The spectra obtained under these conditions are superimposable with those obtained from 200 to 260 nm from the Aviv 62 DS spectropolarimeter, with solutions containing 100 μM peptide, 1 mM sodium cacodylate (pH 6.9), and 0.1 N NaCl, with or without 2.5 mM lanthanum chloride.
Prediction of CD Spectra for Short Helices.
The CD spectra of short α-helices were calculated by the matrix method (30) in its origin-independent form (31), with parameters described (ref. 28 and references therein) for the electronic transitions of the amide group. A crucial feature of these calculations is the use of the transition moments for the amide ππ* transitions determined by Clark (24) for a secondary amide, N-acetylglycine. The helix geometry used in the calculations was generated from the standard amide coordinates of Ooi et al. (32) with (φ, ψ) = (−62°, −41°), the average Ramachandran angles for α-helical segments in a large set of proteins (33). CD spectra were generated from the calculated rotational strengths assuming Gaussian band shapes. The bandwidth parameter (half-width at e−1 of the maximum) was taken to be 10.5 nm for the nπ* transition, 11.3 nm for the first ππ* transition, and 7.2 nm for the second ππ* transition.
Results
Nonlinearity Test for Partial Helix Unfolding.
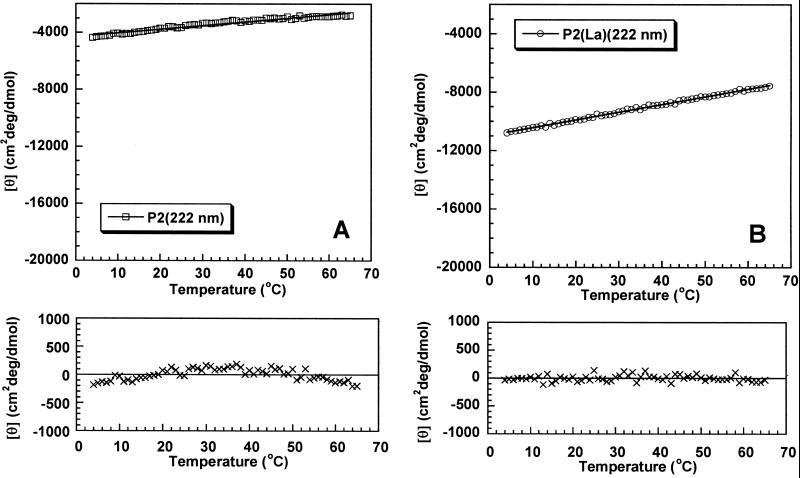
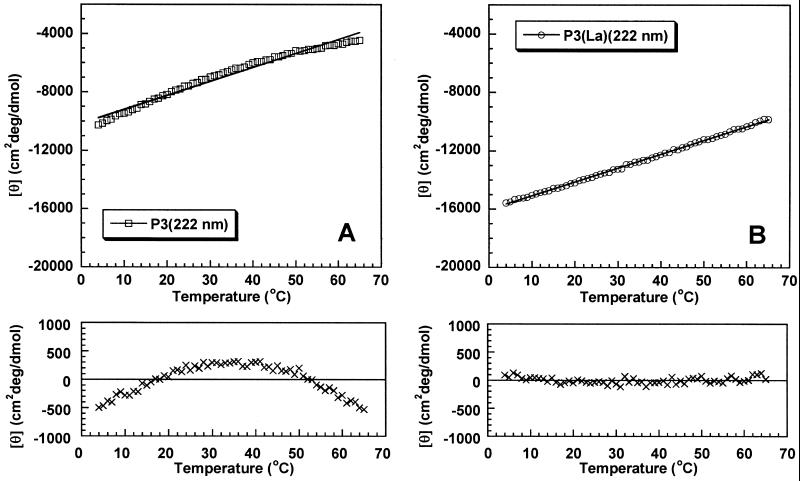
Fig. 1 shows the deviations from linearity when mean peptide ellipticity is plotted against temperature for peptide P2 without La3+ (Fig. 1A) and with La3+ (Fig. 1B). Deviations from linearity are readily observed without La3+ but not with La3+, although the mean peptide ellipticity at 4°C is substantially smaller (less negative) without La3+ (−4,400 deg⋅cm2/dmol) than with La3+ (−10,800). Exactly the same behavior is seen for peptide P3 without La3+ (Fig. 2A) and with La3+ (Fig. 2B), and nonlinearity is more pronounced for P3 than for P2 without La3+; the mean peptide ellipticity of P3 at 4°C is −10,300 deg⋅cm2/dmol. No deviation from linearity is observed for P3 with La3+ although its mean peptide ellipticity at 4°C is substantially more negative (−15,600 deg⋅cm2/dmol) than that of P2.
Fig 1.
Nonlinearity test for partial helix unfolding caused by increasing temperature, applied to peptide P2 without La3+ (A) and with La3+ (B). The ordinate is mean peptide ellipticity at 222 nm, which is fitted by least squares to a linear dependence on temperature. (Upper) Linear fit of the data; (Lower) deviations from linearity. Note systematic curvature of the deviations in A but not in B. See Materials and Methods for solution conditions.
Fig 2.
Nonlinearity test for partial helix unfolding applied to peptide P3 without La3+ (A) and with La3+ (B). See legend to Fig. 1 for details.
CD Spectra of Short Helices.
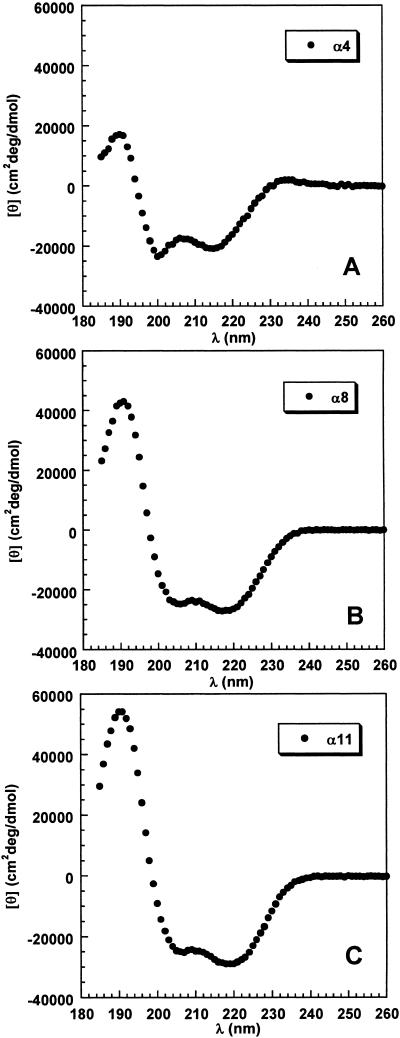
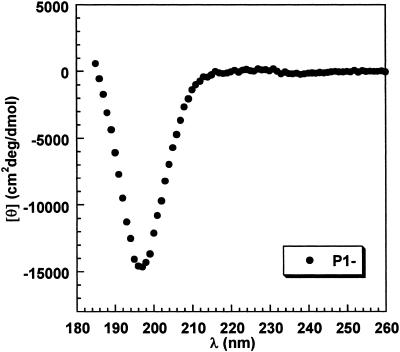
The helical CD spectra of La3+-bound peptides P1, P2, and P3 are given in Fig. 3. The spectra are calculated per helical peptide unit, as follows. First, La3+-bound peptides P1, P2, and P3 are assumed to have 4, 8, and 11 helical peptide units, respectively. Next, the contribution to the total ellipticity from the nine nonhelical peptide units present in each of the three peptides is subtracted by assuming that it equals nine times the mean peptide ellipticity of peptide P1 without La3+. The CD spectrum of P1 without La3+ is given in Fig. 4. The mean peptide ellipticity is nearly zero above 214 nm, and a strong negative band is centered at 197 nm (see Discussion).
Fig 3.
CD spectra taken in 0.1 M NaClO4, 4°C, of the helical segment (with La3+) of peptide P1 (A), P2 (B), and P3 (C). The ordinate shows mean peptide ellipticity per helical peptide unit, assuming four helical peptide units in P1, eight in P2, and 11 in P3. See text for method of subtracting the contribution from the nine nonhelical peptide units, and see Materials and Methods for solution conditions.
Fig 4.
CD spectrum of peptide P1 without La3+ at 4°C, which is used as the reference for subtracting the contribution of nine nonhelical peptide units to the CD spectra in Fig. 3 (see text).
Consequently, the procedure used to subtract the spectral contribution from the nine nonhelical peptide units has little effect above 214 nm on the CD spectra of the short helices, but it does affect the CD spectra below 214 nm.
A new analysis of helix formation in this system by Bierzynski and coworkers (personal communication) indicates that helix formation is not quite complete. Their results indicate that the effect is more pronounced with the peptides they study, which end in C-terminal alanine, than with our peptides, which end in C-terminal glutamine. Regarding the CD spectra in Fig. 3, the consequence of incomplete helix formation is to underestimate slightly the mean peptide ellipticities.
The basic features of the helical CD spectra (Fig. 3) are as follows. (i) The same three bands seen in long helices, with negative maxima at 222 and 208 nm and a positive maximum near 190 nm, are observed in these short helices, but the 208 and 222 nm maxima shift to shorter wavelengths. The long wavelength band has its maximum at 215, 217, and 219 nm for peptides P1, P2, and P3, with 4, 8, and 11 helical peptide units, respectively (2). The values of the mean peptide ellipticity at the two maxima, corresponding to 208 and 222 nm in long helices, remain approximately equal to each other in all three short helices, although the value at each maximum becomes smaller (less negative) as the helix shortens (3). A striking decrease in mean peptide ellipticity occurs at the maximum near 190 nm as the helix shortens.
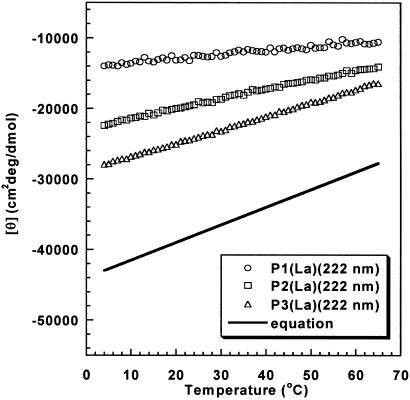
The decrease in negative ellipticity at 222 nm as the helix shortens is caused in roughly equal parts by the shift of the maximum to lower wavelengths and by the decrease at the maximum. When the value of x in Eq. 1 is determined from the mean peptide ellipticity at 222 nm for each of the three short helices, by using −43,000 for the infinite helix at 4°C (11), the values of x are found to be: 2.8 (P1, four peptide units), 3.5 (P2, eight units), and 4.0 (P3, 11 units). These numbers mean that x in Eq. 1 varies with helix length for short helices, although the commonly used value of x = 4 may be fairly constant for longer helices.
The Temperature Coefficient of Mean Peptide Ellipticity.
Fig. 5 shows how the mean peptide ellipticity at 222 nm varies with temperature for short fixed-nucleus helices of varying helix lengths, and Fig. 5 also compares the infinite helix behavior found for standard alanine-based peptides (11). The basic result is that the temperature coefficient is small for short helices but increases strongly with the length of a fixed-nucleus helix, like the mean peptide ellipticity itself, which also increases substantially with helix length for short helices.
Fig 5.
Dependence on temperature of mean peptide ellipticity (222 nm) per helical peptide unit of peptide P1 (four helical peptide units), P2 (eight helical peptide units),and P3 (11 helical peptide units). The equation (y = −44,000 + 250T, with T in degrees Celsius) gives the temperature dependence for the infinite helix found in a study (11) of unnucleated helices of varying chain lengths.
Theoretical Calculations of CD Spectra for Short Helices.
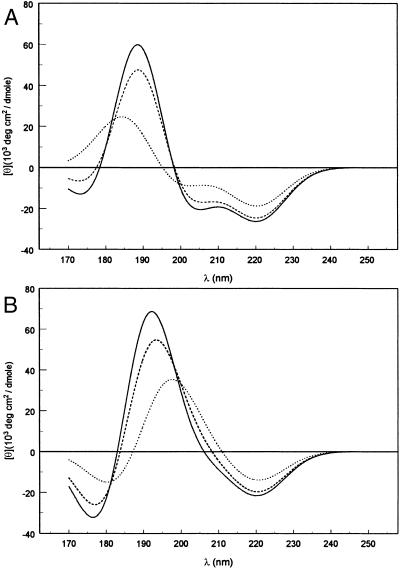
Fig. 6A shows theoretically predicted CD spectra for α-helices with 4, 8, and 11 peptide groups, with an NV1 transition moment direction of −55° (24). The predicted spectra for these short α-helices qualitatively agree with the experimental spectra (Fig. 3). The predicted spectra exhibit the three bands characteristic of α-helices: negative bands near 220 and 205 nm, and a positive band near 190 nm. The amplitude of each band increases with helix length. Experimentally, the two negative bands are comparable in magnitude for all three oligomers but, in the theoretical spectra, the 220-nm band is significantly more intense than the 205-nm band, which is especially marked in the tetramer, for which the ratio is about two. The 220-nm band undergoes little or no wavelength shift in the theoretical spectra, in contrast to the red shift with increasing helix length seen experimentally. The calculations predict a red shift in the negative band in the 205-nm region and in the positive band near 190 nm, both of which agree with the trends observed in the experimental spectra. The predicted amplitudes of the long-wavelength negative bands are consistently lower than those observed. This finding is especially true for the band predicted at 203 nm in the tetramer (observed at 199 nm), which is underestimated by nearly a factor of three. The amplitudes of the short-wavelength positive band in the octamer and undecamer agree rather well with experiment, but for the tetramer the band intensity is overestimated by ≈50%.
Fig 6.
Calculated CD spectra for α-helices with 4 (⋅⋅⋅⋅), 8 (----), and 11 (——) peptide groups, using the NV1 transition moment direction: (A) θ = −55°, Clark's (24) value for secondary amides. (B) θ = −40°, similar to Peterson and Simpson's (27) value for primary amides.
Calculations were also performed (Fig. 6B) with an NV1 transition moment direction of −40° relative to the amide carbonyl bond, a direction close to that determined by Peterson and Simpson (27) for a primary amide and used in all previous calculations of short α-helices (10, 20, 21). The predicted spectra for α-helices with 4, 8, and 11 helical residues resemble those reported previously, but are very different from those shown in Fig. 6A. A single negative band is predicted near 220 nm. The CD at 200 nm is strongly positive, in contrast to the negative CD shown in Fig. 6A. The predicted CD curves change sign between 200 and 210 nm and near 185 nm, as opposed to near 200 nm and below 180 nm (Fig. 6A). The predicted spectrum for the undecamer shows a weak negative shoulder just below 210 nm. Although this feature grows stronger and the crossover shifts to shorter wavelengths with increasing helix length, a discrete negative maximum in the 205-nm region is not predicted for helices with <20 peptides. It is clear that Clark's (24) transition moment direction gives much better agreement with experiment for short α-helices.
Discussion
Helix Flexibility of Short, Fixed-Nucleus Helices.
Our results suggest that the influence of the helical nucleus in these La3+-initiated helices extends beyond the residues immediately adjacent to the nucleus because of the strong dependence on helix length of the temperature coefficient of mean peptide ellipticity (Fig. 5). Presumably, this result means that the flexibility of the helix increases with helix length in this system because the temperature dependence of the chiroptical properties provides a measure of how easily an asymmetric structure is distorted, according to Kauzmann and Eyring (14). The temperature dependence results suggest that the helical nucleus is rigid, locked in place by chelating La3+, whereas the helical residues adjacent to the helix nucleus become rigid by being H-bonded to the nucleus, and more distant helical residues have increased flexibility. This interpretation is consistent with the explanation given earlier (34) of how a synthetic template that is not entirely equivalent to a helical nucleus might weaken the helix and give a low apparent value for the helix propensity of alanine.
CD Spectra of Short Peptides.
The 15° difference in the NV1 transition moment direction for primary and secondary amides has a dramatic effect on the predicted CD spectra of short α-helices, as seen by comparison of Fig. 6 A and B. Use of the proper transition moment direction in the calculations gives predicted spectra for short helices that agree with the observation of the classical double-minimum α-helix CD spectrum at the tetramer level, reported in this work. Why is the calculated CD spectrum so sensitive to the NV1 transition moment direction? The critical factor is the sign of the Coulombic interaction between transition charge densities on nearest neighbor peptide groups along the chain. For τ = −40°, the interaction is repulsive, whereas τ = −55° gives an attractive interaction. Interactions among more distant pairs of transition charge densities are not so strongly affected and are predominantly attractive for both transition moment directions. The red shift of the parallel-polarized exciton component in long helices is given by the sum of the interaction energies between the transition charge density in a given peptide and those of all its neighbors, running in both directions (22). This shift is about 50% larger for τ = −55° than it is for τ = −40° (29) because, in the former case, essentially all of the contributions are negative, whereas in the latter case the nearest neighbor contribution is positive and the more distant contributions are negative. No simple expression exists for the red shift of the parallel-polarized band in short helices, but qualitatively the same argument holds. In fact, the shorter the helix, the more heavily the nearest-neighbor contribution is weighted. Thus, the sign of the nearest-neighbor interaction must be negative if short helices are to have a sufficiently red-shifted parallel-polarized exciton band to give a negative band in the 205-nm region.
The theoretical calculations still underestimate the intensity of the 205-nm band, which probably is associated with a persistent underestimation of the exciton splitting in the infinite α-helix. Use of the Clark (24) transition moment direction (τ = −55°) substantially improves the agreement between the calculated (−0.45 eV; ref. 29) and observed (−0.54 eV; ref. 35) splitting, relative to the values obtained with τ = −40° (−0.32 eV). It is likely that much of the residual discrepancy results from neglect of through-bond coupling between neighboring peptide chromophores. A treatment of such contributions that is under development (29) shifts the parallel-polarized exciton component in the same direction as does the change from τ = −40° to τ = −55°. Other discrepancies probably arise from the neglect of interactions with the solvent (e.g., the wavelength shifts of the 220 nm nπ* band) and imperfections in the amide parameters and in the methods used to calculate Coulomb interactions between transition charge densities.
Acknowledgments
R.W.W. acknowledges the support of National Institutes of Health Grant GM22994 and D.-H.C. acknowledges individual grant NSC 91-2320-B-018-001 from the National Science Council and a Laboratory Grant (NHRI-EX90-8807BL) from the National Health Research Institutes, The Executive Yuan, Republic of China (Taiwan).
Abbreviations
CD, circular dichroism
References
- 1.Rohl C. A., Chakrabartty, A. & Baldwin, R. L. (1996) Protein Sci. 5 2623-2637. [DOI] [PMC free article] [PubMed] [Google Scholar]
- 2.Spek E. J., Olson, C. A., Shi, Z. & Kallenbach, N. R. (1999) J. Am. Chem. Soc. 121 5571-5572. [Google Scholar]
- 3.Park S. H., Shalongo, W. & Stellwagen, E. (1993) Biochemistry 32 7048-7053. [DOI] [PubMed] [Google Scholar]
- 4.Kemp D. S., Boyd, J. G. & Muendel, C. C. (1991) Nature 352 451-454. [DOI] [PubMed] [Google Scholar]
- 5.Groebke K., Renold, P., Tsang, K. Y., Allen, T. J., McClure, T. F. & Kemp, D. S. (1996) Proc. Natl. Acad. Sci. USA 93 4025-4029. [DOI] [PMC free article] [PubMed] [Google Scholar]
- 6.Williams L., Kather, K. & Kemp, D. S. (1998) J. Am. Chem. Soc. 120 11033-11043. [Google Scholar]
- 7.Siedlecka M., Goch, G., Ejchart, A., Sticht, H. & Bierzynski, A. (1999) Proc. Natl. Acad. Sci. USA 96 903-908. [DOI] [PMC free article] [PubMed] [Google Scholar]
- 8.Marsden B. J., Hodges, R. S. & Sykes, B. D. (1989) Biochemistry 28 8839-8847. [DOI] [PubMed] [Google Scholar]
- 9.Kallenbach N. R., Lyu, P. & Zhou, H. (1996) in Circular Dichroism and the Conformational Analysis of Biomolecules, ed. Fasman, G. D. (Plenum, New York), pp. 201–259.
- 10.Manning M. C. & Woody, R. W. (1991) Biopolymers 31 569-586. [DOI] [PubMed] [Google Scholar]
- 11.Rohl C. A. & Baldwin, R. L. (1997) Biochemistry 36 8435-8442. [DOI] [PubMed] [Google Scholar]
- 12.Lopez M. M., Chin, D.-H., Baldwin, R. L. & Makhatadze, G. I. (2002) Proc. Natl. Acad. Sci. USA 99 1298-1302. [DOI] [PMC free article] [PubMed] [Google Scholar]
- 13.Scholtz J. M., Marqusee, S., Baldwin, R. L., York, E. J., Stewart, J. M., Santoro, M. & Bolen, D. W. (1991) Proc. Natl. Acad. Sci. USA 88 2854-2858. [DOI] [PMC free article] [PubMed] [Google Scholar]
- 14.Kauzmann W. & Eyring, H. (1941) J. Chem. Phys. 9 41-53. [Google Scholar]
- 15.Chen Y. H., Yang, J. T. & Martinez, H. M. (1972) Biochemistry 11 4120-4131. [DOI] [PubMed] [Google Scholar]
- 16.Gans P. J., Lyu, P. C., Manning, M. C., Woody, R. W. & Kallenbach, N. R. (1991) Biopolymers 31 1605-1614. [DOI] [PubMed] [Google Scholar]
- 17.Rohl C. A., Scholtz, J. M., York, E. J., Stewart, J. M. & Baldwin, R. L. (1992) Biochemistry 31 1263-1269. [DOI] [PubMed] [Google Scholar]
- 18.Tinoco I., Woody, R. W. & Bradley, D. F. (1963) J. Chem. Phys. 38 1317-1325. [Google Scholar]
- 19.Bradley D. F., Tinoco, I., Jr. & Woody, R. W. (1963) Biopolymers 1 239-267. [Google Scholar]
- 20.Woody R. W. & Tinoco, I., Jr. (1967) J. Chem. Phys. 46 4927-4945. [Google Scholar]
- 21.Madison V. & Schellman, J. (1972) Biopolymers 11 1041-1076. [DOI] [PubMed] [Google Scholar]
- 22.Moffitt W. (1956) J. Chem. Phys. 25 458-478. [Google Scholar]
- 23.Davydov A. S., (1962) Theory of Molecular Excitons, trans. Kasha, M. & Oppenheimer, M., Jr. (McGraw–Hill, New York).
- 24.Clark L. B. (1995) J. Am. Chem. Soc. 117 7974-7986. [Google Scholar]
- 25.Serrano-Andrés L. & Fülscher, M. P. (1996) J. Am. Chem. Soc. 118 12190-12199. [Google Scholar]
- 26.Hirst J. D., Hirst, D. M. & Brooks, C. L., III (1997) J. Phys. Chem. A 101 4821-4827. [Google Scholar]
- 27.Peterson D. L. & Simpson, W. T. (1957) J. Am. Chem. Soc. 79 2375-2382. [Google Scholar]
- 28.Woody R. W. & Sreerama, N. (1999) J. Chem. Phys. 111 2844-2845. [Google Scholar]
- 29.Woody, R. W. & Koslowski, A. (2002) Biophys. Chem., in press. [DOI] [PubMed]
- 30.Bayley P. M., Nielsen, E. B. & Schellman, J. A. (1969) J. Phys. Chem. 73 228-243. [DOI] [PubMed] [Google Scholar]
- 31.Goux W. J. & Hooker, T. M., Jr. (1980) J. Am. Chem. Soc. 102 7080-7087. [Google Scholar]
- 32.Ooi T., Scott, R. A., Vanderkooi, G. & Scheraga, H. A. (1967) J. Chem. Phys. 46 4410-4426. [DOI] [PubMed] [Google Scholar]
- 33.Barlow D. J. & Thornton, J. M. (1988) J. Mol. Biol. 201 601-619. [DOI] [PubMed] [Google Scholar]
- 34.Rohl C. A., Fiori, W. & Baldwin, R. L. (1999) Proc. Natl. Acad. Sci. USA 96 3682-3687. [DOI] [PMC free article] [PubMed] [Google Scholar]
- 35.Mandel R. & Holzwarth, G. (1972) J. Chem. Phys. 57 3469-3477. [Google Scholar]


