

Abstract
The development of most phenotypic traits involves complex interactions between many underlying factors, both genetic and environmental. To study the evolution of such processes, a set of mathematical relationships is derived that describe how selection acts to change the distribution of genetic variation given arbitrarily complex developmental interactions and any distribution of genetic and environmental variation. The result is illustrated by using it to derive models for the evolution of dominance and for the evolutionary consequences of asymmetry in the distribution of genetic variation.
During development of a phenotypic trait, gene products interact in highly nonadditive ways with one another and with environmental factors (1). Despite this, much evolutionary theory assumes additive contributions of gene products to phenotype (2). Specific models involving epistasis have been studied since the inception of population genetics, and they have attracted increased interest in recent years (3–8). The complexity introduced by epistasis, however, has meant that only special cases have been studied.
Below, I construct a theory for the evolution of developmental interactions that requires no simplifying assumptions about the number of underlying genetic and environmental factors involved, how they interact, or the distribution of variation in a population. The theory is framed in terms of movement of a population over a phenotype landscape, a plot of a phenotypic trait as a function of the underlying genetic and environmental factors that contribute to its development. I first discuss the idea of a generalized phenotype landscape, then introduce some notation that facilitates mathematical analysis of such landscapes, and finally use this notation to derive an equation for evolution of a population on an arbitrarily complex phenotype landscape.
Generalized Phenotype Landscapes
Consider a phenotypic trait, φ, influenced by a set of underlying factors, u1, u2, … , uk. An underlying factor may represent the degree of expression of some gene product, a quantitative character in development (e.g., concentration of an inducer), or an environmental factor such as salinity or temperature. There is no distinction here between environmental and genetic underlying factors; each underlying factor is assigned a heritability and even those with zero heritability can influence the evolution of other, heritable, factors (7). Although I will treat the underlying factors as continuous variables, their distribution need not be continuous. For example, uj may represent the enzymatic activity of a gene product (a continuous value), whereas the distribution of values of uj in a population may be discrete, corresponding to distinct alleles.
Plotting phenotype as a function of the k underlying factors yields a k-dimensional surface, the phenotype landscape (Fig. 1). Contours on this landscape are sets of values for the underlying factors that produce the same phenotypic value (6). The standard quantities used in quantitative genetics, such as additive and epistatic variance, can be calculated from the shape of the phenotype landscape and the distribution of underlying variation (9).
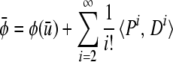
Fig 1.

Three phenotype landscapes and the evolution vectors that are relevant on them. The contours are lines of equal value of the trait, with the solid contour in each case being the optimal value of the trait. (a) An additive landscape (φ = u1 + u2). (b) A quadratic landscape. It is assumed here that ∂2w/∂φ2 < 0. Otherwise, Q1,2 would point in the opposite direction. (c) A cubic landscape.
The geometry of this surface is determined by how the underlying factors interact to influence phenotype, in other words, by development. There is a straightforward relation between the terminology of gene interaction and the geometry of the phenotype landscape. If u1 and u2 are genetic (heritable) factors, then the degree to which the value of u1 influences the phenotypic consequences of changing u2 (i.e., the epistatic interaction between them) is ∂2φ/∂u1∂u2, which measures the curvature of the landscape in one direction. Similarly, ∂2φ/∂u measures the nonlinear effects of changing u1 and thus (when u1 is genetic) provides a measure of dominance (10). If u1 is a genetic factor and u2 an environmental factor, then ∂2φ/∂u1∂u2 measures the genotype by environment (G × E) interaction. If we hold all of the environmental underlying factors constant and consider only the genetic factors, then we have the “genotype–phenotype map.” Conversely, if we take a “slice” of the phenotype landscape along one of the environmental axes, then we have a “norm of reaction,” a plot of phenotype as a function of that particular environmental variable. The slope of the landscape at a particular point determines how sensitive phenotype is to underlying variation at that point; it thus provides a measure of “phenotypic robustness” or “canalization.”
The real value of the phenotype landscape is that we can solve analytically for how selection will act on a population placed on this surface. To do this, we write the selection differential (the change due only to selection, prior to other processes such as recombination) in terms of a set of vectors, each of which gives us insight into the evolutionary consequences of a different kind of developmental interaction or aspect of the distribution of genetic variation.
Fig. 1a shows an uncurved phenotype landscape, corresponding to a case in which all underlying factors contribute additively to the trait (i.e., no epistasis or dominance) and a symmetrical distribution of underlying variation. In this case, the selection differential is described by a single vector (called Q1; the notation will be explained below), pointing in the direction of the optimal phenotype contour and influenced by the variance and covariance values of the distribution of underlying variation. The formula for the vector Q1 contains only first derivatives of phenotype with respect to the underlying factors (∂φ/∂u), which are the only derivatives that exist on an uncurved landscape.
In Fig. 1b, the landscape is curved (here a quadratic function), indicating epistatic interaction between the underlying factors. The vector Q1 still exists and has the same interpretation as before, but now there is another vector, Q1,2, that points in the direction in which the slope of the landscape changes most quickly. This vector contains terms involving the product of the first and second derivatives of phenotype with respect to the underlying factors (∂φ/∂u⋅∂2φ/∂u2) and thus does not exist on an uncurved landscape.
Previously (6), I showed that evolution on a quadratic phenotype landscape (all derivatives higher than second are zero, meaning that we are considering only first-order epistatic interactions) is given by the sum of Q1 and Q1,2, one vector moving the population toward the optimal phenotype contour and the other moving it toward a point of minimum slope along that contour. Below, I show how to extend this approach to arbitrarily complex phenotype landscapes. Not surprisingly, more vectors appear, corresponding to ways of changing the population distribution that are not possible on an uncurved or quadratic surface.
One such new vector is shown in Fig 1c. On a landscape with nonzero third derivatives, moving in the direction of the vector Q3 causes the distribution of φ to become positively skewed. This new vector contains third derivatives of the phenotype landscape, which correspond to cases in which, for example, one gene influences the epistatic interaction between two others. This vector thus does not exist on an uncurved or a quadratic surface.
As developmental interactions become more complex, new evolution vectors appear. The theory presented below provides a way to solve for any particular vector, given the set of phenotypic derivatives that underlie it. First, I present a couple of mathematical concepts that greatly simplify analysis of evolution on phenotype landscapes.
Some Useful Notation
Define xi =ui −ūi, so that xi measures each value of underlying factor i by its deviation from the population mean. Let w be the fitness function associated with the phenotypic trait, φ. For now, we assume that the underlying factors influence fitness only through their influence on φ (later, I will discuss the general case in which fitness is influenced by multiple traits, possibly including direct effects of the us). Like φ, w is treated here as a smooth function, though nonlinear partial regressions can be substituted for derivatives to yield an equivalent result (see Appendix).
The derivations that follow are framed in terms of tensors, which for our purposes are simply arrays of elements. The “rank” of a tensor is just the number of subscripts necessary to identify all of its elements. Any first-rank tensor can be written as a vector, with elements Vi identified by a single subscript, and any second-rank tensor can be written as a matrix, with elements Mij requiring two subscripts. (Strictly, to be a tensor, the array must transform under rotation of the coordinate axes in such a way that its actions are unchanged; all of the tensors discussed in this paper have this property but it will not be relevant to our analysis.)
Let Dn be a tensor of rank n with elements defined as
 |
In words, Dn contains all of the nth derivatives of phenotypic trait φ with respect to the underlying factors, evaluated at the population mean value of the underlying factors. For example, D2(1, 1) = ∂2φ/∂u and D2(1, 2) = ∂2φ/∂u1∂u2. D1 is just the gradient vector, ∇φ, that points in the direction of maximum slope on the landscape. D2 is a matrix of second partial derivatives of phenotype with respect to the underlying factors (this is the matrix E in refs. 6 and 7).
(This derivation assumes that the landscape is differentiable. The Appendix shows a parallel derivation based on regressions, which exist even for a kinked or discontinuous surface.)
Let Pn be an nth-rank tensor with elements being the nth central moments of the distribution of underlying factors. Each element is then defined as
 |
where E[] denotes expected value. Because xi = (ui −ūi), P1 is zero. P2 is the covariance matrix, with elements P2(i, j) = E(xixj) =Cov(ui, uj).P3 is a third-order array of third moments.
Higher moments of the distribution will come up repeatedly in the discussion that follows. The important thing to keep in mind is that the even moments measure symmetrical spread about the mean, with higher-order even moments being increasingly sensitive to outliers; so the fourth moment is more sensitive to outliers than is the variance. Odd moments measure asymmetry, with the higher-order odd moments being increasingly sensitive to asymmetrical outliers.
We will be using two operations from tensor analysis, the inner product, designated 〈,〉, and the outer product, designated ⊗. The outer product of two tensors of rank n and m is a new tensor of rank (n + m ) with elements defined as the products of each of the elements of the initial tensors. For example, D1 ⊗ D2 is a third-rank tensor with elements defined as
 |
The outer product as defined here is sometimes referred to as the direct or tensor product.
The inner product of two tensors of rank n and m (chosen so that n ≥ m) is a new tensor of rank (n − m). If n = m, then the result is a number (a tensor of rank zero). The elements of the new tensor are formed by summing over the products of each element in the lower-rank tensor with the corresponding element in the higher-rank tensor, like this:
 |
Note that taking the inner product of a rank-two tensor (a matrix) and a rank-one tensor (a vector) is just the same as premultiplying the vector by the matrix. The generalized inner product defined here is sometimes referred to as a contraction.
On a curved landscape, the mean value of the phenotype may differ from the phenotype value associated with the mean of the underlying factors. Using the tensor notation presented above, we can write the mean value of a phenotypic trait φ as
 |
(see Appendix for derivation). The summation starts with i = 2 because P1 contains all zeros.
The Theory
The details of the derivation are presented in the Appendix. We wish to derive the evolutionary consequences of some combination of interactions between underlying factors, described mathematically by a set of one or more derivatives of phenotype with respect to the underlying factors.
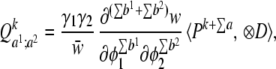
For the general case, consider a set of derivatives like this:
 |
Here, ai denotes the degree of differentiation, which is all that matters for our analysis; thus ∂2φ/∂u2 includes both ∂2φ/∂u and ∂2φ/∂uj∂uk. For example, the set of derivatives ∂φ/∂u⋅∂2φ/∂u2 corresponds to a1 = 1, a2 = 2 (the evolutionary consequences of which are shown in Fig. 1b as Q1,2).
Every such set of derivatives that is nonzero has a corresponding vector in the space of underlying factors; this vector shows the contribution of that combination of developmental interactions to the total selection differential (the change attributable only to selection). To solve for these vectors, we need to specify the number of phenotypic derivatives of each type. Define bj as the number of derivatives of order j. For example, if we are concerned with a set of derivatives of the form ∂φ/∂ui⋅∂φ/∂uj⋅∂2φ/∂u , then b1 = 2 and b2 = 1, because there are two first derivatives and one second derivative; ∑b is the total number of derivatives that we are considering. Given this definition, the general equation for the vector of selection differentials corresponding to the set of derivatives in Eq. 6 is
 |
where γ = 1/(Πai!Πbj!). (See Appendix for details.)
In Eq. 7 the rank of the P tensor is always one greater than the sum of ranks of the D tensors. The inner product is thus a rank-one tensor, which we can write as a vector, Q. (In general, Di ⊗Dj ≠ Dj ⊗Di, but the symmetry of the P tensors makes it so that the order does not matter in Eq. 7.)
We can read some important results directly from Eq. 7. First, note that the relevant moments of the distribution of underlying variation are of order ∑ a + 1, which is the summed order of the derivatives plus one. For example, the vector corresponding to ∂φ/∂ui⋅∂φ/∂uj involves the third-order moments (measuring skewness) of the distribution of underlying factors; it will thus not be relevant to evolution unless the distribution of underlying variation is skewed. The second thing that we can read directly from Eq. 7 is that the degree of the fitness derivative (∂jw/∂φj) is equal to the total number of phenotypic derivatives that we are considering. Thus, the degree to which ∂φ/∂ui⋅∂φ/∂uj (two first derivatives) contributes to the selection differential is determined by the second derivative of fitness with respect to phenotype, ∂2w/∂φ2.
The terms ∂iw/∂φi can be replaced by the ith-order nonlinear regression of w on φ if fitness is not a continuous function of phenotype; the theory then applies even when the regression is due to stochastic factors (i.e., drift) rather than selection.
The vectors defined by Eq. 7 give the components of the selection differential. The response, in the next generation, of the population mean to selection is a function of the selection differential and the specific patterns of inheritance of the underlying factors. If the value of each factor, ui, in offspring is related to the values of all of the underlying factors in their parents by a linear regression with random noise, then the response to selection is the sum of the Q vectors multiplied by a heritability matrix (more complicated patterns of inheritance will be treated in another paper). The total change in the vector of mean values of the underlying factors over one generation is then
 |
where ∑Q is the sum of all Q vectors and H is a heritability matrix with elements hi,j representing the partial regression of the expected value of ui in offspring on the parental value of uj. The new term, δ(ū), represents change in the mean resulting from processes other than differential reproduction, such as recombination. For underlying factors that are not heritable, such as some (but not all) “environmental” factors, we simply enter zeros in the appropriate places in the H matrix.
So far, we have considered how selection on a single trait changes the means of the underlying factors. Below, I briefly discuss the extensions to multiple traits and change in higher moments of the distribution; details of these issues will be elaborated on elsewhere.
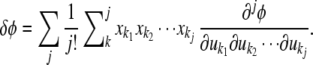
Because change in the mean of the distribution of underlying factors is a function of the other moments of the distribution (the P tensors), we would also like to know how these other moments change as well. When the notation introduced here is used, this requires only a slight modification of Eq. 7. The change attributable to selection alone (the selection differential) in the kth moment of the distribution of underlying factors is simply
 |
The only difference between Eq. 9 and Eq. 7 is the rank of the P tensor, which is now greater than the summed ranks of the D tensors by an amount k. Setting k = 1 in Eq. 9 yields Eq. 7, as it must because the mean is the first moment. Note that (from the inner product rule given above) Qk is a tensor of rank k. This makes sense; the change in the kth moments attributable to selection is written in the same form as we are using to describe the set of kth moments before selection. Thus, Q2 is the change in the variance/covariance matrix, P2.
The total response to selection for the kth moment can now be written as
 |
where ⊗kH stands for H ⊗ H ⊗ ⋯ k times. The term δ(Pk), the change in the kth moments introduced by the process of reproduction, is likely to take on a more significant role in the evolution of higher moments than it does for the change in the mean (k = 1) because processes such as segregation, recombination, mutation, etc. generally have greater power to introduce variation than to change the mean.
From Eq. 9 we can quickly see that purely directional selection (i.e., only considering the first derivative of fitness with respect to phenotype) on an uncurved landscape will not change the variance if the initial distribution is symmetrical, because Q contains the distribution tensor P3, which is zero for a symmetrical distribution. However, the same selection will introduce skewness in the next generation, because Q
 goes with P4, which is nonzero for a symmetrical distribution. Note that, as expected, stabilizing or disruptive selection will change the variance on an uncurved landscape, because Q
 contains P4.
The discussion above has focused on selection acting on a single trait (φ). The extension to selection acting jointly on multiple traits is straightforward; all of the Q vectors defined above exist unchanged, but there are now more possible combinations. For example, if selection acts jointly on two traits, φ1 and φ2, and some underlying factors influence both of these traits, then there will be new vectors corresponding to terms that involve derivatives of both traits, such as ∂φ1/∂u⋅∂2φ2/∂u2.
The Q vector corresponding to a set of derivatives like that in Eq. 6 but containing n derivatives of trait φ1 and m derivatives of trait φ2 is
 |
where ⊗D stands for the outer product over all derivatives that we are considering. For example, the vector corresponding to ∂φ1/∂u⋅∂2φ2/∂u2 is
 |
The equations presented above give a general description of evolution by selection, requiring no simplifying assumptions about the distribution of genetic and environmental factors, about how these factors influence phenotype, or about how phenotype maps to fitness (although we did make an assumption about inheritance). Given a developmental system, we could use this result to model evolution of that system under any fitness scheme and with any distribution of underlying variation.
Alternatively, we can investigate the evolutionary consequences of a particular kind of developmental interaction or a particular distribution of underlying variation by looking at the corresponding vectors. I consider four such special cases below. The first two cases show how previous results can be quickly derived from Eq. 7; the final two cases, concerning dominance and the effects of asymmetric genetic variation, are new treatments of these subjects.
Case 1: Additive Landscape, Directional Selection.
The simplest Q vector, corresponding to ∂φ/∂u, is
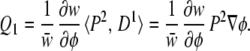 |
On an uncurved (additive) landscape with a quadratic fitness function, symmetrical distribution of underlying factors, and δ(ū) = 0, the response to selection is described completely by Δū = HQ1 (the “breeder's equation”). Substituting Eq. 13 into Eq. 8, measuring fitness relative to w̄, and noting that ∂w/∂φ⋅∇φ = ∇w and that H⋅P2 is equal to the genetic covariance matrix, G (11), yields Δū = G∇w.
Q1 captures the effects of directional selection (Fig. 1), describing the direction of evolution toward an optimal contour on the phenotype landscape. Even on a more complex landscape, Q1 is still often the principal determinant of evolution for a population far from selective equilibrium (6). Once the surface curves, however, other vectors come into play as well.
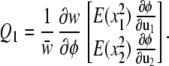
Case 2: Quadratic Landscape, Canalizing Selection.
The sensitivity of φ to underlying variation is determined by the slope of the landscape, measured by the length of the vector ∇φ (written ∥∇φ∥). The gradient of this slope is made up of terms of the form ∂φ/∂u⋅∂2φ/∂u2 (6). Here, a1 = 1 and a2 = 2, so to study the evolution of phenotypic sensitivity (or canalization) we use these values in Eq. 7 to obtain
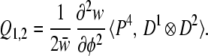 |
This is a generalization of a vector previously described in ref. 6 under more restrictive assumptions; it describes how development evolves so as to increase or decrease the sensitivity of phenotype to variation in the underlying factors (i.e., the evolution of canalization) (6). Q1,2 contains both the terms E∇φ and ∇φ∇2φ from ref. 6.
On a quadratic phenotype landscape with a multivariate normal distribution and a quadratic fitness function, we need only consider Q1 and Q1,2. Q1 moves the population to a contour corresponding to the local optimum phenotype; Q1,2 then moves the population along that contour to a point of locally minimum slope, at which point the phenotype is maximally buffered against underlying genetic or environmental variation.
To understand what Q1,2 does, note that ∂2w/∂φ2, when evaluated on an optimal phenotype contour, measures how fast fitness drops off as we move away from that contour, thus capturing the strength of stabilizing selection (11). In addition to reducing the amount of genetic variation, stabilizing selection tends to change development, by pushing the population toward less steep parts of the landscape, such that remaining genetic or environmental variation translates into minimal phenotypic variation (6, 7).
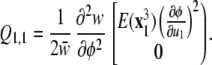
Case 3: Cubic Landscape, Evolution of Dominance.
As noted above, the second derivative with respect to a particular underlying factor, ∂2φ/∂u , measures the degree to which that factor exhibits dominance (or recessiveness) in its effects on phenotype (11). The sum of these dominance effects, ∑i(∂2φ/∂u
 ), is known as the Laplacian function, written as ∇2φ. If dominance is to evolve, then these second derivatives, ∂2φ/∂u
 , must themselves change as some underlying factor changes. We are thus concerned with the evolutionary effects of third-order interactions, measured by ∂3φ/∂u3 (recall that this includes ∂3φ/∂ui∂uj∂uk as well as ∂3φ/∂u
 ). To derive the appropriate evolution vector, we thus set a = 3 and b = 1 in Eq. 7 to get
 |
For two underlying factors, normally distributed with equal variances (σ2) and no covariance, this becomes
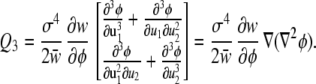 |
The vector in Eq. 16 is the gradient of the Laplacian (the sum of the dominance effects). Thus, the vector Q3 points in the direction in which the sum of dominance effects increases most rapidly.
Note that Q3 contains the first derivative of fitness with respect to phenotype. It thus shows that directional selection can alter development to change the net degree of dominance. To understand this effect, note that the net degree of dominance also relates to the degree to which a symmetric distribution of underlying factors translates into an asymmetric phenotype distribution. Increasing ∇2φ causes the distribution of phenotypic values to become positively skewed. This can be confirmed with Eq. 5 by setting all variances equal to 1 [P2(i, i) = 1] and all covariances equal to 0 [P2(i, j) = 0 for i ≠ j], then 〈P2, D2〉 = ∇2φ.
Thus, in addition to shifting the mean of the phenotype distribution, directional selection alters development to skew the distribution in the direction of increasing fitness. Note that this is different from the direct effect of selection on skewness discussed after Eq. 10. There, directional selection was reshaping the distribution of underlying variation. Eq. 16 shows that, on a cubic or higher-order landscape, directional selection also shifts the population to regions of the landscape that induce skewness in the distribution of φ.
Case 4: Asymmetric Underlying Variation.
The assumption that the distribution of underlying variation is multivariate normal (ensuring a symmetrical distribution) is central to much of quantitative genetics, and is sometimes even taken as a defining characteristic of that field (12). This assumption is not always realistic (13), so it is worth looking at what we are missing by insisting on normality.
To investigate the effects of asymmetry in the distribution of underlying variation, we look for Q vectors that contain the third moment of the distribution of us. Recall that the relevant moment for a particular vector is ∑ a + 1, or 1 greater than the summed order of the derivatives, so the only two vectors that include the third moment are Q1,1 and Q2, corresponding to the terms ∂φ/∂ui⋅∂φ/∂uj and ∂2φ/∂ui∂uj, respectively. To see one consequence of asymmetry, consider the case of complete additivity (no epistasis). Here, ∂2φ/∂ui∂uj= 0, so we need to consider only the vector Q1,1. From Eq. 7 we find this to be
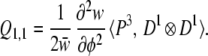 |
To see the effects of a skewed distribution, consider a case of two underlying factors with equal variances and no covariance, but with u1 being positively skewed. Here, P3(1, 1, 1) = E[x ] is nonzero but all of the other elements of P3 are zero, so we can write
 |
The only other vector that we need worry about on an uncurved landscape with quadratic fitness is Q1. Under the assumptions given above, Q1 is
 |
Q1,1 does not point in the same direction as Q1 (Fig. 2). Furthermore, it is nonzero even if there is no epistasis or dominance (because it depends only on ∂φ/∂ui) and when the population is at phenotypic selective equilibrium (because it is multiplied by ∂2w/∂φ2). Thus, with a skewed distribution of underlying variation, the underlying factors may continue to evolve even in a completely additive system that is at phenotypic equilibrium.
Fig 2.

The vectors Q1 and Q1,1 for a skewed distribution of two underlying factors and an additive phenotype landscape. The solid diagonal is the optimum phenotype, with fitness dropping off symmetrically away from the optimum.
Fig. 2 illustrates this result. Because more individuals are far from the mean on one side than on the other, and fitness drops off nonlinearly around the optimum, there is a net selective pressure pushing the population mean away from the optimum. This is countered by directional selection pushing the mean toward the optimum (Q1). If these vectors do not point in exactly opposite directions, then there is a component of evolution along the optimum phenotype contour. A similar phenomenon occurs when the fitness function is asymmetrical and Var(u1) ≠ Var(u2), as can be confirmed by examining Q1,1,1.
Applications
In addition to providing general rules for how selection acts to change development, the theory described above could be used to determine how any given selection regime would influence a particular trait if we have either (i) a theoretical model for development of the trait or (ii) data on what genetic factors contribute to variation in the trait and estimates of their direct and interaction effects.
Examples of developmental models that allow us to define the entire phenotype landscape include reaction-diffusion models of pattern formation (10) and mechanical growth models (14, 15). In these cases, the underlying factors are the model parameters, such as diffusion rate or growth rate of a tissue.
Quantitative trait locus (QTL) analysis (16) could be used to estimate the local geometry of the phenotype landscape. Each QTL would be treated as a different underlying factor, and the direct, dominance, and pairwise epistatic effects of these would provide estimates of the first and second derivatives (or regressions) of phenotype with respect to the different factors. Just given first- and second-order terms, one could construct the local quadratic approximation to the phenotype landscape. Such an approximation could be used to, among other things, determine whether the population is at or near a point of local maximum canalization, or phenotypic robustness to underlying variation. If a point of maximum canalization [at which the angle between the vectors 〈P4, D2 ⊗ D1〉 and 〈P2, D1〉 is either 0° or 180° (6)] occurs within the range of variation found in a population, it would indicate that the developmental process had been structured, in large part, by stabilizing selection.
Derivation of Eq. 5.
Define p(x1, … ,xn) as the probability density at the point (x1, … ,xn). The mean of φ is
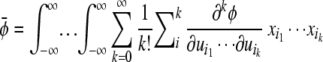 |
 |
where ∑ = ∑k(1)∑k(2) … ∑k(j). Integrating the [x1, … ,xkp(x, … ,x)] terms converts them into moments, so we can write
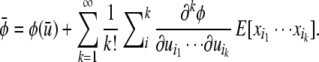 |
The second summation on the right side is just 〈Pk,Dk〉, yielding Eq. 5.
Derivation of Eq. 7.
The selection differential, S, for a particular underlying factor, ui, is given by 1/w̄ Cov(w, xi) (17), which we can write as an integral as
 |
Expanding both w(φ) and φ(u) as Taylor series (6) [letting δφ = φ − φ(ū)] yields
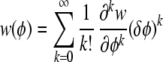 |
and
 |
Substituting Eq. into Eq. into Eq. and integrating converts the products of xs into moments, as above, but now the moments are 1 greater than the degree of the derivatives because of the extra xi (underlined) in Eq. . This gives the selection differential for underlying factor ui. Aligning all of these functions shows that the vector of selection differentials can be decomposed into a set of vectors corresponding to different combinations of phenotypic derivatives (Fig. 3). Note that all we are doing is expanding the numerator of Eq. and collecting terms. All of the resulting terms will be divided by w̄, which is a scaler and need not be expanded in the same manner.
Fig 3.

The expanded equations for S(u1) and S(u2) aligned to show how all of the elements with a particular combination of derivatives form a vector, Q.
The combinatorial term γ in Eqs. 7 and 8 combines the coefficients of the Taylor expansion of φ [=1/Πa!] and of w[=1/(∑b)!] and the number of terms that involve a particular combination of derivatives [=(∑b)!/Πb!].
Change in Higher Moments and Multiple Traits.
Change in Cov(ui,uj) is just change in the mean value of xixj, so to calculate the selection differential for the second moments, we simply substitute xixj for the underlined xi in Eq. . The same approach works for any moment.
Eq. 11 is derived by replacing Eq. with an expansion of w(φ1, φ2) in terms of both traits. The rest of the derivation is the same as for Eq. 7.
Using Regressions Instead of Derivatives.
If we replace Eq. and Eq. above with regressions we get
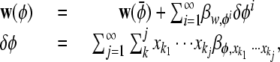 |
where βy,x represents the partial regression coefficient of y on x. The rest of the derivation proceeds as above, except that we replace the combinatorial term γ with γ′ = (∑b)!/Πb!.
Acknowledgments
I thank M. G. Rice, P. M. Magwene, and two anonymous reviewers for greatly improving the quality of this paper.
References
- 1.Wolf J. B., Brodie, E. D., III & Wade, M. J., (2000) Epistasis and the Evolutionary Process (Oxford Univ. Press, New York).
- 2.Falconer D. S. & Mackay, T. D., (1996) Quantitative Genetics (Longman, Essex, U.K.).
- 3.Cowley D. E. & Atchley, W. R. (1992) Evolution 46 495-518. [DOI] [PubMed] [Google Scholar]
- 4.Cheverud J. M. & Routman, E. J. (1996) Evolution 50 1042-1051. [DOI] [PubMed] [Google Scholar]
- 5.Wagner G. P., Booth, G. & Bagheri-Chaichian, H. (1997) Evolution 51 329-347. [DOI] [PubMed] [Google Scholar]
- 6.Rice S. H. (1998) Evolution 52 647-656. [DOI] [PubMed] [Google Scholar]
- 7.Rice S. H. (2000) in Epistasis and the Evolutionary Process, eds. Wolf, J. B., Brodie, E. D., III & Wade, M. J. (Oxford Univ. Press, New York), pp. 82–98.
- 8.Hansen T. F. & Wagner, G. P. (2001) Theor. Popul. Biol. 59 61-86. [DOI] [PubMed] [Google Scholar]
- 9.Wolf J. B., Frankino, W. A., Agrawal, A. F. & Brodie, E. D., III (2001) Evolution 55 232-245. [DOI] [PubMed] [Google Scholar]
- 10.Gilchrist M. A. & Nijhout, H. F. (2001) Genetics 159 423-432. [DOI] [PMC free article] [PubMed] [Google Scholar]
- 11.Lande R. & Arnold, S. J. (1983) Evolution 37 1210-1226. [DOI] [PubMed] [Google Scholar]
- 12.Roff D. A., (1997) Evolutionary Quantitative Genetics (Chapman & Hall, New York).
- 13.Turelli M. & Barton, N. H. (1994) Genetics 138 913-941. [DOI] [PMC free article] [PubMed] [Google Scholar]
- 14.Nijhout H. F. & Emlen, D. J. (1998) Proc. Natl. Acad. Sci. USA 95 3685-3689. [DOI] [PMC free article] [PubMed] [Google Scholar]
- 15.Rice S. H. (1998) Paleobiology 24 133-149. [Google Scholar]
- 16.Shimomura K., Low-Zeddies, S. S., King, D. P., Steeves, T. D., Whiteley, A., Kushla, J., Zemenides, P. D., Lin, A., Vitaterna, M. H., Churchill, G. A. & Takahashi, J. S. (2001) Genome Res. 11 959-980. [DOI] [PubMed] [Google Scholar]
- 17.Price G. R. (1970) Nature 227 520-521. [DOI] [PubMed] [Google Scholar]