Abstract
Electron tomograms of intact frozen-hydrated cells are essentially three-dimensional images of the entire proteome of the cell, and they depict the whole network of macromolecular interactions. However, this information is not easily accessible because of the poor signal-to-noise ratio of the tomograms and the crowded nature of the cytoplasm. Here, we describe a template matching algorithm that is capable of detecting and identifying macromolecules in tomographic volumes in a fully automated manner. The algorithm is based on nonlinear cross correlation and incorporates elements of multivariate statistical analysis. Phantom cells, i.e., lipid vesicles filled with macromolecules, provide a realistic experimental scenario for an assessment of the fidelity of this approach. At the current resolution of ≈4 nm, macromolecules in the size range of 0.5–1 MDa can be identified with good fidelity.
There is a growing awareness that it is inadequate to describe a cell as a medley of freely diffusing and occasionally colliding macromolecules (1). Cellular functions are performed by ensembles of molecules with carefully orchestrated interactions, giving rise to a stochastically variable supramolecular architecture. On this level of structure the cell is largely an uncharted territory. None of the existing imaging techniques allows to study large pleiomorphic structures such as whole cells, with a resolution of a few nanometers as required for identifying macromolecules in situ. The methods currently used in biochemistry to isolate macromolecular assemblies for in vitro studies, tend to select for abundant and stably associated complexes: rare or transient macromolecular assemblies or those held together by forces too weak to withstand the isolation procedures escape detection. Therefore, there is a great demand for methods which allow the study of macromolecular architecture in an unperturbed cellular context.
Electron tomography has unique potential to accomplish this: it is capable of providing three-dimensional (3D) images of large pleiomorphic structures at a resolution of 4–6 nm, and the prospects for further improvement are good. With the advent of automated data acquisition procedures (2), it became possible to reduce exposure to the electron beam to the extent that radiation-sensitive samples, such as biological materials embedded in amorphous ice, can be studied without apparent damage. Vitrification by rapid freezing ensures close-to-life preservation and avoids the risks of artifacts traditionally associated with chemical fixation and staining or with dehydration. Equally important, tomograms of frozen-hydrated cells represent their natural density distribution and, therefore, allow interpretation in molecular terms, uncompromised by poorly understood staining reactions yielding positive as well as negative contrast.
A cryotomogram even of a relatively small prokaryotic cell contains an imposing amount of information. It is essentially a 3D image of the cellular proteome, and it depicts the whole network of macromolecular interactions. However, new strategies and innovative image analysis techniques are needed for “mining” this information. Exploitation of the data are confronted with two major problems: cryotomograms suffer from substantial residual noise, despite optimized data acquisition schemes. “Denoising” techniques, although improving the signal-to-noise ratio, also modify the signal in a nonlinear way, precluding quantitative postprocessing (3). Moreover, the cytoplasm is densely populated (“crowded”) with molecules literally touching each other (4). It is, therefore, virtually impossible to perform a segmentation and feature extraction based on visual inspection of the tomograms, except for some large-scale structures. In principle, it would be possible to introduce electron-dense labels marking the positions of the molecules under scrutiny and facilitating their detection. However, such an approach would no longer be noninvasive, and it would be difficult, if not impossible to achieve quantitative detection. Therefore, we prefer a different strategy, namely a detection and an identification based on structural signatures. Provided that a high or medium resolution structure of the macromolecule of interest is available, this structure can be used as a template to perform a systematic search of reconstructed volumes for matching structures. Image simulation studies indicated that template matching is a feasible approach and could achieve a satisfactory level of fidelity (5). The search should be performed in an objective and reproducible manner, and therefore, it should be entirely machine based not requiring manual intervention. Ideally, the search is exhaustive, detecting all copies of the target structure, and it should be fast enough to allow the analysis of large data sets.
In this article, we describe a strategy for template matching, which is based on nonlinear cross correlation and incorporates elements of multivariate statistical analysis. The algorithm has excellent speed-up characteristics for parallel computing and, therefore, allows one to perform a complete search of tomograms without the need of data reduction by preprocessing. We apply this algorithm to tomograms of ice-embedded “phantom cells” (i.e., lipid vesicles encapsulating macromolecules), which in size and shape mimic real prokaryotic cells. The a priori knowledge of the macromolecular contents of the phantom cells allows us to validate the results and to built up confidence in this detection strategy.
Methods
Preparation of Phantom Cells: Encapsulation of Thermosomes and 20S Proteasomes in Liposomes.
Thermosomes (α-only) and bacterial 20S proteasomes were expressed in Escherichia coli and purified as described (6, 7). Stock solutions of the recombinant proteins were stored in glycerol at −20°C. Glycerol was removed by overnight dialysis, against 1 liter of 50 mM Tris buffer (pH 7.5) by using membrane with a 10-kDa cutoff. The proteasomes were then concentrated by means of an Amicon concentrator from initially 1 to 2.8 mg/ml. For protein encapsulation in liposomes, a slightly modified version of the procedure described (8) was used: a thin lipidic film was prepared by vacuum-drying 30 μl of a 5 mg/ml 1-stearoyl-2-oleoyl-sn-glycero-3-phosphocholine (Avanti Polar Lipids) solution in the round bottom of a glass vial and dissolved in chloroform. The lipid film was taken up in 20 μl of 100 mM Tris buffer, and the vesicles were swollen by vortexing at room temperature followed by sonication (10 min in a Sonorex RK 102 bath sonicator). Solution (10 μl) containing 2.8 μg/μl protein was added, and the suspension was subjected to 10 freeze/thaw cycles; samples were frozen in liquid nitrogen for 2 min and then thawed in a water bath at 30°C for 3 min. The volume of the solution was doubled by adding 100 mM Tris buffer. His-tagged macromolecular complexes not entrapped by the vesicles were removed by passing the suspension twice through an equilibrated Ni-chelate affinity chromatography column (Ni-nitrilotriacetic acid spin kid, Qiagen, Chatsworth, CA). Electron micrographs showed predominantly unilaminar vesicles with an average diameter of ≈400 nm and only a few protein complexes in the surrounding buffer medium. The phantom cell solution (5 μl) was applied to grids covered with holey carbon film. Excessive solution was blotted with filter paper, and the grids were plunged into liquid ethane (9). The vitrified samples were examined using a CM 300 transmission electron microscope equipped with a field emission gun (FEI, Eindhoven, The Netherlands) and a Gatan GIF 2002 postcolumn energy filter.
Cryo-Electron Tomography.
Tilt series were recorded at an under-focus of 8 μm at a final magnification of 43,000 by using a Gatan cryoholder (Pleasanton, CA). The pixel size corresponded to 0.72 nm. The angular range was typically from −70 to +70° with angular increments of 1.5°. The exposure time was varied according to the effective thickness of the specimen. The cumulative dose for complete tilt series was ≈6,000 e−/nm2. After alignment of the projections by means of manually selected gold markers, followed by a least-squares fit, which relates the projection images to a common origin, the reconstructions were computed on Silicon Graphics workstations by using the weighted backprojection algorithm of the em program package (10).
Results
Template Matching: General Strategy.
The identification and mapping of proteins in phantom cells can also be formulated as a problem of matching a template, ideally derived from a high-resolution structure, to an image feature, the target structure. Hitherto attempts to detect and identify macromolecular structures in reconstructed volumetric data rely almost exclusively on normalized cross-correlation of manually segmented subvolumes with low-pass filtered templates (5). Here we describe a parallelized 3D-scanning algorithm, which allows the analysis of large tomographic volumes within a reasonable timeframe. By combining cross-correlation techniques with multivariate statistical analysis (MSA) the fidelity in target detection and identification is significantly improved. Despite the fact that both techniques use the correlation principle, they exploit different object properties: cross correlation measures the relative similarity, and MSA determines the absolute differences between two objects. Finally the templates were improved by taking into account the recording conditions (transfer function of the electron microscope; missing wedge).
Creating Search Templates.
For encapsulation in the phantom cells, we have chosen two complexes with a similar overall architecture: the 20S proteasome [molecular mass, 721 kDa; diameter, ≈11.5 nm; height, ≈15 nm (11)] an intracellular protein degradation machine, and the thermosome [molecular mass, 933 kDa; diameter, ≈16 nm; height, ≈15 nm (12)], an archaeal chaperonin involved in cellular protein folding. Both complexes are assembled from rings of subunits, which jointly form toroidal structures with large internal cavities. Besides the difference in diameter, the main distinguishing feature at low resolution is the symmetry of the complexes: the proteasome is sevenfold symmetric and the thermosome eightfold. Unlike the proteasome, the thermosome undergoes large scale conformational changes in its functional cycle. Here it occurs largely in the “open” conformation, for which a crystal structure does not exist. Therefore a (less accurate) pseudoatomic structure obtained by a hybrid approach (12) was used as a template.
The pixel size of the templates must be adjusted to the pixel size of the electron microscope 3D reconstruction (www.rcsb.org/pdb/index.html). The gray value of a voxel (volume element) is obtained by summation of the atomic numbers of all atoms positioned in it. This approximation is reasonable because (i) a large number of atoms (≈30 atoms) is positioned in one voxel and (ii) proteins are composed of light atoms; hence, the electron-scattering amplitudes are assumed to be linearly dependent on the atomic number.
Optimizing the Search Strategies.
From the computational point of view two strategies can be pursued. (i) The reconstructed volume is scanned by using small boxes of the size of the target structure (real space method), or (ii) the template is pasted into a box of the size of the reconstructed volume (Fourier space method). Considering the number of operations performed in both cases, it emerges that the later approach is significantly faster (a typical acceleration value for a 3D image with 5123 voxels and a template with 443 voxels is 1,200!). Additionally, this approach allows parallelization with excellent speed-up characteristics.
Correlation with Nonlinear Weighting.
The correlation coefficient is a measure of similarity of two features e.g., a signal x and a template r. The numerator is the unnormalized part of the correlation coefficient, and the two terms in the denominator are the variances of the two correlated objects. The correlation coefficient CC between an image x and the template r, both with the same size R, expressed in one dimension is:
 |
Thereby x̄, r̄ are the mean values of the subimage and the template, respectively. To derive the local-normalized cross correlation function or, equivalently, the correlation coefficients in a defined region R around each voxel k, which belongs to a large volume N (whereby N ≫ R), nonlinear filtering has to be applied. This filtering is done in the form of nonlinear weighting, presented in Eq. 2. For the sake of simplicity, it is given for the 1D case (the extension in 3D is, in fact, trivial).
 |
where, k = 1, 2, … , N−R, and
 |
represents the local mean value of x and r̄ represents the mean value of r. The unnormalized correlation function (numerator) can easily be calculated in Fourier space, with modest computational effort. The denominator contains the normalization terms (energy terms). The term ∑ (xn − x̄(k))2 represents the local image variance. It is calculated in real space for one orientation only because the template is pasted inside a spherical (rotationally invariant) mask. The variance of the template is ∑
 r
r = ∑
= ∑ r
r , as the template is pasted into a zero field.
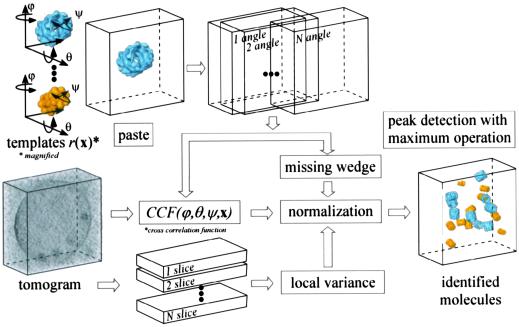
Eq. 2 describes the derivation of the correlation coefficient, for translation coordinates and for a single angle. This operation has to be performed separately for every angular orientation of the template, and the maximum correlation coefficient has to be derived. The missing wedge does not have to be considered in calculating the numerator because it is considered as a Fourier filter already applied to the data. Nevertheless, it has to be considered for the denominator; because of its anisotropy, different coefficients are filtered out in Fourier space (Parseval's theorem), and consequently, the energy of the template changes at different rotation angles. For a flow diagram, see Fig. 1.
Fig 1.
Schematic flow diagram showing the detection and identification strategy.
MSA or Cluster Analysis.
MSA can classify interimage variations in heterogeneous data sets; it allows to separate images of molecules existing in different states or varying in orientation or to remove “outliers.” In the context of our application, a classification in only two groups is required: target particles and “others.” Here we apply the MSA classification algorithm to samples characterized by high correlation coefficients and thus representing with high probability the target structure.
Electron Tomography of Phantom Cells.
The 3D reconstructions of the phantom cells show predominantly unilaminar vesicles with a diameter of 500–600 nm in the x-y plane (Fig. 2). Because of surface-tension effects, the vesicles are flattened to a thickness of 300–400 nm (see also ref. 13). Typically, the vesicles contain 100–200 protein complexes. The vesicles are either filled with 20S proteasomes (Fig. 2a), with thermosomes (Fig. 2b), or with both complexes in a nominal molar ratio of 1:1 (Fig. 2c).
Fig 2.
Central x-y slices through the 3D reconstructions of ice-embedded phantom cells filled with 20S proteasomes (a), thermosomes (b), and a mixture of both particles (c). At low magnification, the macromolecules appear as small dots.
Evaluation of the Detection and Identification Results.
In presenting the detection and identification results, we try to answer the following questions. (i) Is the detection quality in 3D sufficient to quantify the number of macromolecules contained in a given phantom cell and to distinguish them from other objects in the tomogram? A rigorous verification is not possible, because the exact numbers of the molecules and their positions are not known a priori. (ii) Once the position of a particle is determined on the basis of its structural signature, with what fidelity can it be identified? Given the random orientations of the particles, this task is not trivial, even in the absence of noise. For the phantom cells containing exclusively either 20S proteasomes or thermosomes, the statistical significance of the identification results can be assessed. This is obviously not possible for the phantom cells containing both molecular species. Nevertheless, we have applied the search algorithms to them, and we compare the molar ratio retrieved by our analysis to the biochemical input.
First, the tomograms were segmented by using automated procedures to reduce the computational efforts (14). Features not carrying relevant information, such as the holey carbon film, are removed. Then, to detect the particles, every box inside the 3D images of the vesicles was searched with the proteasome and the thermosome templates. To find the absolute maxima of the normalized cross correlation functions, the templates must be rotated around all three Eulerian angles φ, ψ, and θ with 7° increments (the sampling theorem is fulfilled for a box with 32 voxels on edge); taking advantage of the sevenfold symmetry of the templates reduces the computational efforts substantially (see below).
A critical step is the optimization of the templates with the respect to resolution. Low-pass filtering at a spatial frequency corresponding to the first zero crossing of the contrast transfer function of the electron microscope data are a pragmatic starting point. However, it does not guarantee the best possible result, because the higher frequency bands may be dominated by noise. Therefore, the templates were separated into different frequency bands [(7–5 nm)−1, (6–4 nm)−1, and (5–3 nm)−1], and the resulting normalized cross-correlation function was inspected (data not shown). In the highest frequency band, the correlation peaks were no longer significant. Therefore, the templates were filtered such that only frequency bands showing significant maxima were included. Besides optimizing the template, this procedure provides a rough estimate of the resolution obtained in the 3D reconstruction (4–6 nm). As the 3D image is searched with the templates, the highest correlation maxima for all likely positions of the macromolecules and the corresponding angular coordinates are extracted and plotted in descending order. Typically, the correlation coefficient distribution is biphasic; there is a clear turning point beyond which the correlation coefficients height drops sharply and reaches a plateau as characteristic for normally distributed noise.
The main computational effort is the calculation of the unnormalized correlation function, which has to be performed for all required combinations of the three Eulerian angles and for every template. The second task is the calculation of the local image energy, which is equivalent to a nonlinear real-space filtering and can also be performed in parallel (Fig. 1). This operation takes only a small fraction of the time needed for calculating the unnormalized correlation function. The search for a sevenfold symmetric proteasome in a 512 × 512 × 256 voxel large 3D image amounts to a computation time of ≈50 h on a single processor (Pentium III 1 GHz); this time can be divided by the number of processors used (16 in our case) resulting in ≈3 h for one 3D image and a single template.
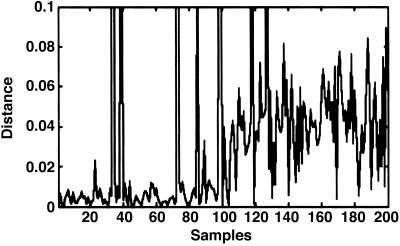
For the refinement of the detection-identification results, subtomograms around the 400 highest correlation peaks were extracted and subjected to MSA, assuming (i) that the total number of particles is <400 and (ii) that the correlation coefficients representing them were high enough to detect most of them. MSA is simplified by the fact that only a binary decision has to be made (target particles and others). The curve measuring the distance from the particle cloud center (the particle average) to all samples is presented in Fig. 3 with samples numbered according to correlation coefficient peak height (in descending order). The curve is step-shaped with the first one-half of the samples being close to the cloud centers and the second one-half at larger distances. Thus for the vast majority of samples, the result of cross-correlation analysis and MSA were in good agreement. Nevertheless MSA led to the identification of a few outliers among those samples ranked highly in the cross-correlation analysis.
Fig 3.
Result of MSA analysis. Graph representing the Euclidian distance (y axis) of each sample from the particle average (absolute similarity). Samples are ordered along the x axis with descending correlation coefficients (relative similarity). Samples with higher correlation coefficients have a smaller distance from the average compared to samples with lower correlation coefficient; thereby, a clear step is visible. Note that among the samples with high correlation values, there are four outliers, i.e., miss-hits of the cross-correlation.
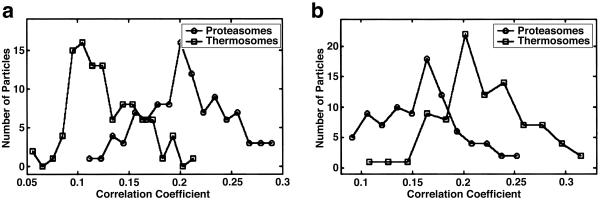
With the phantom cells containing only one molecular species, we can evaluate the performance of our approach. In the case of the phantom cells containing 20S proteasomes only, the most probable (median value) correlation coefficient for the correct 20S proteasome template is 0.21, and for the (false) thermosome, it is 0.12. Accordingly, the histograms of cross-correlation peaks are well separated (Fig. 4a). From the samples with the 110 highest correlation peaks, 6 outliers were removed after MSA (see Fig. 3). Of the remaining 104 particles, 100 were correctly identified as 20S proteasomes, whereas 4 were erroneously identified as thermosomes; this is a success rate of 96% relative to the number of detected particles. With the thermosome-containing phantom cell, the success rate is somewhat less satisfactory. Possible reasons are a lower intrinsic stability of the complex, possibly aggravated by the freezing and thawing procedure, the coexistence of different conformational states and a poorer quality of the template (see above). Here, the most probable correlation coefficient is 0.216 for the thermosome template and 0.16 for the proteasome template (Fig. 4b). Of the 140 highest correlation peaks, 88 were retained after MSA; 77 of them were identified correctly as thermosomes and 11 erroneously as 20S proteasomes, which corresponds to a success rate of 87%.
Fig 4.
(a) Histogram of the correlation coefficients of the particles found in the proteasome-containing phantom cell scanned with the “correct” proteasome and the “false” thermosome template. Of the 104 detected particles, 100 were identified correctly. The most probable correlation coefficient is 0.21 for the proteasome template and 0.12 for the thermosome template. (b) Histogram of the correlation coefficients of the particles found in the thermosome-containing phantom cell. Of the 88 detected particles, 77 were identified correctly. The most probable correlation value is 0.21 for the thermosome template and 0.16 for the proteasome template.
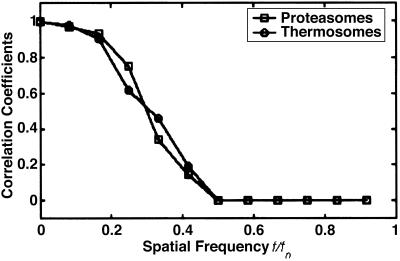
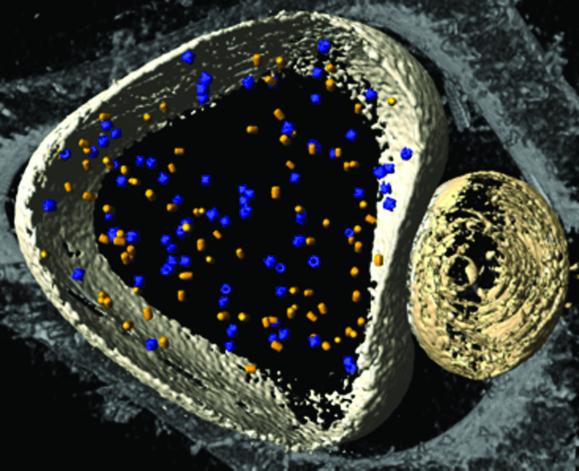
By using the coordinates obtained in the initial search, i.e., without post-alignment, we calculated averages of the particles contained in the two types of phantom cells (Fig. 5). Despite the relatively small numbers of particles, these averages are in good agreement with the template structures. When the templates were interchanged, the resulting averages were indistinct and featureless. For an assessment of resolution, Fourier shell correlation functions have been calculated for both data sets. By using a correlation coefficient of 0.5 as a standard criterion, the resolution is ≈4 nm in both cases (Fig. 6). This is not only a measure for the quality of the tomograms, it is also a measure for the accuracy in mapping the positions and orientations of the particles within the phantom cells. Finally, we have applied our detection-identification strategy to a phantom cell containing 20S proteasomes and thermosomes in a nominal molar ratio of 1:1; even though it is not possible in this case to validate the identification result, it is reassuring to identify 52% of the particles total number as thermosomes and 48% as 20S proteasomes (Fig. 7).
Fig 5.
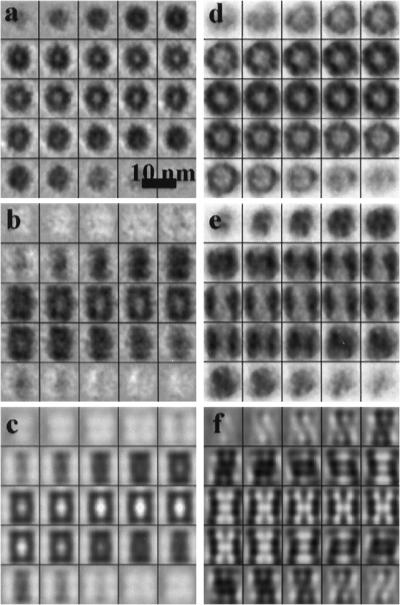
(a) Gallery of x-y slices through the average of the particles found in the proteasome-containing phantom cell. The dimensions of the particle are in good agreement with those of a 20S proteasome. The sevenfold symmetry is barely discernible, but the central cavity is clearly revealed. The corresponding average generated with a thermosome template did not show a distinct structure. (b) Gallery of y-z slices through the same particle. (c) y-z slices of the 20S proteasome template used for the detection and identification procedure. (d) Gallery of x-y slices through the average of the particles found in the thermosome-containing phantom cell. Again the size of the particles is in good agreement with the structure of a thermosome. The eightfold symmetry can be recognized in the x-y slices; the symmetry of the particle was not imposed. (e) Gallery of y-z slices through the same particle. (f) y-z slices of the thermosome template.
Fig 6.
Fourier shell correlation of the detected particles. By using a threshold of 0.5 of the cross correlation coefficients, the resolution is estimated to be at ≈0.35 of the Nyquist frequency, indicating a resolution of ≈4 nm.
Fig 7.
Volume-rendered representation of a reconstructed ice-embedded phantom cell containing a mixture of thermosomes and 20S proteasomes. After applying the template-matching algorithm, the protein species were identified according to the maximal correlation coefficient. The molecules are represented by their averages; thermosomes are shown in blue, the 20S proteasomes in yellow.
Discussion
Phantom cells are useful model systems for developing strategies and algorithms capable of detecting and identifying macromolecules in cryoelectron tomograms. They mimic prokaryotic cells in size and shape and provide a realistic experimental scenario in terms of data quality. Because the molecular contents of the phantom cells are known, it is possible to assess the fidelity of the detection and identification, which, in turn, allows improving and fine-tuning the algorithms. The results obtained in this study are encouraging and consistent with image simulation experiments indicating that, even at the present resolution of 4 nm, it is possible to identify macromolecular complexes in the size range of 0.5–1 MDa with satisfactory fidelity.
The search of the tomograms is performed in a fully automated fashion and does not require manual interference. Therefore, it is objective and reproducible. It is computationally demanding, but given the 1/M scalability of the algorithm, it is the number of processors (M) at one's disposal which determines the time it takes to search a tomogram. One major difference between phantom cells and real cells is the molecular crowding inside the latter. In principle, the performance of the algorithm should not be affected by the crowding. Nevertheless some modifications might be necessary: currently, the template is embedded in a sharply delimited sphere with ≈80% of the pixels carrying information; 20% is “void volume” but these pixels contribute to the cross-correlation coefficients. This is not a problem as long as the molecules in the tomograms are not “touching” each other. If they are, more elaborate nonspherical masks should be used including only information carrying pixels related to the template.
Two factors will ultimately determine the limits of what can be achieved by template matching: the resolution of the tomograms and the quality of the search template. Ideally, a template is used, which is as similar as possible to the target structure in the 3D image to be searched, i.e., it should take into account all factors which degrade or convolute the tomograms (contrast transfer function, missing information because of incomplete sampling, etc.) Because it is difficult, if not impossible to create such an ideal template, it might be worth to explore the usefulness of different techniques, which are independent of these parameters, either as an alternative to the deterministic methods described in this communication or to be used in combination with them.
Acknowledgments
We thank Drs. Alasdair Steven and Vladan Lusic for critically reading the manuscript.
Abbreviations
MSA, multivariate statistical analysis
References
- 1.Alberts B. (1998) Cell 92, 291-294. [DOI] [PubMed] [Google Scholar]
- 2.Koster A. J., Grimm, R., Typke, D., Hegerl, R., Stoschek, A., Walz, J. & Baumeister, W. (1997) J. Struct. Biol. 120, 276-308. [DOI] [PubMed] [Google Scholar]
- 3.Frangakis A. S., Stoschek, A. & Hegerl, R. (2001) IEEE Trans. Biomed. Eng. 48, 213-222. [DOI] [PubMed] [Google Scholar]
- 4.Ellis R. J. (2001) Trends Biochem. Sci. 26, 597-601. [DOI] [PubMed] [Google Scholar]
- 5.Bohm J., Frangakis, A. S., Hegerl, R., Nickell, S., Typke, D. & Baumeister, W. (2000) Proc. Natl. Acad. Sci. USA 97, 14245-14250. [DOI] [PMC free article] [PubMed] [Google Scholar]
- 6.Gutsche I., Mihalache, O. & Baumeister, W. (2000) J. Mol. Biol. 300, 187-196. [DOI] [PubMed] [Google Scholar]
- 7.Mayr J., Seemüller, E., Müller, S. A., Engel, A. & Baumeister, W. (1998) J. Struct. Biol. 124, 179-188. [DOI] [PubMed] [Google Scholar]
- 8.Monnard P. A., Berclaz, N., Conde-Frieboes, K. & Oberholzer, T. (1999) Langmuir 15, 7504-7509. [Google Scholar]
- 9.Dubochet J., Adrian, M., Chang, J., Homo, J.-C., Lepault, J., McDowall, A. W. & Schultz, P. (1988) Q. Rev. Biophys. 21, 129-228. [DOI] [PubMed] [Google Scholar]
- 10.Hegerl R. (1996) J. Struct. Biol. 116, 30-34. [DOI] [PubMed] [Google Scholar]
- 11.Löwe J., Stock, D., Jap, B., Zwickl, P., Baumeister, W. & Huber, R. (1995) Science 268, 533-539. [DOI] [PubMed] [Google Scholar]
- 12.Nitsch M., Walz, J., Typke, D., Klumpp, M., Essen, L. O. & Baumeister, W. (1998) Nat. Struct. Biol. 5, 855-857. [DOI] [PubMed] [Google Scholar]
- 13.Grimm R., Typke, D., Bärmann, M. & Baumeister, W. (1996) Ultramicroscopy 63, 169-179. [DOI] [PubMed] [Google Scholar]
- 14.Frangakis A. S. & Hegerl, R. (2002) J. Struct. Biol. 138, 105-113. [DOI] [PubMed] [Google Scholar]


