

Abstract
A phenomenological model with time-varying excitation and inhibition was developed to study possible neural mechanisms underlying changes in the representation of temporal envelopes along the auditory pathway. A modified version of an existing auditory-nerve model [Zhang et al., J. Acoust. Soc. Am. 109, 648–670 (2001)] was used to provide inputs to higher hypothetical processing centers. Model responses were compared directly to published physiological data at three levels: the auditory nerve, ventral cochlear nucleus, and inferior colliculus. Trends and absolute values of both average firing rate and synchrony to the modulation period were accurately predicted at each level for a wide range of stimulus modulation depths and modulation frequencies. The diversity of central physiological responses was accounted for with realistic variations of model parameters. Specifically, enhanced synchrony in the cochlear nucleus and rate-tuning to modulation frequency in the inferior colliculus were predicted by choosing appropriate relative strengths and time courses of excitatory and inhibitory inputs to postsynaptic model cells. The proposed model is fundamentally different than others that have been used to explain the representation of envelopes in the mammalian midbrain, and it provides a computational tool for testing hypothesized relationships between physiology and psychophysics.
I. INTRODUCTION
Physiological responses to amplitude-modulated (AM) stimuli have provided a basic description of how controlled fluctuations in a signal’s temporal envelope are represented at several levels of the auditory pathway. The same class of stimulus has also been used extensively in psychophysical experiments, as a convenient means to investigate perceptual temporal processing capabilities and limitations. Sinusoidally amplitude-modulated (SAM) sounds are often used in both approaches because they can be described by a limited parameter set, and they are logical links between simple (tonal) stimuli and more spectro-temporally complex and biologically relevant signals such as speech. The abundance of data describing neural responses to SAM stimuli provides an opportunity to thoroughly test specific hypotheses concerning the physiological mechanisms that underlie envelope coding. Parallel psychological studies offer chances to better understand neural correlates of AM perception.
The current study uses computational modeling as a tool to quantitatively test realistic neural encoding hypotheses that may be used by the auditory system to code envelope modulations. Model responses will be directly compared to those reported in physiological studies of periodicity coding in the periphery, brainstem, and midbrain (auditory nerve, cochlear nucleus, and inferior colliculus, respectively). Some specific hypotheses that this approach will allow us to test are that (1) simple interactions between inhibition and excitation can give rise to modulation-tuned cells, and (2) physiologically realistic model parameter variations can account for the diversity of physiological AM responses. The broad goals of this study are to gain insights on coding strategies. As a result, the model is phenomenological in nature; we have not tried to include details of the underlying biophysical mechanisms in the model structure. Limitations of the predictive capabilities of the model we present here can provide useful clues for developing future experiments.
A. Extracellular physiological responses to AM stimuli
Typically, neural responses to AM stimuli are quantified based on (1) average firing rate and (2) synchrony (Goldberg and Brown, 1969) to the modulation period. These metrics are usually reported as a function of the stimulus modulation frequency (f m), resulting in a physiological rate modulation transfer function (rate-MTF, average rate versus f m), or a synchrony MTF (sync-MTF, synchrony versus f m). For reference, a half-wave rectified sinusoid and a pure sinusoid (i.e., the envelope of a fully-modulated stimulus) are described by synchronization coefficients (SCs) of 0.784 and 0.5, respectively (or modulation gains of +3.9 and 0 dB for a fully modulated stimulus).
At the level of the auditory nerve (AN), the most complete set of data describing responses to SAM tones is that of Joris and Yin (1992) in the cat. High-characteristic frequency (CF) AN sync-MTFs for low to moderate stimulus levels are uniformly low-pass, with corner frequencies between 600 Hz and 1 kHz and peak modulation gains from 0 to +4 dB. Modulation corner frequencies are positively correlated with CF, indicating that temporal responses are dependent on the spectral interactions between AM signal components. Synchrony increases significantly with increasing stimulus modulation depth in AN fibers, and there is an optimal (moderate) stimulus level that elicits the most synchronous response (Joris and Yin, 1992; Smith and Brachman, 1980; Cooper et al., 1993). High-spontaneous-rate (SR) fibers, which make up the majority of the AN-fiber population (Liberman, 1978), show little or no variation in rate with f m, while average rates of most low-SR fibers tend to drop slightly as f m increases (Joris and Yin, 1992). Encoding of AM in the AN is therefore widely assumed to be based on a temporal code, with stimulus modulation information carried in the periodicities of the poststimulus time (PST) histogram. However, in contrast to psychophysical measures, which are robust across level, AN PST histograms tend to flatten out at high stimulus levels, causing decreased response synchrony (Joris and Yin, 1992; Smith and Brachman, 1980). Central processing either recovers the diminished synchrony information at higher stimulus levels (possibly by combining information across audio frequencies), or uses some other feature of the AN neural response to encode envelopes.
Neurons in the cochlear nucleus (CN) can receive convergent information from multiple AN fibers, as well as from collaterals and descending inputs (both excitatory and inhibitory) (e.g., Ryugo and Parks, 2003; Schofield and Cant, 1996). The resulting MTFs are more complex than those measured in the AN. Sync-MTFs can be either low-pass or band-pass, and synchrony to the modulation period is often enhanced relative to AN fibers [Rhode and Greenberg (1994), cat; Frisina et al. 1990, gerbil]. Corner frequencies of CN sync-MTFs can be considerably lower than those measured in high-CF AN fibers, and are generally not correlated with the unit’s CF. Most rate-MTFs remain relatively flat at the level of the ventral CN (VCN), with the exception of onset-choppers, which can exhibit rate-tuning to f m (Rhode and Greenberg, 1994). Also, some AM response characteristics (i.e., shape of MTF and maximum synchrony values) are correlated with tone-based physiological characterizations of individual neurons (Rhode and Greenberg, 1994). For instance, many onset and chopper units are characterized by sync-MTFs that change from low-pass at low SPLs to band-pass at high SPLs (Frisina et al., 1990; Rhode and Greenberg, 1994). Existing physiological models of AM processing rely on chopper cells in the VCN (e.g., Hewitt and Meddis, 1994); in the current study, we simulate bushy cells (which would be classified as primarylike or primarylike-with-notch based on their responses to tones) at the level of the VCN as an alternative pathway along which temporal envelope information could flow. The specific AM response characteristics that we have achieved in our physiologically realistic model bushy cells are (1) enhanced synchrony and (2) lower sync-MTF corner frequencies (re: AN inputs; Frisina et al., 1990; Rhode and Greenberg, 1994). The low-pass to band-pass transition in the shape of the sync-MTF as sound level increases was not modeled, as this transition is not evident in VCN bushy cells (Frisina et al., 1990; Rhode and Greenberg, 1994).
The inferior colliculus (IC), like the CN, is an almost obligatory synapse between lower brainstem nuclei and higher processing centers. Interactions between ascending and descending inputs potentially complicate the AM response properties of IC neurons. A systematic and thorough investigation of gerbil IC cell responses to SAM tones provided by Krishna and Semple (2000) has refined earlier work described by Langner and Schreiner (1988) in the cat. IC rate-MTFs often indicate rate tuning to specific modulation frequencies, and many cells exhibit suppressive f m regions (Krishna and Semple, 2000). IC units are often highly synchronized to f m, with most sync-MTFs taking low-pass or band-pass shapes. Best modulation frequencies (BMF, f m eliciting largest response) based on rate are significantly lower (most are less than 100 Hz) than those observed in the VCN or AN based on synchrony. Increasing stimulus modulation depth generally increases the firing rate near rate-BMF, while changing the overall stimulus level has complicated and less systematic effects on rate-MTF shape (Krishna and Semple, 2000).
B. Intracellular responses and studies of inhibition
Inhibition could be an integral component of the neural processing that underlies the apparent transition from a temporal AM code in the periphery to a rate-based scheme at higher levels (Grothe, 1994; Faure et al., 2003). Several aspects of the inhibitory circuitry in the VCN and IC have been previously investigated. In a pharmacological study of neurons in the chinchilla VCN, Caspary et al. 1994 selectively blocked inhibitory inputs and measured response areas (RAs) before and after neurotransmitter blockade. They found that response rates were most often affected near or at CF (~85% of neurons), and concluded that GABA and/or glycine-mediated inhibitory inputs are tonotopically aligned with excitatory inputs onto the same cell. Same-frequency inhibition and excitation (SFIE) is also suggested by morphological labeling studies, which indicate that the likely sources of inhibitory input (dorsal CN and superior olivary complex) are matched in frequency with their postsynaptic targets in the VCN (e.g., Wickesberg and Oertel, 1988).
Other studies have focused on understanding the time courses of inhibitory and excitatory influences in the VCN. Intracellular recordings in the brain-slice preparation of excitatory and inhibitory postsynaptic potentials (EPSPs and IPSPs) in response to current injections at the stump of the AN have provided details of these time courses that would not be possible to infer using extracellular methods (Oertel, 1983). Specifically, EPSPs of bushy cells in the VCN can be described as alpha functions with a time constant of approximately 0.5 ms, and IPSPs are slower, with time constants on the order of 2 ms. Differences in latencies between excitatory and inhibitory influences in these studies are also informative and consistent with the fact that all AN fibers are excitatory: inhibitory component onsets often begin 1–2 ms after excitation is observed and are therefore assumed to be disynaptic (Oertel, 1983). These observations can be built in to our model of neural processing between AN fibers and VCN neurons.
A similar framework of evidence exists for SFIE circuitry in the IC. Neurons originating in the dorsal nucleus of the lateral lemniscus (DNLL) and projecting to the IC provide one source of GABA-ergic inhibitory input to the central nucleus of the IC (ICc) (Schneiderman et al., 1988). Palombi and Caspary (1996) selectively blocked GABA in the ICc, and showed that rate increases occur mainly near CF in the absence of inhibition, similar to findings in the VCN. Brain slice intracellular recordings have suggested that synaptic modification of incoming spike trains in the IC lasts significantly longer than in the VCN (e.g., Wu et al., 2002). Carney and Yin (1989) used extracellular responses of IC cells to clicks presented binaurally with an interaural time difference (ITD) to infer durations of inhibitory influence. They recorded from cells with a wide range of long-lasting inhibitory components that sometimes suppressed firing for tens of milliseconds following an initial click response.
C. Modeling
Previous modeling efforts of physiological AM coding have used a coincidence-detection mechanism at the level of the model IC cells to generate band-pass rate tuning for modulation frequency (Langner, 1981; Langner and Schreiner, 1988; Hewitt and Meddis, 1994). The elements of Langner’s model, which is focused on pitch encoding instead of pure AM, are only loosely based on physiology. Neurons are hypothesized to perform a cross-correlation analysis between spike trains synchronized to the modulation frequency and the carrier frequency, with small delays between the inputs (Langner, 1981). The model loses its appeal, however, because it is only plausible at low carrier frequencies where phase-locking to the stimulus fine-structure is observed in inputs to the IC (<800 Hz, Yin, 2002).
The Hewitt and Meddis model for AM sensitivity is built around a population of intermediate “chopper” model VCN cells, whose parameters are adjusted to provide a set of envelope-locked inputs to postsynaptic model IC cells. In the framework of their model, AM-synchronized spikes in the VCN tend to fire at intervals related to their chopping period, and stimuli with AM fluctuations that are close in frequency to this inherent chopping elicit a more highly synchronous response. The synchrony-BMF (equivalently, the chopping period) of a model chopper cell is adjusted by varying a potassium-conductance time constant (i.e., Hewitt and Meddis, 1994) in a point-neuron model. One key assumption of this model structure is that the AM rate tuning observed in IC cells is determined by the synchrony tuning properties of VCN choppers that provide inputs to the IC. As a result, the range of rate-BMFs in model IC cells is determined by the range of synchrony-BMFs in their VCN inputs. By allowing the VCN potassium-conductance time constant to vary from 0.2 to 7 ms, Hewitt and Meddis (1994) showed responses from AM-tuned model cells with BMFs between 50 and 400 Hz. One issue for the Hewitt and Meddis model is the disparity in the ranges of VCN chopper synchrony-BMFs (~150– 700 Hz; Rhode and Greenberg, 1994; Frisina et al., 1990) and IC cell rate-BMFs (~1 – 150 Hz; Krishna and Semple, 2000).
Physiological work in the auditory system has suggested a possible role for envelope-locked inhibition in AM processing (i.e., Krishna and Semple, 2000; Caspary et al., 2002), but the details of such a mechanism have not been agreed upon or quantitatively tested. We used the results from a modeling study in another modality as a starting point for the development of a new model that incorporates phasic inhibition. Krukowski and Miller (2001) implemented a model of temporal frequency tuning in the visual system in which inhibition dominates over excitation. These model neurons respond only to stimuli with envelope fluctuations because excitation and inhibition can occur out of phase with one another when the stimulus is modulated. Applied to the auditory system, we will show that an implementation of this mechanism can explain the transition from a temporal AM code in the periphery to a rate-based code at the level of the IC. A similar mechanism has recently been used to explain modulation coding at the level of the auditory cortex (Elhilali et al., 2004).
In summary, the existence of physiological “modulation filters” has been experimentally shown. The details of the relationship between behavioral and neural AM responses remain unclear. We propose that one approach towards bridging this gap is to compare the predicted responses of a physiologically realistic computational model to actual AM responses. The specific model we have chosen to evaluate uses the convergence of long-duration inhibition and short-duration excitation as a mechanism for extracting modulation information from spike trains in lower levels.
II. METHODS
A. Auditory-nerve model
A new version of the physiologically based auditory-nerve (AN) model developed by Zhang et al. 2001 and modified by Heinz et al. 2001b was used to simulate responses at the first level of neural coding. The modifications outlined below were included specifically to improve responses to AM tones, but they did not significantly affect responses to simple stimuli; model responses to tones are similar to those described in Heinz et al. (2001b, their model #3). Model code is available at web.syr.edu/~lacarney
1. New signal path filters
Effects of basilar membrane compression and two-tone-suppression were omitted in the modified linear version of the Zhang et al. 2001 AN model used in the present study. Spontaneous rate was adjusted as in the Heinz et al. 2001b model to match the values described in the physiology, where available. We chose to use linear signal-path filters because of unresolved limitations of the nonlinear AN models at high CFs and high SPLs (discussed later). Tuning of the signal-path gammatone filters was adjusted based on properties of AN fibers in response to AM CF tones. Specifically, CF-dependent bandwidths of the sharp linear AN model (Heinz et al., 2001b, model #3) were changed to account for the corner frequencies measured in low-pass sync-MTFs. For CFs above 1 kHz, the filter time constant was specified by
| (1) |
where the value of Q10 is estimated from a linear fit of measured values of Q10 (Miller et al., 1997; see Zhang et al., 2001). The value described here, which is an estimate of tuning at intermediate SPLs, is half the τnarrow described in previous versions of the AN model (which was estimated from AN responses at low sound levels). The resulting high-CF model sync-MTFs have significantly higher corner frequencies than previous AN model versions, and are very close to those described in the cat by Joris and Yin (1992). For very low CFs (<1 kHz), the equation for τnarrow described by Zhang et al. [2001, their Eq. (4)] is sufficient to account for the sync-MTF corner frequency in the small amount of data available from low-CF AN fibers.
2. Modified synapse model
Previous AN models have used a simplified implementation of Westerman and Smith’s (1988) time-varying three-store diffusion model (Carney, 1993; Zhang et al., 2001; Heinz et al., 2001b) to describe the transformation of a stimulus-driven voltage to an instantaneous firing rate at the output of the IHC-AN synapse. Only the immediate permeability is assumed to depend on the acoustic stimulus (through the inner-hair-cell voltage). The parameters of these models are determined based on desired properties of high-CF PST histograms, including spontaneous rate (SR), steady-state discharge rate, and onset adaptation time constants at high sound levels. Once the initial parameters are set, the immediate permeability described in Westerman and Smith (1988) determines the (level-dependent and time-varying) effective time courses of the two adaptation processes. High-level stimuli result in smaller rapid and short-term time constants.
There is a basic limitation of these prior implementations that directly affects envelope-locked responses to AM tones. Recovery from prior stimulation (offset adaptation) in the models has two components and follows time courses that are set by the rapid and short-term components of onset adaptation. As a result, the final output of the previous synapse model (the product of an immediate permeability and concentration) recovers too quickly after tone stimulation. Physiological AN recordings (Smith, 1977; Smith and Zwislocki, 1975; Harris and Dallos, 1979) suggest that fibers with medium- or high-spontaneous rates recover more slowly than onset time constants would dictate, with a level-dependent dead time and a time constant longer than that of short-term onset adaptation.
Zhang (2004) has developed a strategy that effectively avoids these constraints on the synapse model. A SR-dependent shift is added to the desired rate response before implementing the difference equations that describe the diffusion model. After the differential equations are simulated on the up-shifted version of the presynaptic response, the resulting output is shifted back down by the same amount and half-wave rectified (so the final synapse output is never negative). By including the shift, offset recovery is effectively slowed because the early offset response is set to zero when the down-shifted output is half-wave rectified. The modification can be physiologically interpreted as a constant neurotransmitter leak in the synaptic cleft (Zhang, 2004).
For all of the simulations presented here, the shift (which was the same in amplitude for the upward shift as for the downward shift) was equal to twice the desired SR of the fiber. This value was a compromise: larger shifts further increase the modulation gain, but also caused systematic variations in average firing rate with modulation frequency. A SR-independent shift was also considered, but steady-state rates of low-SR fibers at high sound levels were unrealistically high when a high shift value (e.g., shift = 120 sp/s) was used for all model AN fibers. Figure 1 illustrates the effect of the 2 × SR shift on a response to a 200-ms (8-ms cos2 rise/ fall time), 25-dB SPL pure tone presented at CF for an 8-kHz AN model fiber with a SR of 50 sp/s. The final synapse outputs are shown for the current model version, as well as for the Zhang et al. 2001 AN model (their complete nonlinear model with compression and suppression). The effect most relevant to increasing modulation gain can be seen after the tone offset, where the response is suppressed below SR for about 150 ms in this example. If a fully modulated AM tone is thought of as a train of tone pips, the corollary effect would be to suppress firing in the envelope valleys or troughs, which is observed physiologically (Joris and Yin, 1992).
FIG. 1.
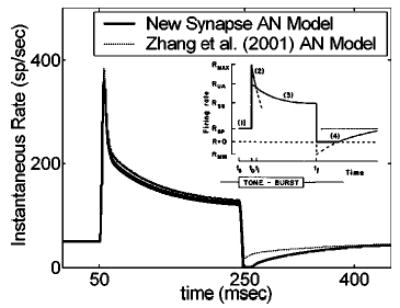
AN model pure-tone responses (main panel) and schematic of AN responses from Harris and Dallos’ (1979) physiological forward masking study (inset; with permission). Modification of the IHC-AN synapse portion of the Zhang et al. 2001 AN model resulted in longer (and more physiologically realistic) offset suppression. Model waveforms are responses of an 8-kHz CF fiber to a 25-dB SPL pure tone at CF.
3. Input and output signals and other details
Inputs to the AN model were the instantaneous pressure waveforms of the stimuli in Pascals. The corresponding output was the time-varying discharge rate of the synapse model, rAN(t), in spikes/second. Characteristic frequency and spontaneous rate were adjusted and matched to single-fiber physiology (where available) to generate an individual fiber response. Simulation sampling rates varied between 75 and 200 kHz, depending on the CF of the AN fiber and the stimulus frequency. Stimuli had 25-ms rise-fall times, and both carrier and modulator were started in sine phase, unless explicitly stated otherwise. Detailed responses of a previous version of this phenomenological model have been compared to physiological data describing AN responses to tones, noises, and clicks (Zhang et al., 2001). One goal of the current study was to compare responses of the new AN model to general trends and absolute values of envelope synchrony and average firing rate observed in cat AM physiology (neglecting the initial onset response, as in Joris and Yin 1992).
B. Model cochlear nucleus cells
Some basic physiological observations are incorporated into the generation of model responses at the first levels of AN fiber convergence. First, membrane and channel properties of bushy cells in the VCN have the effect of low-pass filtering incoming spike trains (Oertel, 1983). VCN postsynaptic potentials were approximated by alpha functions of the form P(t) = te−t/τ, where values of τ were chosen based on Oertel’s intracellular recordings of bushy cells. Inhibitory influences are slower and longer-lasting (i.e., IPSP time constants are longer, on the order of 2 ms) than excitatory input influences, which can be characterized by EPSP time constants of about 0.5 ms. Computationally, smoothed inputs to the model VCN cells were obtained by convolving rAN(t) with the appropriate alpha function. The relative strengths of inhibition and excitation were adjusted by varying the area under the alpha function (or, equivalently, the gain of the low-pass filter pass-band). At this first level of convergence, the strength of excitation was assumed to be greater than that of inhibition. Because all AN fibers are excitatory, model inhibitory inputs to VCN cells were also slightly delayed (DCN= 1ms) relative to the excitation, to simulate a disynaptic delay along an intrinsic inhibitory pathway (Oertel, 1983).
Another physiologically based observation that is included in the simulated VCN cells is that many neurons in the anteroventral cochlear nucleus (AVCN) receive same-frequency inhibitory and excitatory (SFIE) inputs (see Sec. I). This mechanism was realized simply by subtracting a membrane-modified, inhibitory AN response from a corresponding smoothed excitatory AN response with the same CF. In terms of the AN input rAN(t) and the approximated post-synaptic potentials, the VCN response is given by
| (2) |
where different time courses of inhibition and excitation (τexc= 0.5 ms, τinh= 2 ms) are represented in the two convolution (*) terms, and same-frequency inhibition and excitation SFIE) is included by using the same AN instantaneous discharge rate for both inputs. The resulting difference was half-wave rectified so that negative rates caused by the subtraction were represented by zero firing in the resulting model VCN cell instantaneous firing rate. The scalar SCN,inh sets the strength of inhibition relative to the excitation. The scalar A was taken into account to achieve realistic average rates; this value was set to 1.5 for the simulations presented here.
C. Model inferior colliculus cells
Responses of model VCN cells were used as inputs to higher levels of convergence in a hypothetical processing cascade. Synaptic modifications, input frequency convergence, and relative delays between the inputs were implemented as in the first level of processing. Mathematically, Eq. (2) was used to derive IC model responses, with rAN(t) being replaced by rCN(t), and A = 1. One important difference between the two levels of processing was the strength of inhibition: model IC neurons had stronger inhibition than excitation (SIC,inh>1), while model VCN cells were dominated by their excitatory inputs (SCN,inh<1). As a result, the IC model cell responded strongly only when the timing of the two inputs was such that a peak of excitation coincided with a valley of the envelope-locked inhibition.
Because the time courses of inhibitory influences at the level of the IC are more variable than those observed in the VCN (e.g., Carney and Yin, 1989), the inhibitory time constant in the second level of model cells was systematically varied. Consequences of this variation are described in Sec. III. The single inhibitory time constant of the model should not necessarily be interpreted as a simple time constant of a single IPSP, but rather as an effective time constant describing the overall time-course of the inhibitory influence (which could be, for example, a train of IPSPs rather than a unitary IPSP). A schematic diagram of the two-layer SFIE model is shown in Fig. 2.
FIG. 2.
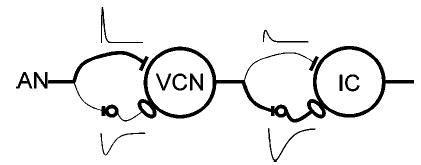
Schematic diagram of the same-frequency inhibition and excitation (SFIE) model. A single model AN fiber provides the postsynaptic cell with both excitatory and inhibitory input, via an inhibitory interneuron. The thickness of the lines corresponds to the relative strength of the inhibition and excitation at each level. Alpha functions representing the assumed membrane and synaptic properties are also shown.
III. RESULTS
A. AN model responses
Joris and Yin’s (1992) systematic study of cat AN responses to SAM tones provides an excellent template for detailed evaluation of AN model responses. Physiological and model AN sync-MTFs and rate-MTFs of high-CF fibers are stereotyped in their shape: sync-MTFs are low-pass at low to moderate signal levels with − 3-dB cutoffs between 600 and 1000 Hz, and rate-MTFs of high-SR AN fibers show little variation in average rate with f m. Also, both model and actual AN responses at low f m can be more modulated than a half-wave rectified version of the stimulus (modulation gain>0).
Physiology and model predictions for a single high-CF AN fiber are illustrated in Fig. 3 in terms of modulation gain, average firing rate, and PST histogram shape. Model fiber parameters were matched to the physiological fiber description (CF and SR), and stimulus conditions (carrier frequency and relative level) were also duplicated. The main effect of modifying the AN-IHC synapse portion of the AN model was to increase the envelope synchrony (or equivalently, modulation gain) to physiologically realistic values. Previous AN model versions had maximum modulation gains of approximately − 5 dB at low SPLs [the full nonlinear version of the Zhang et al. 2001 model predicts a SC of 0.29 for a fully modulated stimulus], while the version described here has a peak gain of + 2.5 dB (SC = 0.66). The low-pass shape and corner frequency of the sync-MTF are consistent with the data [Fig. 3(a)]; the flat rate-MTF and steady-state average rate values are also well-predicted [Fig. 3(b)]. Shapes of the PST histograms are not strictly determined by measurements of synchrony and rate; however, the model responses are also qualitatively similar in PST shape to those measured physiologically [Fig. 3(c)].
FIG. 3.
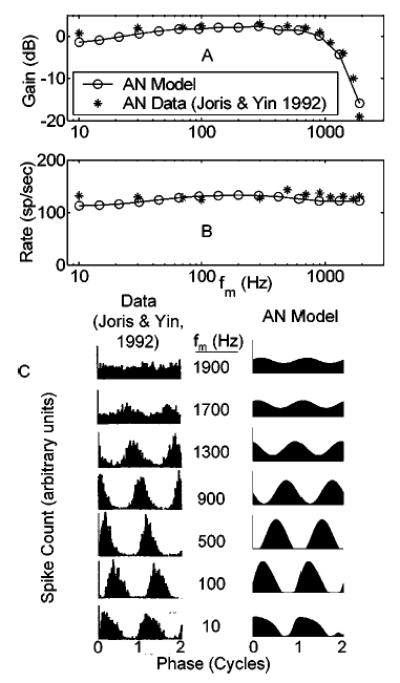
Comparison of model and actual modulation transfer functions and period histograms. (a) Physiological and model AN sync-MTFs for a high-CF fiber. (b) Rate-MTFs for the same fiber (onset response neglected). (c) Period histograms for the actual AN fiber (left column) and model AN fiber with matched parameters. Two cycles of the response are shown starting at a zero sine phase point of the modulating waveform. CF=21 kHz; SR=61 sp/s. Stimulus carrier frequency=CF; SPL set at ~20 dB above rate threshold. Cat data from Joris and Yin (1992, their Fig. 10; with permission).
Another characteristic of AN fiber responses to AM can be observed by varying the modulation depth (m) at a given f m. The effects of changes in m are important to test with the model for our long-term purposes because psychophysical data is often reported in terms of a threshold m that is always less than m = 1 (i.e., less than 100% stimulus modulation). Physiological and modeled response synchrony and modulation gain are plotted against stimulus modulation depth for a high-CF, high-SR AN fiber in Fig. 4. Predictions based on the modified synapse AN model fit the data quite well, and are a significant improvement over the previous model version. In addition, the model responses (not shown) are very similar in shape to the PSTs illustrated in Joris and Yin (1992, their Fig. 1). For direct evaluation of the contribution of the new version of the AN-IHC synapse model, predictions are also shown using the same presynaptic model structure in combination with the Zhang et al. 2001 synapse model. Synchrony using the new “constant neurotransmitter-leak” model is significantly enhanced over the previous version for all modulation depths.
FIG. 4.
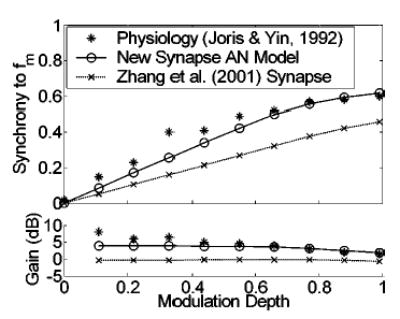
Changes in synchronization to the modulation period with stimulus modulation depth for model and actual AN fibers [physiological responses from Joris and Yin, (1992), their Fig. 1(b); with permission]. Predictions from two AN model versions are shown; the version with the modified synapse model will be used for all subsequent simulations. Fiber parameters: CF = 20.2 kHz; SR = 53 sp/s. Stimulus parameters: carrier frequency = CF; f m = 100 Hz; SPL set to elicit the maximum synchrony value (20 dB SPL for the model fiber; 49 dB SPL for the actual fiber).
In addition to comparing measured and simulated response characteristics for different modulation frequencies and depths, we have also evaluated the level-dependence of the AN-model synchrony and rate. Physiologically, modulated synchrony-level functions (synchrony versus level for a given f m) are non-monotonic, with a peak at some best modulation level (BML, usually 10–20 dB above rate threshold) over a wide range of modulation frequencies (Joris and Yin, 1992). The AN model used in this study is characterized by the same level-dependent synchrony trends. Figure 5 compares physiology (unconnected symbols) and simulations (connected symbols) of responses to four combinations of fiber CF, SR, and stimulus f m in terms of average rate (*) and synchrony (○) to the modulation period. The general shapes of both rate-level (monotonic and saturating) and sync-level functions (non-monotonic) are accurately predicted by the AN model. Thresholds in the model fibers are set near 0 dB SPL, regardless of SR; as a result, the simulated low-SR rate-level and sync-level functions (lower two panels) are shifted toward lower sound levels. Peak firing rates are higher in the AN model low-SR and low-CF groups in comparison to Joris and Yin’s (1992) physiological results [panels (a), (c), and (d) of Fig. 5]. This is an inherent property of the model, and it is one that we chose not to focus on in our efforts to match the AM response properties. However, the rates are within a reasonable range when population data from both Joris and Yin (1992) and Liberman (1978) are considered. Low-SR model fibers exhibit slightly lower peak envelope synchrony and broader synchrony-level functions than the actual AN fibers [panels (c) and (d)]. The high-SR, high-CF model fiber shown in panel (b) of Fig. 5 is accurate in terms of its rate threshold, dynamic range, maximum rate, and synchrony-level function. It is this class of AN fibers that is described most thoroughly in Joris and Yin’s study, and it is responses from these fibers that were used to test and validate the AN model.
FIG. 5.
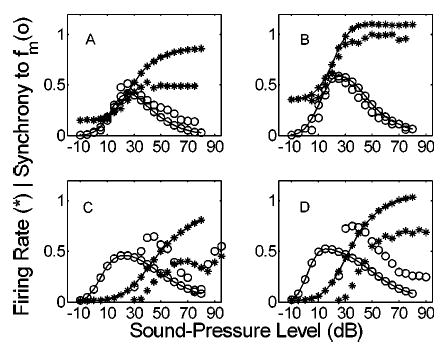
Comparison of actual (unconnected symbols) and model (connected symbols) rate-level (*) and synchrony-level (○) functions for four combinations of AN parameters. Firing rates are normalized by 200 sp/s. CF, SR, and fm: (a) 510 Hz, 30 sp/s, 10 Hz, (b) 12 kHz, 71 sp/s, 100 Hz, (c) 710 Hz, 2 sp/s, 10 Hz, (d) 8.1 kHz, 2.6 sp/s, 100 Hz. The carrier frequency was set to the fiber’s CF. Physiological responses replotted from Joris and Yin (1992, their Fig. 5; with permission).
Joris and Yin (1992) also quantified the relationship between a fiber’s sync-MTF corner frequency and its tuning-curve bandwidth. High-frequency AN fibers have broader tuning than low-CF fibers, which allows more AM sideband energy to pass for relatively higher stimulus f m. Accordingly, − 3-dB cutoffs increase with CF. Interestingly, at very high CFs (>15 kHz in the cat) the positive relationship between CF and cutoff frequency saturates (the corner frequency becomes independent of CF). The AN model predicts similar trends, although the absolute values of the model cutoff frequencies are slightly lower than the average physiologically measured values (but model values lie within the scatter of the data; Joris and Yin, 1992, their Fig. 14). Figure 6 shows examples of model sync-MTFs at three CFs along with those from comparable AN fibers (from Joris and Yin, 1992).
FIG. 6.
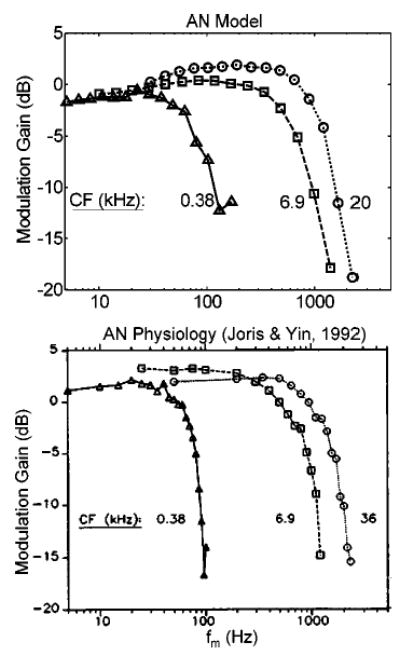
Sync-MTFs (m = 0.99) for three fibers with different CFs: AN model and actual data [from Joris and Yin (1992), their Fig. 13a; with permission]. SR of each fiber; triangles: 24 sp/s; squares: 6.3 sp/s; circles: 39 sp/s. Model SPL = 24 dB.
B. Model CN cell responses
Figure 7 illustrates simulations of the effect of the convergence of slow inhibition and fast excitation with the same CF on a postsynaptic model VCN cell. The model’s synchronous response to SAM is affected in two ways that are consistent with physiology (Rhode and Greenberg, 1994; Frisina et al., 1990): (1) synchrony is enhanced with respect to AN inputs at low modulation frequencies, and (2) the upper frequency limit of phase-locking to the envelope is lower in the model VCN cells. The model parameter that most directly contributes to these response characteristics is the strength of inhibition (relative to excitation). MTFs for model VCN cells with a range of inhibitory to excitatory strength ratios between 0 and 0.6, along with the input AN MTFs, are shown in Fig. 7. Average rates decrease for model cells with stronger inhibition (for all f m), and rate-MTFs can exhibit a shallow peak for the model cells receiving the strongest inhibitory inputs (lower panel). Rates in VCN model cells with no inhibition are higher than the AN inputs because the excitatory alpha-function area (or low-pass filter gain) was greater than unity (area = 1.5). Also, as inhibition increases, VCN sync-MTFs systematically have higher corner frequencies, and maximum modulation gain values increase (upper panel).
FIG. 7.
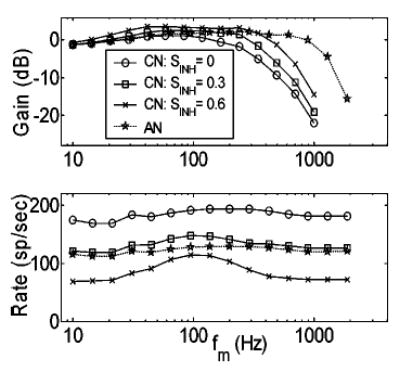
Sync-MTFs (top panel) and rate-MTFs (bottom panel) for an 8-kHz CF AN model fiber, and three model VCN cells with varying strengths of inhibition (re: strength of excitation). Model AN fiber SR = 50 sp/s. Model VCN τexc = 0.5 ms; τinh = 2 ms; DCN = 1 ms. Stimuli were presented at 24 dB SPL.
What is the specific mechanism that gives rise to enhanced envelope synchrony in the model VCN cells? The effect can be understood by considering the differences in assumed membrane and/or channel properties for inhibition and excitation. Stronger and faster excitatory inputs interact with weaker and slower inhibitory inputs in ways that depend on the stimulus f m to produce the final model VCN cell response. For low and intermediate modulation frequencies (i.e., 10 Hz< f m<200 Hz), the more sluggish inhibitory inputs (τinh = 2 ms) are not able to follow the fast fluctuations in the AN responses as faithfully as the excitatory inputs (τexc = 0.5 ms). Higher synchrony results because excitation dominates for a more focused time interval (near the modulation period onset). For f m>200 Hz, the slow inhibitory component acts to effectively remove a DC offset from the excitatory component. This causes higher modulation gain values and higher sync-MTF cutoff frequencies for model cells that receive stronger inhibition. VCN sync-MTF corner frequencies are lower than those in the model AN fibers (regardless of the relative strength of inhibition) because they are limited by the excitatory synaptic properties that modify the ascending VCN model cell inputs.
For nearly equal-strength inhibition and excitation (CN Sinh>0.6, not shown), model VCN rate-MTFs are more band-pass in shape than has been reported in most physiological studies of bushy cells. When the overall strengths of the cell’s two inputs are nearly the same, there is a narrow range of f m for which the temporal interactions between inhibition and excitation cause high firing rates in the postsynaptic cell. At very low f m and very high f m, the two inputs are similar in their ability to keep up with the stimulus modulations, resulting in a low discharge rate since inhibition is nearly as strong as excitation. To avoid band-pass rate-MTFs, the strength of inhibition in the model VCN bushy cells was set to 0.6 when they were used to provide inputs to model IC cells.
C. Model IC cell responses
1. MTFs and effect of varying time constants and delays
A second layer of model cells receiving inhibition-dominated SFIE inputs is hypothesized to represent IC units that integrate information from many convergent inputs. The most basic results observed in the model responses are that IC cells fire only over some narrow range of f m (i.e., they are rate-tuned to f m), and their AM responses are highly synchronized to the modulation period. This is consistent with physiological responses in the gerbil (Krishna and Semple, 2000) and cat (Langner and Schreiner, 1988). The BMF of a given IC model cell is determined mainly by the time constants of the inhibitory and excitatory influences: fast-acting inputs give rise to high BMFs; slower time constants result in lower BMFs. We constrain the inhibitory τ to always be equal to or longer than the excitatory τ when generating model responses. The range of BMFs that can be obtained by varying these parameters over a physiologically realistic range is illustrated in Fig. 8. Each rate-MTF describes the responses of a model cell with a given combination of τIC,exc and τIC,inh. The same model AN fiber and VCN cell provided inputs to each of these model IC cells (i.e., rate-tuning in the IC is not determined by synchrony-tuning in the VCN). Absolute rate (top panel) and normalized rate-MTFs (bottom panel) are shown. Note that a wide range of rate-BMFs (~40– 120 Hz) can be obtained with a fixed τIC,exc, and variation of τIC,inh from 1 to 7 ms. Tuning to even slower envelope frequencies is achieved by assuming longer time constants (cell A in Fig. 8, with τIC,exc = 5 ms and τIC,inh = 10 ms, is tuned to ~20 Hz). The upper limit of model BMFs (~120 Hz) is consistent with that observed in the gerbil IC (Krishna and Semple, 2000). This boundary is determined in the model by restricting the time constants of the excitatory and inhibitory inputs to be longer than 1 ms (Wu et al., 2002; Carney and Yin, 1989).
FIG. 8.
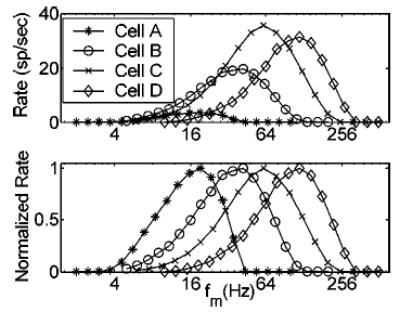
Absolute and normalized rate-MTFs of four model IC cells with different combinations of excitatory and inhibitory time constants. τIC,exc and τIC,inh; cell A: 5 ms and 10 ms; cell B: 2 ms and 6 ms; cell C: 1 ms and 3 ms; cell D: 1 ms and 1 ms. Common parameters to all four cells: AN CF = 8 kHz; AN SR = 50 sp/s; VCN τexc = 0.5 ms; VCN τinh = 2 ms; DCN = 1 ms; SCN,INH = 0.6; DIC = 2 ms; SIC,INH = 1.5. Stimulus carrier frequency = AN CF; m = 1; SPL = 24 dB.
The exact f m that elicits the largest rate-based model response can be further adjusted by changing the delay between excitation and inhibition. When the inhibitory delay is kept within a physiologically realistic range (<10 ms), rate-based BMF shifts at low modulation frequencies are relatively small but systematic. Longer delays result in a shift of rate-MTF peaks to lower fm and increases in rate at BMF. Short delays between inhibition and excitation cause maximal overlap in the envelope-locked inputs, and thus decrease the overall firing rate and increase the cell’s BMF. Grothe (1994) has proposed a scheme for AM tuning in the bat medial superior olive (MSO) that uses a pure delay between inhibition and excitation to set the model cell’s BMF. We chose not to rely on such a mechanism because of one specific consequence that is not observed in the physiology: a multi-peaked rate-MTF results, with rebounds in rate at envelope frequencies that are multiples of the “fundamental” f m. This problem is avoided in the current model by the use of strong inhibition that is desynchronized at high f m.
2. Effect of varying stimulus modulation depth
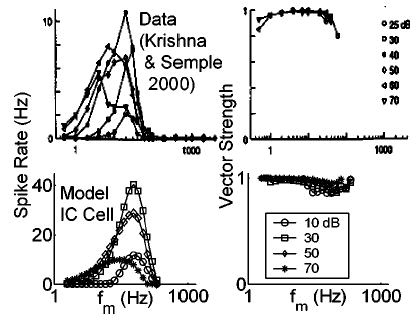
Responses of model IC cells change for stimuli with different modulation depths in a way that is consistent with physiological observations (Krishna and Semple, 2000). Figure 9 shows an example of physiological MTFs (top panels, from Krishna and Semple, 2000) and model MTFs (bottom panels); the parameter in the figure is stimulus m. Firing rate increases with modulation depth, most significantly near BMF. Synchrony saturates rapidly as m is increased. The possible shapes of the model IC sync-MTFs are limited because a narrow range of f m’s elicits a high enough rate to compute a significant SC. Envelope locking persists in the response at modulation rates well above the high-frequency rate-MTF cutoff frequency. Each of these effects of varying m has been observed in physiological recordings (e.g., Krishna and Semple, 2000). One clear discrepancy between model and data is in the lack of a synchrony roll-off in the model at high f m. This is due to the fact that the model is deterministic, and any response will be synchronized, even at very low rates. The addition of some amount of noise (i.e., jitter in the discharge times) to the model IC cell output would avoid the artificially high synchrony values for conditions with very low average rates (e.g., at high modulation frequencies for the model cell in Fig. 9). Figure 9 also illustrates the stereotyped shapes of model cell rate-MTFs. The high-frequency roll-off is more abrupt than the low-frequency transition on a logarithmic frequency axis, and rates go to zero at very high f m . These features have also been described in gerbil IC recordings, and have been hypothesized (but not tested) to be caused by inhibitory inputs (Krishna and Semple, 2000).
FIG. 9.

Effect of varying stimulus m on actual (upper panels) and model (lower panels) IC unit MTFs. Model and stimulus parameters were the same as those describing cell C in Fig. 8. Rate-MTFs are shown on the left; sync-MTFs on the right. Gerbil physiological data from Krishna and Semple (2000, their Fig. 2C; with permission).
3. Effect of varying stimulus SPL
IC cell rate-MTFs can change with sound level (e.g., Krishna and Semple, 2000). This point has important implications for relating physiological responses to psychophysical measures, which are almost always robust across a wide range of SPLs. Predicted rate-MTFs based on the IC model cells also depend on SPL in ways broadly consistent with some of the single unit physiology [although the physiological level-dependence can be very different from cell to cell (Krishna and Semple, 2000)]. Figure 10 compares responses from one cell in Krishna and Semple’s (2000) study to those of the model IC cell illustrated in Fig. 9. Several trends are predicted by the model. (1) The largest peak rate response is elicited by a medium-SPL stimulus (40 dB in the physiology; 30 dB in the model). (2) The rate-BMF shifts to lower f m with increasing sound level. (3) The bandwidth of the rate- MTF tends to increase with sound level. (4) Synchrony remains relatively high despite these changes in the rate-based characterization.
FIG. 10.
Effect of varying stimulus SPL on actual (upper panels) and model (lower panels) IC unit MTFs. Model and stimulus parameters were identical to those described in Fig. 9 (with m = 1). Data from Krishna and Semple (2000, their Fig. 5D; with permission).
4. Model mechanisms and PSTs
In the present model, mechanisms underlying specific features of model rate-MTFs and sync-MTFs can be determined directly by considering the intermediate waveforms that shape the model IC cell response. At low f m, neither the inhibitory nor the excitatory inputs are significantly modified by their low-pass membrane and synaptic properties. That is, inputs to the model IC cell are able to closely follow the VCN response. As a result, excitation and inhibition are overlapping for most of the stimulus cycle (depending on their relative delays), and since these cells are inhibition-dominated, the average firing rate is very low. For stimulus frequencies near the cell’s BMF, interactions between inhibition and excitation become more interesting. The slower inhibitory inputs start to lose much of their AC response, and the weaker excitation will cause higher postsynaptic rates when its stimulus-locked peaks line up in time with the stronger inhibitory “valleys.” At high f m, the inhibitory inputs are nearly tonic, and the excitatory components are also smoothed by their effective synaptic and membrane filtering properties. In the extreme, at very high f m, both inputs to the model IC cell are time-independent. The result is little postsynaptic activity because inhibition dominates, and temporal interactions can no longer provide stimulus-locked firing in the final response.
Despite the good agreement between available physiology and model IC cell responses in terms of their rate- and sync-MTFs, the predictive power of the model structure in describing PST histogram shapes has not yet been demonstrated. Examples of physiological (from Langner and Schreiner, 1988) and modeled temporal responses for a single IC unit at various modulation frequencies (with a stimulus rise-fall time of 5 ms) are shown in Fig. 11. The model cell was chosen such that the rate-BMF was similar to that of the physiological cell (BMF = 60 Hz). A strong onset is present in both data and model responses, regardless of the stimulus f m. This feature is not part of any of the model quantifications presented up to this point (all rate and synchrony calculations were made in the steady-state portion of the response). In the model, the onset response is caused by the relative sluggishness of the inhibitory input with respect to excitation. These model cells would be classified as onset units in terms of their pure-tone responses.
FIG. 11.
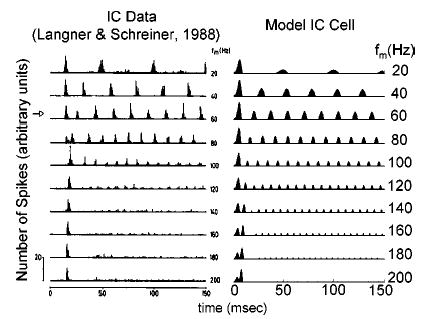
Comparison of actual (left) and model (right) IC cell PST histograms for a range of stimulus f m. Model parameters were the same as the cell illustrated in Fig. 10 (with SPL=20 dB). Physiological PSTs from Langner and Schreiner (1988, their Fig. 2, unit IC115; with permission).
Other subtle similarities are present that are not reflected in rate- or sync-MTFs. The slow build-up at high f m after onset that is observed in IC physiology (e.g., at f m = 120– 200 Hz) is captured by the model. This phenomenon is a result of the slow inhibitory input in the model cell, which determines how quickly the cell response reaches steady-state. Also, two peaks in the onset response at certain modulation frequencies are present in both data and model (caused by fixing the starting phase of the signal modulation). In general, the qualitative similarities in the PST histograms suggest that the simple mechanism proposed here can predict more than gross rate and synchrony changes with modulation frequency.
D. Summary
The apparent transition from a temporal AM code in the periphery to a rate-based scheme at the level of the IC is predicted by a simple neural encoding hypothesis. Specifi-cally, two levels of convergent slow inhibition and fast excitation reproduce several established response characteristics of VCN and IC neurons, at least qualitatively. The most fundamental difference between the processing strategies at the two levels is the strength of the inhibitory input relative to the excitatory component. A summary of the responses of two-stage SFIE is shown in Fig. 12.
FIG. 12.

Summary of the effects of SFIE on rate- and sync-MTFs for two model layers of convergent excitation and inhibition. Model and stimulus parameters match those of the previous three figures (with SPL = 24 dB and m = 1).
IV. DISCUSSION
Several important features of neural AM encoding in the auditory brainstem and midbrain were predicted by the cascaded convergence of same-frequency inhibitory and excitatory inputs with the physiologically realistic time courses described in this study. A modified version of the Zhang et al. 2001 AN model that is consistent with physiological recordings in the cat provided inputs to this processing mechanism. At the level of the AN, changes in envelope synchrony and rate with modulation frequency and depth were accurately captured by the new AN model. A single layer of convergent inhibition and excitation yielded model responses with increased synchrony relative to AN firing patterns, similar to trends seen in VCN bushy cell physiology. In a second level of convergent SFIE, model cell responses were rate-tuned to stimulus modulation frequency by allowing the inhibitory inputs to be stronger than the corresponding excitatory inputs. Rate tuning to f m has been reported in both gerbil and cat IC (i.e., Krishna and Semple, 2000; Langner and Schreiner, 1988).
A. Limitations of the AN model
A significant shortcoming of the AN model used in the present study becomes apparent in its response to high-SPL, high-f m AM stimuli, which elicit unrealistically high synchrony in the model. This results in strongly band-pass model AN sync-MTFs at high sound levels. Evaluation of the model in this study was limited to low and moderate SPLs, to avoid using physiologically inconsistent AN responses as inputs to higher processing centers. A possible source for this discrepancy is the speed and strength with which the onset properties of the AN model act on a cycle-by-cycle basis. At high levels and low f m, there is a clear onset component with each AM stimulus cycle, but synchrony is reduced compared to lower-SPL stimuli because the remainder of the cycle histogram (after the onset) is saturated. In contrast, high-SPL, high-f m SAM stimuli cause a highly synchronized response that is completely dominated by the strong onset, with no saturated portion of the cycle histogram. It should be noted that at very high f m (i.e., f m > 1000 Hz), envelope synchrony still rolls off at high SPLs; it is for stimulus f m between 20 and 500 Hz that the time course of onset adaptation causes the most significant increase in synchrony (that has not been observed physiologically). A clear direction of future work is to understand and possibly modify the role that the synapse model onset components play in shaping the high-SPL AM cycle histograms.
This inconsistency between the model and data at high levels is tempered by the fact that the AN model fibers always have a pure-tone rate threshold of approximately 0 dB SPL, while real AN fibers generally have thresholds that vary between fibers. Much of the AN physiology has been collected at levels that are on the steepest part of the rate-level function, usually 10–15 dB above rate threshold. The AN model can therefore be considered to provide physiologically realistic AM responses at levels below pure-tone rate saturation.
B. Model VCN cells: Alternative mechanisms
Synchronous AM response features in the VCN are diverse and correlated with PST classification type (Rhode and Greenberg, 1994). Part of the diversity is a result of the fact that VCN neurons receive different numbers of inputs that act with various strengths and latencies. Despite the additional complications, some broad observations are clear: (1) VCN sync-MTFs can have low-pass or band-pass shapes, (2) sync-MTFs have lower corner frequencies than high-CF AN fibers, and (3) rate-MTFs remain relatively flat [with the exception of onset choppers (Rhode and Greenberg, 1994)]. We have shown that a simple two-input model bushy cell that receives membrane and synapse-modified inhibition and excitation with the same CF can exhibit low-pass or weakly band-pass sync-MTFs with corner frequencies lower than the model AN fiber sync-MTFs, depending on the relative strengths of excitation and inhibition. Also, the firing rate of the model VCN neurons is nearly independent of modulation frequency when the inhibitory strength is less than 50%–60% of the excitatory strength. Allowing the inhibition to become stronger than this threshold results in tuned rate-MTFs. Interestingly, Joris and Yin (1998) show that many of the globular bushy cells in their population exhibit systematic variation in average rate with f m (their Fig. 13C).
The observation that model cells could be rate-tuned in the first layer of convergent SFIE leads to an important question: is the cascade of two postsynaptic model cells necessary to explain the transition from a synchrony code to a rate code? While the two-layer structure is not strictly required to understand rate tuning, it is useful as a tool to understand the flow of information along the auditory pathway. Our physiologically based approach incorporates empirical data into the details of the model at each level of processing. By using data obtained from bushy cells in the VCN, we have described an alternative envelope information pathway that does not require populations of VCN choppers to understand the synchrony-to-rate transformation. However, interpretation of the current model structure is complicated by the fact that bushy cells in the VCN do not send axons directly to the IC; they project to the superior olivary complex (e.g., Oliver and Huerta, 1992). Neurons in the lateral superior olive (LSO) have low-pass sync-MTFs, similar to those of AN fibers and VCN bushy cells (Joris and Yin, 1998). The stereotypical rate-MTF in the LSO is also low-pass in shape, which is in contrast to the flat (all-pass) rate-MTFs measured in LSO afferents (Joris and Yin, 1998). However, the corner frequencies of monaural LSO rate-MTFs are significantly higher than those found in the IC; this suggests that the transformation that occurs at the level of the LSO is not crucial to generating the details of rate tuning in the IC. Physiological data in response to monaural AM tones in the medial superior olive (MSO) of cat and gerbil are not available.
Is the SFIE convergence mechanism for generating increased synchrony and band-pass sync-MTFs a unique solution? No; it is only a possible explanation for the physiological observations. While our model is physiologically plausible, it is also phenomenological in nature. An alternative hypothesis with significant physical support is that a coincidence-detection mechanism could also enhance envelope synchrony. A recent modeling study has suggested that VCN neurons could act as cross-frequency coincidence detectors on a shorter relative time scale (Heinz et al., 2001a; Carney et al. 2002), and work continues to investigate the possibility that slower fluctuations could also be modified by such a mechanism in a manner consistent with physiology.
C. Model IC cells
The SFIE model described in this study is attractive for several reasons. Its primary appeal lies in its simplicity: a population of model IC cells, each receiving only two inputs, can span a wide range of rate-based BMFs. Individual cell rate tuning is determined primarily by differences in synaptic dynamics between excitatory and inhibitory inputs, and rate-MTFs can be further adjusted by varying the inhibitory delay. For the basic model with a single excitatory input and a single inhibitory input, overall rates are lower in cells with low BMFs, and peak rates drop again at high BMFs; this trend could be adjusted simply by changing the number of inputs to each cell. In other words, there is no inherent relationship between maximum rate and BMF. The high-synchrony and low-pass or all-pass sync-MTF features of the model cells are also consistent with physiological measurements in units that respond strongly at the onset of pure-tone stimulation.
It is worthwhile to consider some details of the shapes of simulated IC cell rate-MTFs, and the model features that underlie them. One such detail is the sharp roll-off on the high-frequency side of the rate-MTF, and the more gradual rate increase with f m on the low-frequency end. Both stereotyped traits of the model cells are attributable to the strength and speed of inhibition relative to excitation. For f m well above BMF, both inhibition and excitation tend towards constant (tonic) values because membrane and synaptic time constants limit the extent to which envelope locking can occur. Since inhibition is stronger in this level of the model, zero firing is observed on the output for the high-f m stimulus condition. For very slow amplitude fluctuations, the overall rate is low because both inhibitory and excitatory components can accurately follow the modulations of the VCN cell response, resulting in a high degree of overlap between the two inputs. As f m is increased, the temporal interactions gradually change until an optimal frequency causes phase-locked excitatory peaks to line up in time with inhibitory valleys (at BMF).
A more quantitative way to compare rate-MTF shapes between model cells is to measure their Q value (Q = BMF/bandwidth at ½ of the cell’s peak rate). For the parameter spaces investigated, model cells were all observed to have rate-tuning Q values ⩽ 1.2 at low to medium SPLs, with most measurements near 1. Although the metric was not reported in Krishna and Semple (2000), approximate calculations using their published rate-MTFs suggest similar physiological values. In the present model, effectively broader tuning can be caused by allowing inhibitory synaptic filtering properties to be significantly different than those of excitatory inputs (τIC,inh ≫ τIC,exc). If we assume that the excitatory time constant is relatively fast and consistent across cells, this mechanism would predict that cells with lower BMFs would also have broader tuning.
Krishna and Semple (2000) found that a large proportion (~45%) of IC neurons exhibited a suppressive region in the rate-MTF. That is, the firing rate was depressed over some narrow range of f m relative to rates at higher and lower stimulus modulation frequencies. The model presented here does not directly predict such a trend, but a simple scheme can be imagined in which suppressive regions can be created. Rate-tuned collaterals or ascending inputs [possibly from the VNLL (Batra, 2004)] converging on a unit in the IC could provide inhibitory inputs to a postsynaptic cell. Krishna and Semple (2000) point out that for such a scheme to work, the net inhibitory effect would simply be proportional to the mean spike rate of the inputs. Another population of cells in the IC is characterized by a low-pass to band-pass sync-MTF shape transition with increasing SPL that is similar to some onset and chopper responders in the VCN (i.e., Krishna and Semple, 2000). The model presented here does not predict such a transformation; all model IC cell responses are highly synchronized to the modulation period, even at high SPLs.
Sinex et al. 2002 described recordings in the chinchilla IC in response to mistuned complex tones that have beating periodicities which are not present in the stimulus envelope. They put forth a simplified processing model that could account for some of these periodicities by combining information across different CFs. The model presented here would not predict such interactions, because model inputs are all from a single CF. Given the complex connections (both ascending and descending) at the level of the IC, it is reasonable to assume that information is integrated across different frequencies. We have restricted excitatory and inhibitory inputs on a postsynaptic cell to have the same CF in an effort to keep the model as simple as possible, but this approach could be extended to include model IC cells that receive inhibition and excitation with different CFs.
D. Future directions
This study was a necessary first step in an effort to quantitatively relate physiological responses to human psychophysical performance in AM detection tasks. Recent psychophysical models of AM perception assume that a population of hard-wired filters tuned to f m provides information about a signal’s temporal envelope to higher processing centers (e.g., Dau et al., 1997; Ewert et al., 2002). This “modulation filterbank” model structure is fundamentally different than that of previous models which assume that the net effect of central processing is to low-pass filter, or smooth, the envelope (e.g., Viemeister, 1979). The model IC cells presented here can be thought of as a physiological implementation of a modulation filter, and work continues to understand the relationship between model responses and perceptual modulation tuning.
Long-duration inhibitory influences in the model IC cells may also provide a physiologically realistic mechanism for understanding psychophysical forward-masking phenomena. Offset suppression measured in AN fibers is too short to account for the time course of forward masking in humans (Smith, 1977; Harris and Dallos, 1979; Plack and Oxenham, 1998). Preliminary work suggests that the same f m-tuned model IC cells presented here may effectively suppress responses to a probe signal that is presented after a masking stimulus for significantly longer masker-probe intervals. A physiological framework that integrates our understanding of modulation detection and forward masking is appealing.
An important test of the AN model will be to implement the newly derived sharp human filter bandwidths (Shera et al., 2002; Oxenham and Shera, 2003), and observe the effects on AM response properties. Sharper filters will result in lower envelope synchrony for a given carrier frequency, as AM sidebands will be more strongly attenuated. In this respect, some of the modulation encoding ability seems to be lost with narrower-band filters. From a different perspective, a sharp peripheral filter will result in significant modulation of wideband stimuli, emphasizing fluctuations in the filter’s frequency pass band. Taken together, these observations illustrate the importance of using many stimuli and response quantifications when evaluating the performance of any model (especially one that simulates a highly nonlinear system such as the auditory system).
The main focus of future work on model VCN neurons will be to see if alternative processing mechanisms (i.e., coincidence detection) could also increase synchrony and underlie band-pass sync-MTFs. Coincidence detection can be approximated computationally using the simplified approach described in this work by taking the product of multiple input instantaneous firing rates as the response of a postsynaptic cell. Integrate-and-fire model neurons based on dynamic channel properties would provide a higher-order approximation of information integration at the level of VCN cells, which receive multiple excitatory AN inputs, as well as slower inhibitory inputs. Physiological observations that estimate the frequency range of a cell’s inputs, as well as the number of inputs, would be very useful in building a realistic VCN model cell.
Our model of processing in the IC should be extended to include cells that receive and integrate excitatory and inhibitory inputs with different CFs. This may allow the model described here to predict responses in the IC to mistuned complex tones [as in Sinex et al. 2002] by combining resolved spectral information from different frequency bands. We should also consider whether long-lasting inhibition can be modeled simply with a single long IPSP, as opposed to a train of shorter and weaker IPSPs. This could be accomplished by directly comparing responses to the two IPSP configurations. Since the computational cost of convolution is quite high, carrying out this experiment should also motivate the development of a faster, frequency-domain algorithm that performs the same function of convolution in the time domain. Another possible direction for studying the fundamental mechanism of an additive combination of envelope-locked excitation and inhibition with different time courses and relative strengths would be to simplify the structure of the model presented here (as in Krukowski and Miller, 2001); a reduced parameter space might allow for more systematic variation of the key components of the second-order (IC) model cells.
The techniques we have used to simulate the effects of membrane and synaptic filtering provide a first approximation of how information in the central auditory system may be modified as it ascends. While the computational methods described here are physiologically based, they are by no means exhaustive. Perhaps most importantly, we assume that both inhibitory and excitatory contributions to a postsynaptic model cell are simply proportional to the instantaneous firing rate of a lower-level input. One way to refine the model would be to take into account the effects of membrane and synapse properties on a spike-by-spike basis. Implementing a conductance-based integrate-and-fire model neuron would allow us to include other realistic properties of cells in the auditory brainstem and midbrain. For example, some neurons may act as coincidence detectors; low-threshold potassium channels have been implicated as candidate mechanisms that could allow for such interactions between sequential inputs (Svirskis and Rinzel, 2003). Due to computational demands, it was not possible to include these effects in the present version of the model, but this is another clear direction for future work.
Acknowledgments
We thank Xuedong Zhang for his help in implementing modifications to the AN model. Ray Meddis and an anonymous reviewer provided useful comments on an earlier version of this paper. This research was supported by NIH-NIDCD R01-01641 and the Jerome R. and Arlene L. Gerber Fund.
References
- Batra R. “Responses to amplitude-modulated tones of neurons in the ventral nucleus of the lateral lemniscus of the unanesthetized rabbit,”. Assoc Res Otolaryngol Abstr. 2004;27:914. [Google Scholar]
- Carney LH. “A model for the responses of low-frequency auditory-nerve fibers in cat,”. J Acoust Soc Am. 1993;93:401–417. doi: 10.1121/1.405620. [DOI] [PubMed] [Google Scholar]
- Carney LH, Yin TCT. “Responses of low-frequency cells in the inferior colliculus to interaural time differences of clicks: Excitatory and inhibitory components,”. J Neurophysiol. 1989;62:144 –161. doi: 10.1152/jn.1989.62.1.144. [DOI] [PubMed] [Google Scholar]
- Carney LH, Heinz MG, Evilsizer ME, Gilkey RH, Colburn HS. “Auditory phase opponency: A temporal model for masked detection at low frequencies,”. Acust Acta Acust. 2002;88:334 –347. [Google Scholar]
- Caspary DM, Palombi PS, Hughes LF. “GABAergic inputs shape responses to amplitude modulated stimuli in the inferior colliculus,”. Hear Res. 2002;168:163–173. doi: 10.1016/s0378-5955(02)00363-5. [DOI] [PubMed] [Google Scholar]
- Caspary DM, Backoff PM, Finlayson PG, Palombi PS. “Inhibitory inputs modulate discharge rate within frequency receptive fields of anteroventral cochlear nucleus neurons,”. J Neurophysiol. 1994;72:2124 –2132. doi: 10.1152/jn.1994.72.5.2124. [DOI] [PubMed] [Google Scholar]
- Cooper NP, Robertson D, Yates GK. “Cochlear nerve fiber responses to amplitude-modulated stimuli: Variations with spontaneous rate and other response characteristics,”. J Neurophysiol. 1993;70:370–386. doi: 10.1152/jn.1993.70.1.370. [DOI] [PubMed] [Google Scholar]
- Dau T, Kollmeier B, Kohlrausch A. “Modeling auditory processing of amplitude modulation. I. Modulation detection and masking with narrow-band carriers,”. J Acoust Soc Am. 1997;102:2892–2905. doi: 10.1121/1.420344. [DOI] [PubMed] [Google Scholar]
- Elhilali M, Fritz JB, Klein DJ, Simon JZ, Shamma SA. “Dynamics of precise spike timing in primary auditory cortex,”. J Neurosci. 2004;24:1159–1172. doi: 10.1523/JNEUROSCI.3825-03.2004. [DOI] [PMC free article] [PubMed] [Google Scholar]
- Ewert SD, Verhey JL, Dau T. “Spectro-temporal processing in the envelope-frequency domain,”. J Acoust Soc Am. 2002;112:2921–2931. doi: 10.1121/1.1515735. [DOI] [PubMed] [Google Scholar]
- Faure PA, Fremouw T, Casseday JH, Covey E. “Temporal masking reveals properties of sound-evoked inhibition in duration-tuned neurons of the inferior colliculus,”. J Neurosci. 2003;24:3052–3065. doi: 10.1523/JNEUROSCI.23-07-03052.2003. [DOI] [PMC free article] [PubMed] [Google Scholar]
- Frisina RD, Smith RL, Chamberlain SC. “Encoding of amplitude modulation in the gerbil cochlear nucleus. I. A hierarchy of enhancement,”. Hear Res. 1990;44:99–122. doi: 10.1016/0378-5955(90)90074-y. [DOI] [PubMed] [Google Scholar]
- Goldberg JM, Brown PB. “Responses of binaural neurons of dog superior olivary complex to dichotic tonal stimuli: Some physiological mechanisms of sound localization,”. J Neurophysiol. 1969;22:613–636. doi: 10.1152/jn.1969.32.4.613. [DOI] [PubMed] [Google Scholar]
- Grothe B. “Interaction of excitation and inhibition in processing of pure tone and amplitude-modulated stimuli in the medial superior olive of the mustached bat,”. J Neurophysiol. 1994;71:706–721. doi: 10.1152/jn.1994.71.2.706. [DOI] [PubMed] [Google Scholar]
- Harris DM, Dallos P. “Forward masking of auditory nerve fiber responses,”. J Neurophysiol. 1979;42:1083–1107. doi: 10.1152/jn.1979.42.4.1083. [DOI] [PubMed] [Google Scholar]
- Heinz MG, Colburn HS, Carney LH. “Rate and timing cues associated with the cochlear amplifier: Level discrimination based on monaural cross-frequency coincidence detection,”. J Acoust Soc Am. 2001a;110:2065–2084. doi: 10.1121/1.1404977. [DOI] [PubMed] [Google Scholar]
- Heinz MG, Zhang X, Bruce IC, Carney LH. “Auditory-nerve model for predicting performance limits of normal and impaired listeners,”. JARO. 2001b;2:91–96. [Google Scholar]
- Hewitt MJ, Meddis R. “A computer model of amplitude-modulation sensitivity of single units in the inferior colliculus,”. J Acoust Soc Am. 1994;95:2145–2159. doi: 10.1121/1.408676. [DOI] [PubMed] [Google Scholar]
- Joris PX, Yin TCT. “Responses to amplitude-modulated tones in the auditory nerve of the cat,”. J Acoust Soc Am. 1992;91:215–232. doi: 10.1121/1.402757. [DOI] [PubMed] [Google Scholar]
- Joris PX, Yin TCT. “Envelope coding in the lateral superior olive. III. Comparison with afferent pathways,”. J Neurophysiol. 1998;79:253–269. doi: 10.1152/jn.1998.79.1.253. [DOI] [PubMed] [Google Scholar]
- Krishna BS, Semple MN. “Auditory temporal processing: Responses to sinusoidally amplitude-modulated tones in the inferior colliculus,”. J Neurophysiol. 2000;84:255–273. doi: 10.1152/jn.2000.84.1.255. [DOI] [PubMed] [Google Scholar]
- Krukowski AE, Miller KD. “Thalamocortical NMDA conductances and intracortical inhibition can explain cortical temporal tuning,”. Nat Neurosci. 2001;4:424 –430. doi: 10.1038/86084. [DOI] [PubMed] [Google Scholar]
- Langner G. “Neuronal mechanisms for pitch analysis in the time domain,”. Exp Brain Res. 1981;44:450–454. doi: 10.1007/BF00238840. [DOI] [PubMed] [Google Scholar]
- Langner G, Schreiner CE. “Periodicity coding in the inferior colliculus of the cat. I. Neuronal mechanisms,”. J Neurophysiol. 1988;60:1799–1822. doi: 10.1152/jn.1988.60.6.1799. [DOI] [PubMed] [Google Scholar]
- Liberman MC. “Auditory-nerve responses from cats raised in a low-noise chamber,”. J Acoust Soc Am. 1978;63:442–455. doi: 10.1121/1.381736. [DOI] [PubMed] [Google Scholar]
- Miller RL, Schilling JR, Franck KR, Young ED. “Effects of acoustic trauma on the representation of the vowel/ɛ/ in cat auditory nerve fibers,”. J Acoust Soc Am. 1997;101:3602–3616. doi: 10.1121/1.418321. [DOI] [PubMed] [Google Scholar]
- Oertel D. “Synaptic responses and electrical properties of cells in brain slices of the mouse anteroventral cochlear nucleus,”. J Neurosci. 1983;3:2043–2053. doi: 10.1523/JNEUROSCI.03-10-02043.1983. [DOI] [PMC free article] [PubMed] [Google Scholar]
- Oliver, D. L., and Huerta, M. F. (1992). “Inferior and superior colliculi,” in The Mammalian Auditory Pathway: Neuroanatomy, edited by D. R. Webster, A. N. Popper, and R. R. Fay (Springer Verlag, New York), pp. 168–221.
- Oxenham AJ, Shera CA. “Estimates of human cochlear tuning at low levels using forward and simultaneous masking,”. JARO. 2003;4:541–554. doi: 10.1007/s10162-002-3058-y. [DOI] [PMC free article] [PubMed] [Google Scholar]
- Palombi PS, Caspary DM. “GABA inputs control discharge rate primarily within frequency receptive fields of inferior colliculus neurons,”. J Neurophysiol. 1996;75:2211–2219. doi: 10.1152/jn.1996.75.6.2211. [DOI] [PubMed] [Google Scholar]
- Plack CJ, Oxenham AJ. “Basilar-membrane nonlinearity and the growth of forward masking,”. J Acoust Soc Am. 1998;103:1598–1608. doi: 10.1121/1.421294. [DOI] [PubMed] [Google Scholar]
- Rhode WS, Greenberg S. “Encoding of amplitude modulation in the cochlear nucleus of the cat,”. J Neurophysiol. 1994;71:1797–1825. doi: 10.1152/jn.1994.71.5.1797. [DOI] [PubMed] [Google Scholar]
- Ryugo DK, Parks TN. “Primary innervation of the avian and mammalian cochlear nucleus,”. Brain Res Bull. 2003;60:435–456. doi: 10.1016/s0361-9230(03)00049-2. [DOI] [PubMed] [Google Scholar]
- Schneiderman A, Oliver DL, Henkel CK. “Connections of the dorsal nucleus of the lateral lemniscus: an inhibitory parallel pathway in the ascending auditory system?”. J Comp Neurol. 1988;276:188–208. doi: 10.1002/cne.902760204. [DOI] [PubMed] [Google Scholar]
- Schofield BR, Cant NB. “Projections from the ventral cochlear nucleus to the inferior colliculus and the contralateral cochlear nucleus in guinea pigs,”. Hear Res. 1996;102:1–14. doi: 10.1016/s0378-5955(96)00121-9. [DOI] [PubMed] [Google Scholar]
- Shera CA, Guinan JJ, Jr, Oxenham AJ. “Revised estimates of human cochlear tuning from otoacoustic and behavioral measurements,”. Proc Natl Acad Sci USA. 2002;99:3318–3323. doi: 10.1073/pnas.032675099. [DOI] [PMC free article] [PubMed] [Google Scholar]
- Sinex DG, Sabes JH, Li H. “Responses of inferior colliculus neurons to harmonic and mistuned complex tones,”. Hear Res. 2002;168:150–162. doi: 10.1016/s0378-5955(02)00366-0. [DOI] [PubMed] [Google Scholar]
- Smith RL. “Short-term adaptation in single auditory nerve fibers: Some post-stimulatory effects,”. J Neurophysiol. 1977;40:1098–1111. doi: 10.1152/jn.1977.40.5.1098. [DOI] [PubMed] [Google Scholar]
- Smith RL, Brachman ML. “Response modulation of auditory-nerve fibers by AM stimuli: Effects of average intensity,”. Hear Res. 1980;2:123–133. doi: 10.1016/0378-5955(80)90034-9. [DOI] [PubMed] [Google Scholar]
- Smith RL, Zwislocki JJ. “Short-term adaptation and incremental responses of single auditory-nerve fibers,”. Biol Cybern. 1975;17:169–182. doi: 10.1007/BF00364166. [DOI] [PubMed] [Google Scholar]
- Svirskis G, Rinzel J. “Influence of subthreshold nonlinearities on signal-to-noise ratio and timing precision for small signals in neurons: Minimal model analysis,”. Network Comput Neural Syst. 2003;14:137–150. [PMC free article] [PubMed] [Google Scholar]
- Viemeister NF. “Temporal modulation transfer functions based upon modulation thresholds,”. J Acoust Soc Am. 1979;66:1364 –1380. doi: 10.1121/1.383531. [DOI] [PubMed] [Google Scholar]
- Westerman LA, Smith RL. “A diffusion model of the transient response of the cochlear inner hair cell synapse,”. J Acoust Soc Am. 1988;83:2266–2276. doi: 10.1121/1.396357. [DOI] [PubMed] [Google Scholar]
- Wickesberg RE, Oertel D. “Tonotopic projection from the dorsal to the anteroventral cochlear nucleus of mice,”. J Comp Neurol. 1988;268:389–399. doi: 10.1002/cne.902680308. [DOI] [PubMed] [Google Scholar]
- Wu SH, Ma CL, Sivaramakrishnan S, Oliver DL. “Synaptic modification in neurons of the central nucleus of the inferior colliculus,”. Hear Res. 2002;168:43–54. doi: 10.1016/s0378-5955(02)00375-1. [DOI] [PubMed] [Google Scholar]
- Yin, T. C. T. (2002). “Neural mechanisms of encoding binaural localization cues in the auditory brainstem,” in Integrative Functions in the Mammalian Auditory Pathway, edited by D. Oertel, A. N. Popper, and R. R. Fay (Springer Verlag, New York), pp. 99–159.
- Zhang, X. (2004). Personal communication.
- Zhang X, Heinz MG, Bruce IC, Carney LH. “A phenomenological model for the responses of auditory-nerve fibers: I. Nonlinear tuning with compression and suppression,”. J Acoust Soc Am. 2001;109:648–670. doi: 10.1121/1.1336503. [DOI] [PubMed] [Google Scholar]