Abstract
It has been observed that the variances in reconstructed images from stationary noisy projection data by fan-beam filtered backprojection (fFBP) algorithm with ramp in the filtering step and linear interpolation in the backprojection step are non-uniform across the field-of-view. This is believed to be caused by the distance-dependent 1/L2 factor in the fFBP reconstruction formula. Shift-variant filtration approach in the filtering step has been investigated to address the non-uniform noise propagation problem in fFBP. In this work, we present an alternative solution by the use of spatially-variant weighting, instead of spatially-invariant interpolation, in the backprojection step, while remaining the homogeneous ramp filtering. Both theoretically-predicted and empirically-determined results concur and demonstrate the effectiveness of the presented alternative solution.
Keywords: Filtered backprojection, fan-beam geometry, linear interpolation, spatially-variant weighting, noise property
1. Introduction
Most modern computed tomography (CT) scanners employ fan-beam collimation for rapid acquisition of projection data and filtered backprojection (FBP) algorithm for efficient reconstruction of large volume images [1]. It has been observed [2] that fan-beam FBP (fFBP) reconstruction of stationary noisy projection data using ramp in the filtering step and linear interpolation in the backprojection step results in a significant non-uniform noise distribution across the field of view (FOV). The altered noise property from data to image would have an impact on clinical assessment [3], especially for quantitative regional analysis across the FOV. The observed non-uniform noise distribution in the reconstructed image from stationary noisy data is believed to be caused by the distance-dependent 1/L2 factor in the fFBP reconstruction formula [3–5]. Pan et al. [6] proposed a solution by a shift-variant means in the filtering step, while retaining the use of spatially-invariant linear interpolation in the backprojection step in the fFBP image reconstruction. In this paper, we present an alternative solution which uses spatially-variant weighting rather than spatially-invariant interpolation in the backpropjection step, while retaining the use of the homogenous ramp in the filtering step. This alternative solution is effective to retain a uniform noise distribution in the fFBP reconstructed images from stationary noisy data.
2. Review of fFBP Reconstruction Algorithm and Variance Calculation Formula
A typical fFBP algorithm for reconstructing an image f (x, y) from its fan-beam sinogram p(γ, β) is given by [1]:
| (1) |
where D denotes the focal length (see Fig. 1(a)), 2γmax is the maximum fan angle, h is the ramp filter defined by:
Fig. 1.
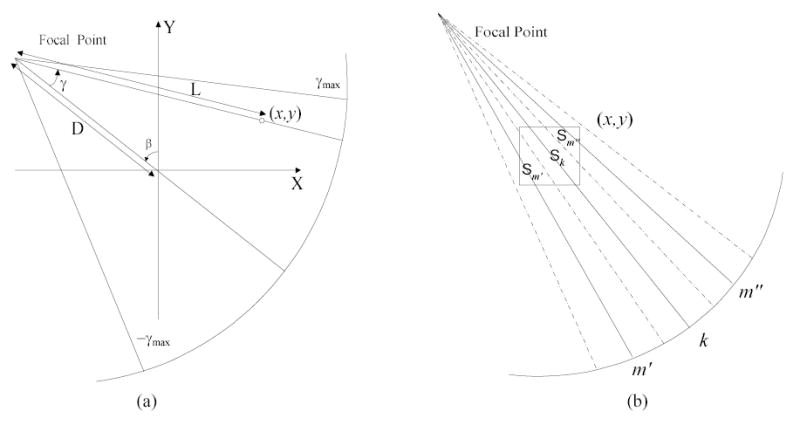
(a) Coordinates and fan-beam geometry in CT. (b) Illustration of an area weighting example in fFBP algorithm at square pixel (x, y). The dotted lines indicate the detector element spacing.
| (2) |
and L and γ′ are determined by the image-space coordinates (x, y) and the projection angle β, which are given by:
| (3) |
| (4) |
In practice, the fFBP algorithm is implemented in discrete form. Let Δγ= γmax/(I+1) and γi = iΔγ, where I+1 is the number of detector bins at each projection view and i = −I/2, −I/2+1,…, I/2 − 1, I/2. For presentation purpose, I is assumed to be an even integer. A similar result can be readily derived for I being an odd integer [6]. Let Δβ = 2π/(N+1) and βn = nΔβ, where N+1 is the number of projection views over 2π rotation and n = 0, 1,…, N, then the samples of the fan-beam sinogram can be denoted as p(γi , βn) . Using linear interpolation in the fFBP algorithm, the reconstructed image f(x, y) can be expressed as [6]:
| (5) |
where k takes the largest integer and is smaller than γ′ (x, y, βn)/Δγ. Notation ζ = γ′ (x, y, βn)/Δγ − k, and denotes the filtered discrete fan-beam sinogram, which is given by:
| (6) |
and G is the filtration matrix, whose elements are defined as:
| (7) |
By the linear interpolation in the backprojection step, it has been shown [6] that if the noise in the projection data is assumed to be uncorrelated and stationary, the variance of the fFBP reconstructed image f(x, y) can be computed, without image reconstruction, by:
| (8) |
where q0 is a constant indicating the noise level. Pan et al. [6] observed that Eq. (8) reflects a nonuniform variance distribution across the FOV and this is believed due to the 1/L2 term in the fFBP of Eq. (5) [3–5]. A solution was given by the use of shift-variant filtering in the frequency space to address the non-uniform variance distribution [6]. An alternative solution by the use of spatially-variant weighting in the image domain is explored below.
3. Method
The cause of 1/L2 term in the fFBP algorithm is related to the distance from the X-ray source to the concerned image pixel, see Eq. (3) and Fig. 1(a). At different distances, different samplings by the X-ray source/detector configuration occur. Under the assumption that the intra pixel density is uniform, the intersecting area between the fan-beam rays/strips and the pixels reflects accurately the distance-dependent sampling (see Fig. 1(b), where an example is shown with three projection rays passing through a square pixel). This spatially-variant area weighting in the image domain can be thought as an alternative solution to the shift-variant filtering in the frequency space. By the spatially-variant area weighting in the backprojection step, the fFBP reconstructed image f(x, y) can be expressed as:
| (9) |
where m′ is the lowest bin and m″ is the highest bin that pass through pixel (x, y) for a particular view, and Sk is the intersecting strip area of ray k and pixel (x, y). The variance of the reconstructed image f(x, y) by the area weighting can be computed, under the same assumption on the noise, by:
| (10) |
The difference between Eq.(8) and Eq. (10) is the interpolation term. The linear interpolation in Eq. (8) is spatially invariant, while the area weighting in Eq. (10) is spatially variant depending on the distance L from the X-ray source to the concerned pixel. The method to calculate the intersecting areas of square pixels in fan-beam geometry is described in Appendix. To illustrate the relationship between the intersecting pixel area and the distance from the X-ray source to the concerned pixel, we selected a projection at view angle π/4 as an example. The central ray of the fan-beam projection went through the diameter of a disk phantom which was discretized as a square array in the Cartesian coordinate system (x, y) of Fig. 1(a). The disk had a diameter size of 256 pixel units (pixel side size of 1 mm). The focal length D was 220 pixel units (or 22 cm) and each detector bin arc size was 1.66 mm. A fan strip was made, given the bin size and the X-ray location. All the pixels on the central ray were considered to calculate the relationship between the intersected pixel area and the distance L, as shown by Fig. 2. A spatially-variant dependence of the intersecting area on the distance L is observed.
Fig. 2.
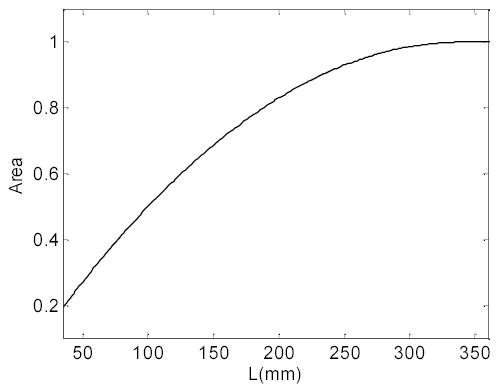
A typical relationship between the interacting area of pixels along the central ray of a fan-beam projection and distance of a concerned pixel from the X-ray source.
4. Results
First, a low contrast Shepp-Logan head phantom [1] of 256 × 256 pixel array size (pixel side size of 1 mm) was generated to test the implementation of the fFBP reconstruction algorithm. Projections were simulated in fan-beam geometry, where each projection or line integral value along a ray though the phantom was computed based on the known densities and intersection lengths of the ray with the geometric shapes of the objects in the phantom. The focal length D was 600 pixels (or 60 cm). A total of 512 fan-beam projections were sampled evenly on a 2π rotation by a circular orbit with a distance from the detector to X-ray source of 100 cm. Each view had 513 bins of equal arc distance (i.e., an equal angular sampling with bin arc size of 0.9746 mm). The fFBP reconstructed images using both linear interpolation and area weighting in the backprojection step are shown in Fig. 3 for noise-free case. There is no visual difference between these two images. Both spatially-invariant linear interpolation and spatially-variant area weighting can provide accurate fFBP reconstruction of the phantom image density distribution in noise-free case, as expected. An accurate fFBP implementation is confirmed.
Fig. 3.
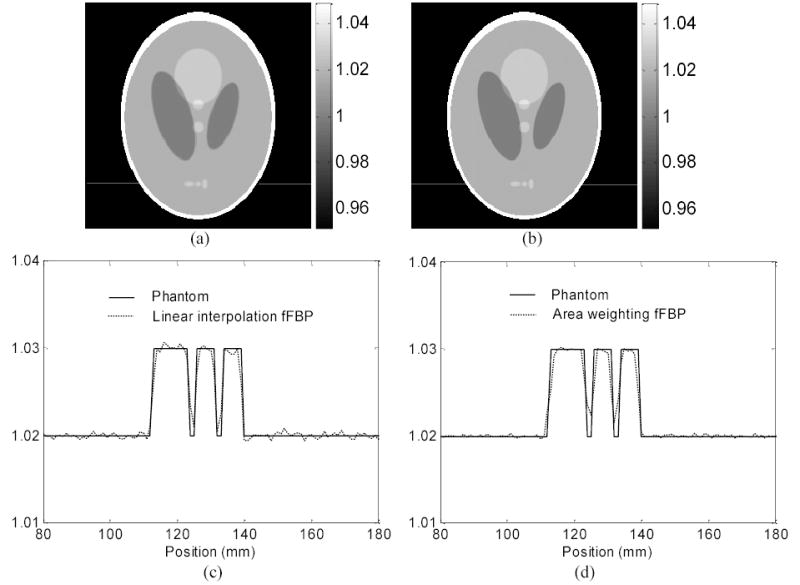
Picture (a) shows the fFBP reconstructed image of the Shepp-Logan head phantom by linear interpolation in the backprojection step. Picture (b) is the reconstructed image of the Shepp-Logan head phantom by area weighting in the backprojection step. Graphs (c) and (d) show the horizontal profiles though the reconstructed images at the indicated locations in (a) and (b) respectively. The solid line indicates the true phantom values; the dotted line is the result of the fFBP reconstructed images. Aliasing effect is seen, although at slightly different levels for these two interpolations, due to pixel discretization.
Then, a disk phantom was used to repeat the data simulation procedures above. The disk had a diameter of 256 pixel units (the same physical size of 1 mm as mentioned above). The focal length D was 220 pixel units (or 22 cm) and the maximum fan angle 2γmax was 0.68π. The sinogram was simulated with 512 views over a 2π rotation and each view had 513 bins of equal angular sampling (with bin arc size of 1.66 mm). Fig. 4(a) and Fig. 4(b) show the variance images predicted theoretically by the linear interpolation of Eq. (8) and the area weighting of Eq. (10), respectively. A high non-uniformity is seen in Fig. 4(a), concurring with the observations in [2, 6]. A relatively uniform variance is observed in Fig. 4(b). Their difference can be appreciated by inspecting their horizontal profiles through the center of the variance images, see Fig. 5(a). The spatially-variant area weighting retained the assumed noise property, while the spatially-invariant linear interpolation altered the noise property.
Fig. 4.
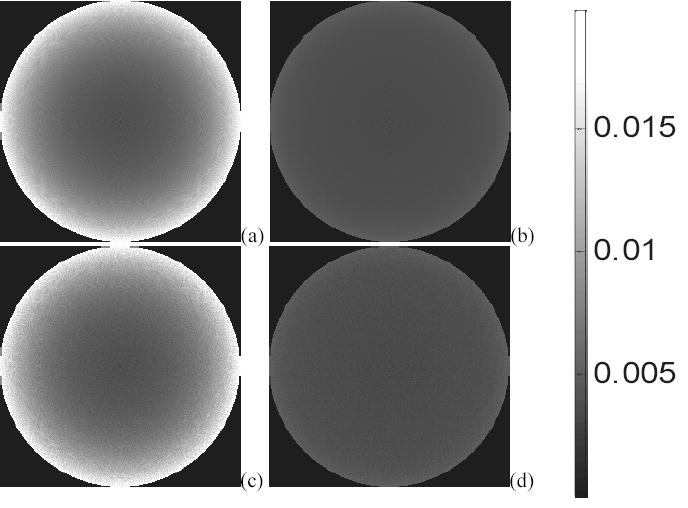
First row shows the theoretically-predicted variance images from Eq. (8) of linear interpolation (a) and Eq. (10) of area weighting (b). Second row shows the empirically-determined variance images from 800 noisy realizations, where (c) is the result from the linear interpolation fFBP reconstruction and (d) is the result from the area weighting fFBP reconstruction.
Fig. 5.
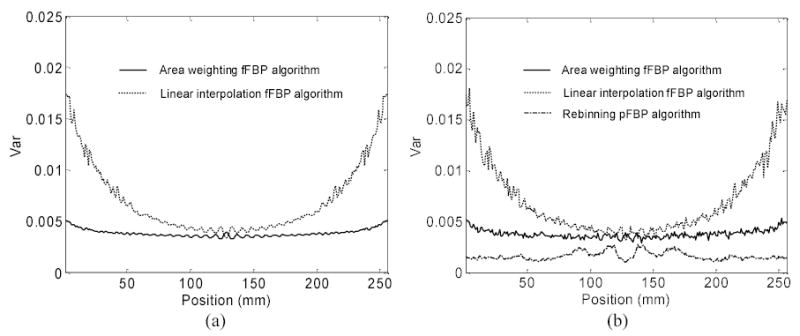
Horizontal profiles through the center of the variance images. Graph (a) shows the theoretically-predicted variance images. Graph (b) shows the empirically-determined variance images from 800 noisy realizations.
To verify the theoretically-predicted results above, we empirically determined their corresponding variances by multiple noisy realizations. From the simulated noise-free sinogram, 800 noisy realizations were generated by adding a stationary Gaussian noise (under the noise assumption above) with a standard deviation that is 0.4% of the maximum value of the sinogram. Using these 800 sets of noisy sinograms, we first reconstructed 800 images by the fFBP algorithm with the linear interpolation and area weighting, respectively, and then computed their variance images from their corresponding 800 reconstructed images. Figure 4(c) and Fig. 4(d) show the obtained variance images and Fig. 5(b) shows their horizontal profiles. These results agree with the theoretical predictions above.
An alternative method to reconstruct the fan-beam geometry CT image can be a rebinning strategy, where parallel-beam sinogram is estimated from the fan-beam sinogram by interpolation and the CT image is then reconstructed by using parallel-beam FBP (pFBP) algorithm. In this paper, we compared our presented method with the rebinning pFBP strategy. From the above 800 sets of noisy fan-beam sinograms of the uniform disk phantom, their corresponding parallel-beam sinograms were estimated by bilinear interpolation and 800 images were reconstructed by pFBP algorithm. The empirical variance image was calculated from the rebinning pFBP reconstructions and the horizontal profile through the center of the variance image is shown in Fig. 5(b) by the dashed-dotted (or lowest) line. From Fig. 5(b), it can be observed that the variance obtained by the rebinning pFBP algorithm is relatively uniform and lower than the results of the fFBP algorithm with both linear interpolation and area weighting, because of the bilinear interpolation in the rebinning. However, the variance of the rebinning pFBP reconstruction shows noticeable ripples in the FOV center, concurring with the result in [6]. Furthermore, the interpolation in the rebinning process is expected to sacrifice the resolution [6].
To quantitatively compare the resolution properties of the above different reconstruction algorithms, we computed the modulation transfer function (MTF) of a phantom with point-like structure using the different algorithms. The phantom had a 512 × 512 array size and contained a point-like source at pixel (220, 220). The sinogram was simulated with 1204 views over a 2π rotation and each view had 1201 bins of equal-angular sampling. The focal length was 220 pixel units and the maximum fan angle was 0.68π. The phantom images were reconstructed by the three different algorithms (i.e., rebinning pFBP, fFBP with area weighting and linear interpolation) from the fan-beam sonogram. Fourier transforms were then computed from the reconstructed images. The MTF was calculated as the average of the modulus of the Fourier transforms over polar angles. The results of these three algorithms are shown in Fig. 6. A higher MTF curve implies a higher resolution. The spatial resolution of the area weighting and linear interpolation fFBP algorithms are almost the same and higher than the spatial resolution of the rebinning pFBP algorithm. This result on spatial resolution for the rebinning pFBP algorithm concurs with the observation in [6].
Fig. 6.
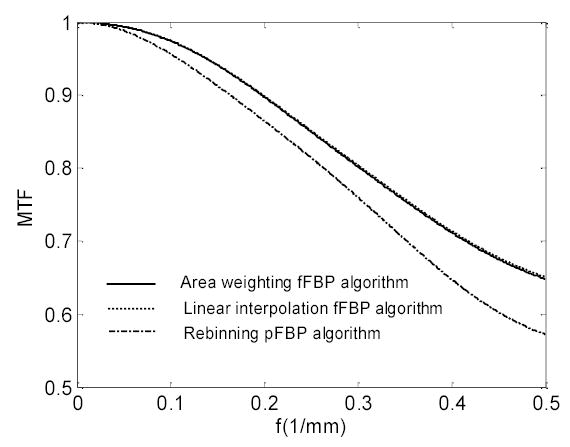
MTFs of the area weighting fFBP algorithm, linear interpolation fFBP algorithm and the rebinning pFBP algorithm. The MTFs of the area weighting and linear interpolation fFBP algorithms almost overlap with each other.
5. Conclusion
The distance-dependent factor 1/L2 in fFBP algorithm causes a significant non-uniform noise variance in fFBP reconstruction of stationary noisy data with ramp filter and linear interpolation. The “cause” implies that the same CT data noise property in parallel geometry and different focal length fan-beam geometries could generate different noise distributions in the corresponding FBP and fFBP reconstructed images, resulting in variable regional quantitative measures across the FOV. The presented spatially-variant area weighting term in reconstruction formula plays the role in canceling out the non-uniformity effect due to the distance-dependent factor 1/L2 in the fFBP reconstruction. Both the theoretical prediction and empirical results concurred and demonstrated the effectiveness of the presented alternative solution.
Acknowledgments
This work was partially support by the NIH grant number CA-82402, and Dr. Lu was supported by the National Nature Science Foundation of China under Grant 30170278. The authors are grateful to Dr. Roxanne Palermo for editing this paper.
Appendix
This Appendix describes our method for calculating the intersecting area of a unit square with a fan-beam datum sampling, as illustrated in Fig. 7(a). Line FR intersects square ABCD at G and H, line FT intersects the square at M and N, and line FO intersects the square at P and Q, where F is the focal point and O is the center of the square ABCD. The intersection area of pentagon GMNCH is equal to the sum of the area of quadrangle GPQH and the area of pentagon PMNCQ. The calculation for the pentagon area PMNCQ is similar to that of the quadrangle area GPQH. The details of calculating the pentagon area PMNCQ is given below.
Fig. 7.
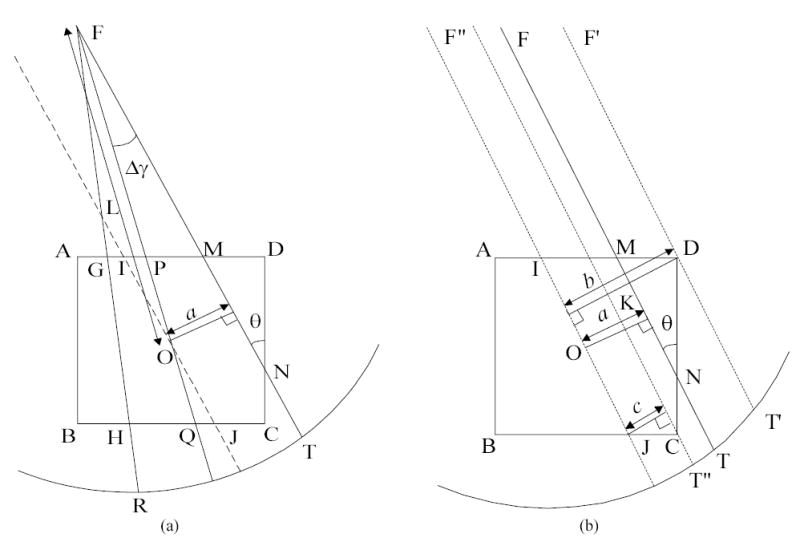
Illustration of calculating the intersection area of a unit square pixel in fan-beam geometry.
To calculate the area of pentagon PMNCQ, line IJ is introduced, which is parallel to line MN and passing through the center O. The area of pentagon PMNCQ is equal to the area of pentagon IMNCJ because the area of triangle IOP is equal to the area of triangle JOQ. The calculation of pentagon area IMNCJ is described as follows. First, the distance between the two parallel lines IJ and MN a = L sin(Δγ) is determined, where L is defined in Eqn. (3), Δγcan be calculated from Eqn. (4), and a plays a critically important role in the calculation. Lines F′T ′ and F″T″ in Fig. 7 (b) illustrate the critical situation for a. If a is larger than b, where b is the distance from point D to line IJ, the area of pentagon IMNCJ is equal to 0.5 (i.e., the area of quadrangle IDCJ, since line FT will not intersect with the square). If a is smaller than c, where c is the distance from point C to line IJ, the intersection area is equal to a /sinθ, where θ = β + γ. If a is larger than c but smaller than b, the area of pentagon IMNCJ is equal to (1− (b − a)2 /(sinθcosθ)) /2 . The distances b and c are determined by the following two equations:
| (A.1) |
| (A.2) |
Equation (A.1) reflects that the sum of line lengths of ID and CJ is equal to 1, and Eqn. (A.2) is based on that the line length of DK is equal to b − c and also to CD × sinθ, see Fig. 7(b).
Although the above argument is tedious, the implementation is quite simple (the fFBP reconstruction time with the area weighting was approximately twice of that with the linear interpolation). The procedure to calculate the intersection area of a strip (defined by the line FT and the line FO passing through the center of a unit square from the same focal point) with the unit square ABCD is summarized as:
1. Calculate a = L sin(Δγ);
2. Compute b = |cosθ + sinθ|/2 and c = |cosθ − sinθ|/2 ;
3. If a ≥ b , area is 0.5; if b > a > c , area is equal to (1 −(b − a)2/| sinθcosθ|) /2 ; if c ≥ a , area is equal to a /| sinθ| .
References
- 1.A. C. Kak and M. Slaney, Principles of computerized tomographic imaging, IEEE, Inc., New York, 1988.
- 2.Pan X. “Optimal noise control in and fast reconstruction of fan-beam computed tomography image”. Med Phys. 1999;26:689–697. doi: 10.1118/1.598574. [DOI] [PubMed] [Google Scholar]
- 3.Hsieh J. “Nonstationary noise characteristics of the helical scan and its impact on image quality and artifacts”. Med Phys. 1997;24:1375–1384. doi: 10.1118/1.598026. [DOI] [PubMed] [Google Scholar]
- 4.Besson G. “CT image reconstruction from fan-parallel data”. Med Phys. 1999;26:415–426. [Google Scholar]
- 5.Zeng GL. “Nonuniform noise propagation by using the ramp filter in fan-beam computed tomography”. IEEE Trans Med Imaging. 2004;23:690–695. doi: 10.1109/tmi.2004.826943. [DOI] [PubMed] [Google Scholar]
- 6.Pan X, Yu L. “Image reconstruction with shift-variant filtration and its implication for noise and resolution properties in fan-beam computed tomography”. Med Phys. 2003;30:590–600. doi: 10.1118/1.1556608. [DOI] [PubMed] [Google Scholar]


