Abstract
C. rodentium is the rodent equivalent of human enteropathogenic E. coli infection. This study investigated regulation of hepatic and renal cytochrome P450 (P450) mRNAs, hepatic P450 proteins, cytokines and acute phase proteins during C. rodentium infection. Female C3H/HeOuJ (HeOu) and C3H/HeJ (HeJ) mice (which lack functional toll-like receptor 4 [TLR4]) were infected with C. rodentium by oral gavage, and sacrificed 6 days later. Hepatic CYP4A10 and 4A14 mRNAs were decreased in HeOu mice (<4% of control). CYP3A11, 2C29, 4F14, and 4F15 mRNAs were reduced to 16–55% of control levels, whereas CYP2A5, 4F16, and 4F18 mRNAs were induced (180, 190, and 600% of control, respectively). The pattern of P450 regulation in HeJ mice was similar to that in HeOu mice for most P450s, with the exception of the TLR4-dependence of CYP4F15. Hepatic CYP2C, 3A, and 4A proteins in both groups were decreased, whereas CYP2E protein was not. Renal CYP4A10 and 4A14 mRNAs were significantly down-regulated in HeOu mice, whereas other P450s were unaffected. Most renal P450 mRNAs in infected HeJ mice were increased, notably CYP4A10, 4A14, 4F18, 2A5 and 3A13. Hepatic levels of IL-1β, IL-6, and TNFα mRNAs were significantly increased in infected HeOu mice, whereas only TNFα mRNA was significantly increased in HeJ mice. Hepatic α1-acid glycoprotein was induced in both groups, whereas α-fibrinogen and angiotensinogen were unchanged. These data indicate that hepatic inflammation induced by C. rodentium infection is mainly TLR4-independent, and suggest that hepatic P450 down-regulation in this model may be cytokine-mediated.
Abbreviations: P450, cytochrome P450; TLR4, toll-like receptor 4; IL, interleukin; TNFα, tumor necrosis factor alpha; LPS, lipopolysaccharide; PPARα, peroxisome proliferator activated receptor alpha; AGP, α1-acid glycoprotein; FBG, fibrinogen alpha polypeptide; AGT, angiotensinogen; EPEC, enteropathogenic Escherichia coli; DSS, dextran sulfate sodium; IBD, inflammatory bowel disease; RTPCR, reverse transcription-polymerase chain reaction; GAPDH, glyceraldehyde phosphate dehydrogenase; PCR, polymerase chain reaction
INTRODUCTION
Bacterial infections and/or inflammation suppress both hepatic and extrahepatic cytochrome P450 (P450) expression and metabolism (Morgan, 2001; Renton, 2004), which can result in altered drug responses. Lipopolysaccharide (LPS; endotoxin) is the major constituent of the outer membrane of Gram-negative bacteria and is a principal mediator of the inflammatory response to invading pathogens. Toll-like receptor 4 (TLR4) is responsible for LPS signaling (Poltorak et al., 1998; Hoshino et al., 1999). TLR4 specifically responds to LPS in association with several proteins, including LPS-binding protein, CD14, and MD-2 proteins (Beutler et al., 2001). LPS has been used extensively as a sterile model of sepsis to study the down-regulation of hepatic P450s during inflammation. The LPS model has proven invaluable in understanding the importance and mechanisms of hepatic P450 suppression. However, the LPS model may not accurately predict how P450 enzymes will be regulated in other models of inflammation or in live bacterial infection.
As a live bacterial infection model, Citrobacter rodentium is the rodent equivalent of human enteropathogenic Escherichia coli (EPEC) infection. The colonic pathology elicited by C. rodentium is indistinguishable from that of EPEC (Schauer and Falkow, 1993), with characteristic attaching and effacing lesions on intestinal cells (Goosney et al., 2000). EPEC are a specific serotype of E. coli that are the major cause of infantile diarrhea worldwide (Nataro and Kaper, 1998) and contaminate food and water supplies. C. rodentium, a member of the Enterobacteriaceae family and a natural murine pathogen, provides an excellent model for human EPEC infection and colitis (Jurjus et al., 2004; Wales et al., 2005). The colitis caused by C. rodentium infection is also characteristic of inflammatory bowel disease (IBD) in mice and humans, and C. rodentium is considered a model for IBD (Higgins et al., 1999; Caradonna et al., 2000; Goncalves et al., 2001; Gobert et al., 2004).
Chemically induced colitis models have been developed for determination of mechanisms of IBD. Experimental models of inflammation mimicking human ulcerative colitis include treatment with dextran sulfate sodium (DSS) in drinking water for 6 to 10 days or intrarectal treatment with 2,4,6-trinitrobenzene sulfonic acid (TNBS) (Okayasu et al., 1990). However, very little is known about the impact of colitis on hepatic P450 function or expression in humans or animals. Weidenbach et al. (2000) studied hepatic P450 activity in perfused livers from rats with TNBS-induced colitis, finding decreased metabolic capacity at 1–2 days. Hepatic P450 activity toward lidocaine was decreased by approximately 30% 1–2 days after colitis induction, with recovery at 7 days. More recently, Masubuchi and Horie (2004) studied the effect of DSS-induced colitis on rat hepatic P450 activities. CYP3A2, 2C11, 1A2, and 2E1 activities were down-regulated, but CYP2D2 was not. P450 down-regulation during DSS-induced colitis was prevented by treatment with polymyxin B (CYP3A2, 2E1) or metronidazole (CYP3A2, 2C11, 2E1) (Masubuchi and Horie, 2004), indicating that endotoxins of commensal bacteria are likely involved in some of the effects. Portal blood endotoxin levels were elevated in these rats, but liver weight and serum alanine aminotransferase enzymes were normal, suggesting little liver damage. However, it is unclear from these studies whether these changes in P450 activity reflected changes in gene expression.
We hypothesized that the LPS model may not predict how P450 enzymes will be regulated in other models of inflammation, such as a live infection. Therefore, we investigated hepatic and renal P450 expression during C. rodentium bacterial infection in wildtype mice and mice deficient in functional TLR4, a critical component of LPS signaling. We found that C. rodentium infection produced effects on hepatic P450 expression that were more enzyme-selective than the effects produced by LPS injection, and were largely independent of TLR4 activation.
MATERIALS AND METHODS
Bacteria
A wildtype strain of Citrobacter rodentium (#51116) was obtained from American Type Culture Collection (Manassas, VA). Before infection, C. rodentium were grown in Luria broth without shaking overnight, and harvested by centrifugation. Bacteria were resuspended in phosphate buffered saline (PBS), and concentration determined by retrospective plating on MacConkey agar, on which C. rodentium forms small pink colonies with white rims.
Chemicals, Animals and Treatments
Unless otherwise specified, all reagents and chemicals were obtained from Sigma-Aldrich (St. Louis, MO). Female wildtype (C3H/HeOuJ; HeOu) and toll-like receptor (TLR) 4 mutant (C3H/HeJ; HeJ) mice were obtained from Jackson Laboratory (Bar Harbor, ME). These mice derive from the same parent strain and are genetically very similar, except that C3H/HeJ mice incurred a spontaneous inactivating mutation in the TLR4 gene approximately 40 years ago (http://jaxmice.jax.org). The mice were acclimatized to the animal facility for 1 week, and mice were 4–5 weeks of age at the time of infection. Mice were housed in a Biosafety Level-2 facility to prevent transmission of infection to other mouse colonies. Two groups of mice were infected with 2.0 x 10⁸ CFU of C. rodentium in saline by gavage. Control groups for each genotype were administered saline by gavage the day after the infected group, and were pairfed, i.e. each day they received the amount of food eaten by the infected group on the prior day. Mice were pairfed in order to control for the possible role of reduced food intake in P450 regulation during infection. Mice were sacrificed 6 days after administration of saline or bacteria. Livers and kidneys were collected, rinsed in cold 1.15% potassium chloride, and stored at −80°C until RNA or microsome preparation. Four or six mice were in each group (n = 4, HeJ infected group; n = 6, HeOu pairfed, HeOu infected, HeJ pairfed). The Institutional Animal Care and Use Committee of Emory University approved all procedures.
Preparation of Total RNA
Total liver and kidney RNA were prepared using RNA-Bee isolation reagent according to the manufacturer’s instructions (Tel-test, Friendswood TX). Total RNA concentration was determined spectrophotometrically by measuring absorbance at 260 nm, and RNA purity and integrity was confirmed by formaldehyde-agarose gel electrophoresis followed by visualization with ethidium bromide.
Microsome Preparation
Liver microsomes were prepared by differential centrifugation and stored at −80°C (Haugen and Coon, 1976). Microsomal protein concentrations were determined by the method of Lowry et al. (1951) using bovine serum albumin as the standard.
cDNA Synthesis
Purified total RNA was reverse-transcribed using the SuperScript First-Strand Synthesis System for RT-PCR kit (Invitrogen, Carlsbad, CA), according to the manufacturer's protocol.
Primer Sequences
Primers for mouse P450s (excluding CYP4Fs), cytokines, acute phase proteins, and glyceraldehyde dehydrogenase (GAPDH) were designed using the Primer Select software program (DNASTAR, Inc., Madison, WI). To exclude cross-reactivity with other mouse P450 sequences, as well as other enzymes, all primers were submitted to the National Center for Biotechnological Information (NCBI) for nucleotide comparison by the basic local alignment search tool (BLASTn; Altschul et al., 1990). Oligonucleotides with a high degree of similarity (>80%) to other mouse P450 mRNA transcripts were eliminated from further consideration. Primers were custom-synthesized on a 50-nmol scale by MWG Biotech, Inc. (High Point. NC), and obtained desalted and lyophilized. Primers were diluted to 100 μM in deionized water, and stored at −80°C. For mouse P450 4F genes, specific sequences for PCR primers and dual-labeled fluorescent probes were designed at the region of highest sequence specificity or intron/exon boundaries using Primer Express software (Applied Biosystems, Foster City, CA) and custom synthesized by Integrated DNA Technologies, Inc. (Coralville, IA). The isoform specificity of P450 primers and probes was confirmed through multiple alignments with the other members of the CYP4F subfamily as well as homology-searched to ensure no cross reactivity with other genes using an NCBI BLAST search. All primer sequences have been published previously (Pan et al., 2000; Overbergh et al., 2003; Richardson and Morgan, 2005), except for the CYP4F primer and probe sequences (Antonovic et al., manuscript in preparation).
Quantitative Reverse Transcriptase PCR (real-time RTPCR)
With the exception of the CYP4Fs, real-time RTPCR was performed using the ABI PRISM 7000 Sequence Detection System and SyBr Green Master Mix reagent (Applied Biosystems, Bedford, MA) to determine expression of mRNAs of interest in mouse liver and kidney, as previously described by Richardson and Morgan (2005). Briefly, reactions were performed in a total volume of 25 μl using SyBr Green Master Mix reagent (Applied Biosystems); 2 μl of cDNA/sample was used as template for the reaction, with 10 μM forward and reverse primers. P450 and GAPDH cDNA amplification were performed in duplicate wells using the same sample. Thermal cycling conditions included 2 min at 50°C and 10 min at 95°C, followed by 40 cycles of 95°C for 15 s and 1 min at the appropriate annealing temperature. This technique allows identification of the threshold cycle (Ct) value when PCR product is first detectable, using fluorescence emission. To normalize the amount of total mRNA present in each reaction, levels of the housekeeping gene GAPDH were monitored in parallel samples. Results are expressed as relative levels of P450 mRNA, as defined by the Ct method described by Livak and Schmittgen (2001). Control samples were chosen to represent 1x expression of the gene. The amount of P450 mRNA in treated samples was calculated relative to the control P450 sample. All primer sets yielded a single PCR product of expected size by agarose gel electrophoresis. Specificity was routinely monitored by checking product melting curves (dissociation curves) in each reaction well.
For analysis of mouse P450 4Fs, quadruplicate aliquots of total RNA (200ng) for each sample were reverse-transcribed, including a blank [without the reverse transcriptase (RT) enzyme] to account for amplification of contaminating genomic DNA, at 50°C for 30 min, followed by 72°C for 5 min. Ten μl RT sample reactions consisted of 4μl RNA, 1 x SSII buffer, 300nM reverse primer, 500 μM dNTPs, and 10U/10μl Superscript II (Invitrogen, Carlsbad, CA). Following this, the QPCR reaction was carried out by adding forty microliters of QPCR mix (containing 1x PCR buffer, 300nM forward primer, 300nM reverse primer, 4mM MgCl2, 2.5U/50μl Taq polymerase, and 100nM fluorogenic probe) to each RT sample. Amplification was performed using an ABI Prism 7700 (Applied Biosystems) at 95°C for 1 min, followed by 40 cycles of 95°C for 15 s and 60°C for 1 min. During the QPCR reaction, an increase in fluorescence generated by the increase in cleaved reporter dye is detected, normalized for its reporter signal fluorescence, and plotted by the instrument vs. cycle number. Standard curves for individual CYP4F isoforms were generated by plotting threshold cycle (Ct) versus the log of their amplicon amount (custom made by Integrated DNA Technologies, Inc., Coralville, IA) in the range of 200ng-2pg, and were used to calculate the relative amount of a particular CYP4F mRNA in the samples. Calculations for Ct and standard curves were performed using the instrument software (Heid et al., 1996). Data were analyzed and the absolute amount of each CYP4F mRNA in samples was determined by normalizing the values for copy number of the gene of interest to the copy number values of m-cyclophilin used as an internal standard. For comparison to the other P450s, CYP4F data are presented in relative amounts of RNA, rather than absolute RNA amounts.
Western Immunoblotting
P450 protein levels in mouse hepatic microsomes were measured by sodium dodecyl sulfate polyacrylamide gel electrophoresis and Western blotting, as previously described in Richardson and Morgan (2005). Antibodies to rat CYP3A2, 4A1, and 2E1 were generously provided by Dr. James Halpert (University of Texas Medical Branch, Galveston, TX), Dr. Gordon Gibson (University of Surrey, Guildford, UK), and Dr. Magnus Ingelman-Sundberg (Karolinska Institute, Stockholm, Sweden), respectively. Polyclonal antibodies to rat CYP3A2, 4A1, and 2E1 proteins were diluted 1:5000, whereas 2C11 antibody (Morgan et al., 1994) was diluted 1:20000. Secondary antibodies were as follows: goat anti-rabbit, 3A, 2C, and 2E; rabbit anti-sheep, 4A; dilution for each was 1:2500, with the exception of 2C, which was 1:10000. All assays were performed within a linear range and the intensity of stained bands was measured by laser densitometry.
Statistical Analysis
Control and experimental groups were compared by Student’s t-test.
RESULTS
C. rodentium infected mice exhibited overt signs of infection, with diarrhea and body weight loss. Body weights of all mice were stable for the first four days of the experiment. The body weights of infected HeJ mice and their pairfed controls declined from 19 g on day 4 to 17 g on day 7, with no significant difference between the groups (data not shown). The body weights of infected HeOu mice declined similarly in this period, but the body weights of pairfed HeOu mice remained stable. C3H/HeJ and HeOu mice are highly susceptible to infection, requiring 4 days for bacterial colonization and death occurring between 6 and 10 days post-infection (Vallance et al., 2003). Two of the 6 mice in the HeJ infected group died during the exposure time, with a resultant n = 4 for the HeJ infected group. All mice in the other groups (n = 6) survived the entire exposure period.
Effect of C. rodentium Infection on Hepatic P450 mRNA and Protein Expression
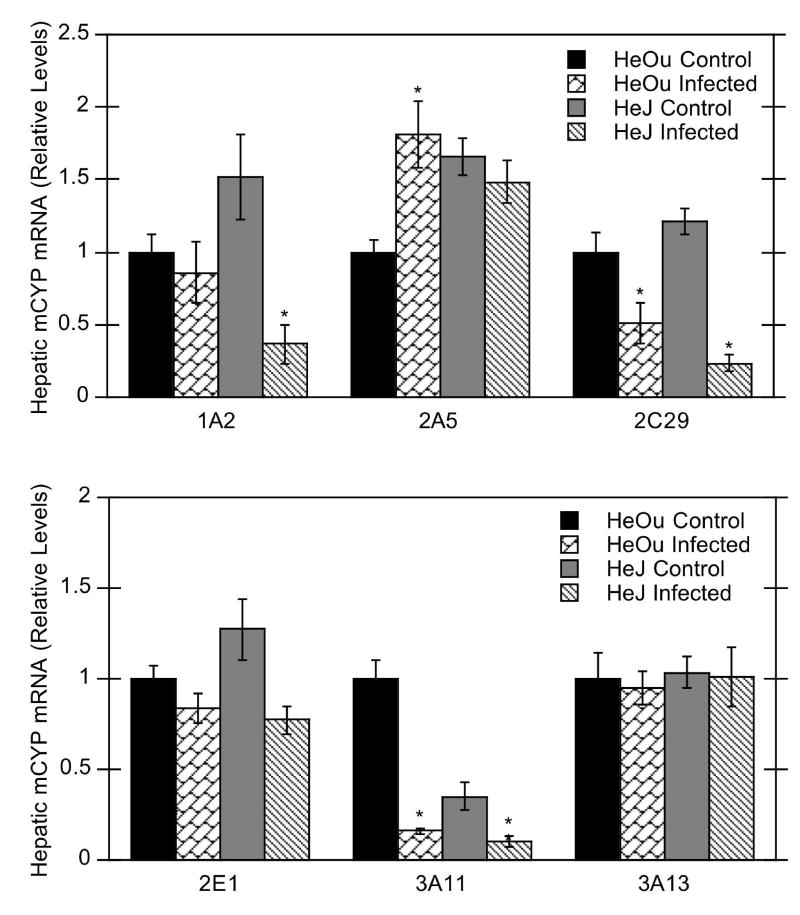
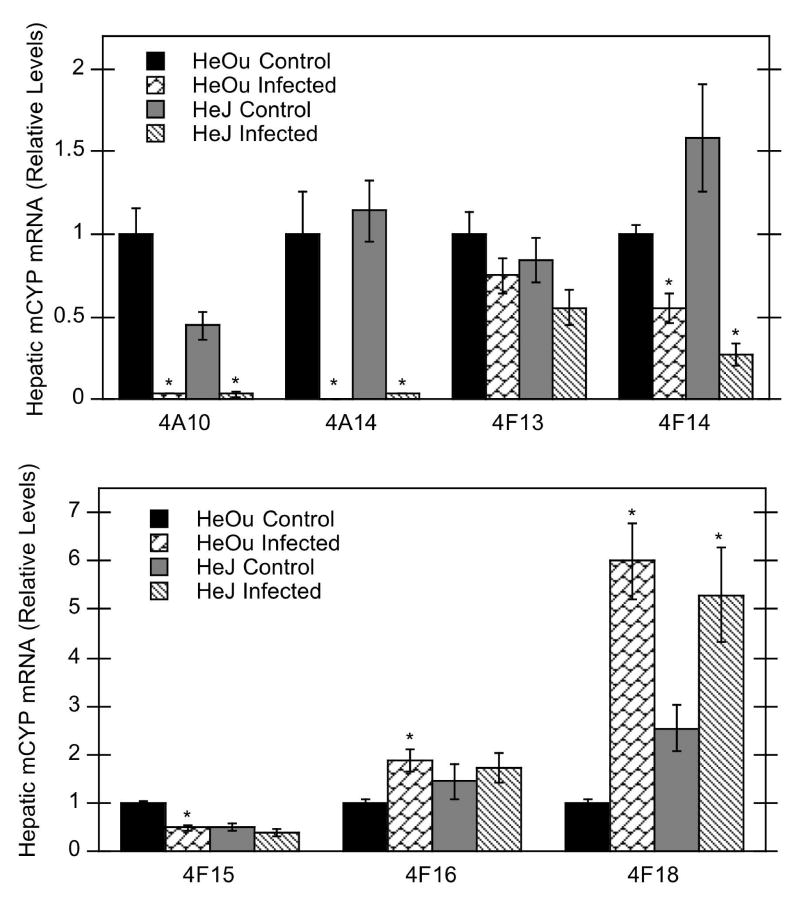
Bacterial infection significantly down-regulated the hepatic expression of CYP2C29, 3A11, 4A10, 4A14, 4F14, and 4F15 mRNAs, but not CYP1A2, 2E1, 3A13, and 4F13 mRNAs in HeOu mice (Figs. 1, 2). Of the P450 isoforms studied, CYP4A10 and 4A14 mRNAs were the most affected by C. rodentium infection (reduced to less than 4% of control) (Fig. 2). CYP3A11 mRNA was down-regulated to 16% of control, whereas CYP2C29, 4F14, and 4F15 mRNAs exhibited intermediate reductions to 50%, 55%, and 48% of control, respectively. In contrast to the other P450 isoforms, hepatic CYP2A5 and CYP4F16 mRNAs were induced to 180% and 188% of control levels, respectively, in infected HeOu mice, and CYP4F18 mRNA levels were induced to 600% of control (Figs. 1 and 2).
Figure 1.
Effect of C. rodentium infection on mRNA expression of several hepatic P450 isoforms in HeOu and HeJ mice. Mice were treated with either saline or C. rodentium by oral gavage, and hepatic mRNA expression determined after 6 days. Values are expressed as relative levels of mRNA expression after normalization to GAPDH. Values represent means ± S.E.M. for each group (n = 4 or 6), and designations denote significant differences (p<0.05) from respective control groups (*).
Figure 2.
Effect of C. rodentium infection on mRNA expression of hepatic CYP4A and 4F isoforms in HeOu and HeJ mice. Mice were treated with either saline or C. rodentium by oral gavage, and hepatic mRNA expression determined after 6 days. Values are expressed as relative levels of mRNA expression after normalization to GAPDH or cyclophilin. Values represent means ± S.E.M. for each group (n = 4 or 6), and designations denote significant differences (p<0.05) from respective control groups (*); N.D., not detectable.
The pattern of P450 regulation after infection in HeJ mice was similar to that in HeOu mice for most mRNAs (CYP2C29, 3A11, 3A13, 4A10, 4A14, 4F14, 4F18). In contrast to effects in HeOu mice, hepatic CYP1A2 mRNA expression in HeJ mice was decreased to 24% of control, and CYP2A5 and 4F16 mRNAs were unaffected (Figs. 1, 2).
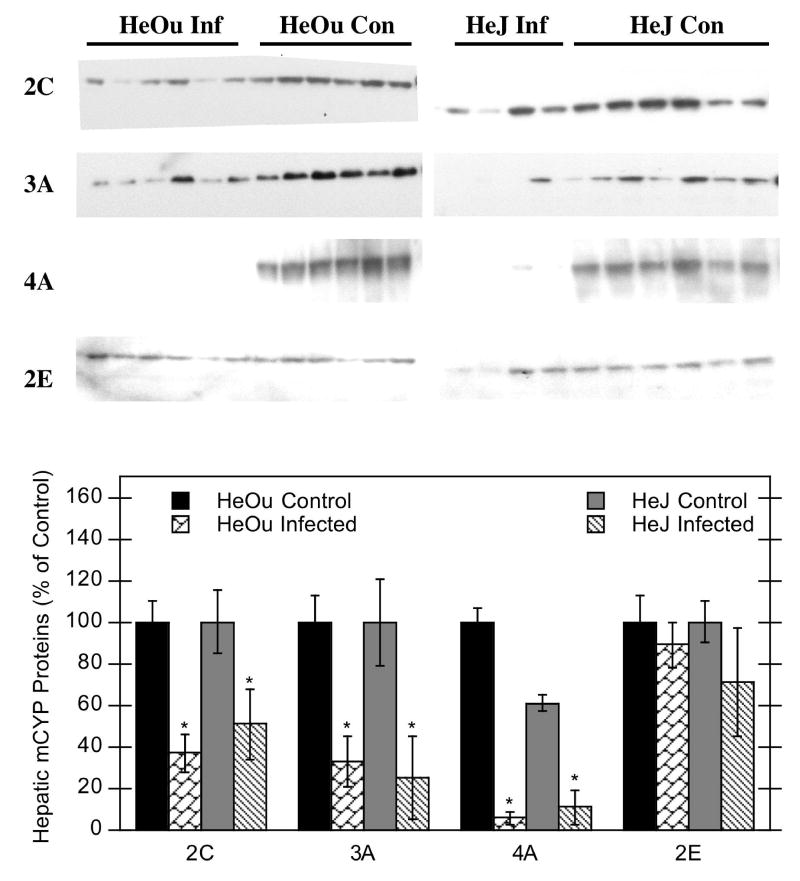
C. rodentium infection decreased P450 protein expression (2C, 3A, and 4A) in both HeOu and HeJ mice (Fig. 3), which was consistent with mRNA results. Again, CYP4A proteins were the most significantly affected by C. rodentium infection, decreasing to 6% and 18% of control in HeOu and HeJ mice, respectively (Fig. 3).
Figure 3.
Effect of C. rodentium infection on hepatic P450 proteins in HeOu and HeJ mice. Mice were treated with either saline or C. rodentium by oral gavage, and protein expression determined after 6 days. Western blot data of P450 proteins from hepatic microsomes from control mice and mice infected with C. rodentium (top panel). Quantitative analysis of western blot data (bottom panel). Values represent means ± S.E.M. for each group (n = 4 or 6), and designations denote significant differences (p<0.05) from respective control groups (*).
Effect of C. rodentium Infection on Renal P450 mRNA Expression
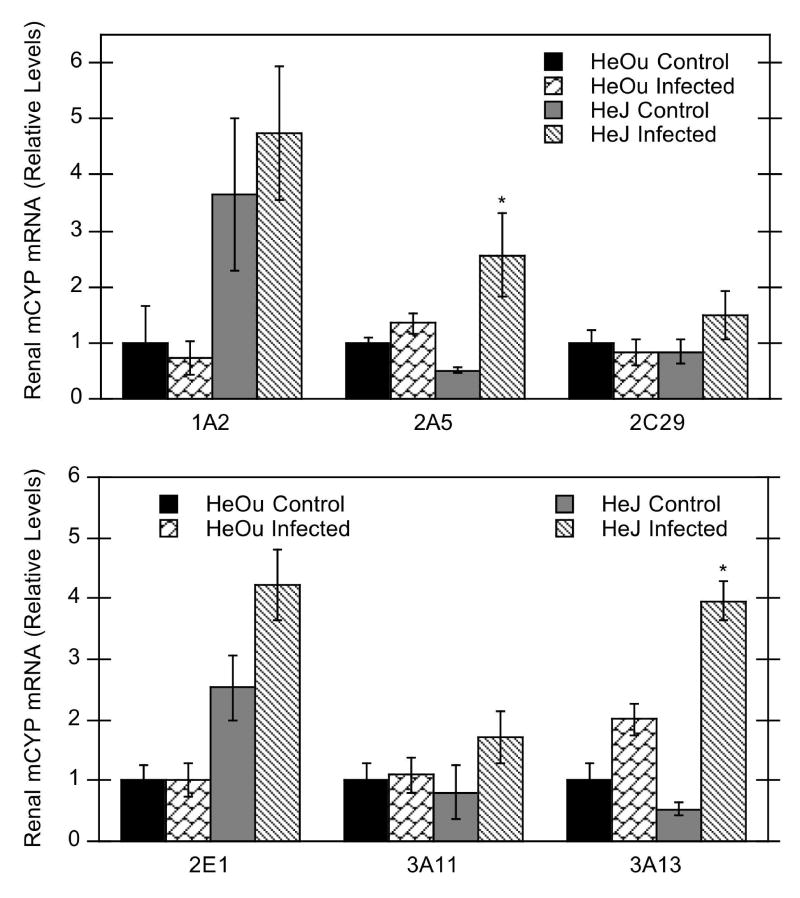
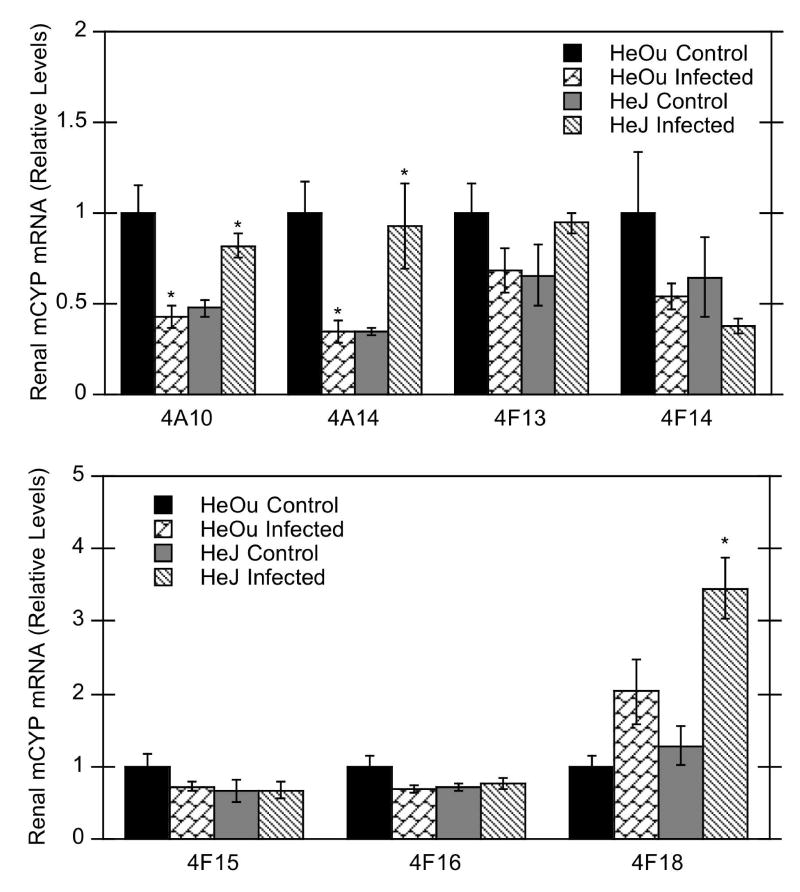
Bacterial infection had no significant effect on most of the renal P450 isoforms studied in HeOu mice (CYP1A2, 2A5, 2C29, 2E1, 3A11, and 3A13) (Fig. 4). CYP4A10 and 4A14 mRNAs were significantly down-regulated by C. rodentium infection in kidneys of HeOu mice, with reductions to 43% and 34% of control, respectively (Fig. 5), whereas a tendency towards up-regulation of CYP4F18 mRNA in HeOu mice missed significance (p= 0.07). In contrast, renal P450 mRNAs in HeJ mice tended to increase after C. rodentium infection, with significant increases for CYP2A5 (500% of control), 3A13 (740% of control), 4A10 (170% of control), 4A14 (270% of control), and 4F18 (270% of control) mRNAs (Figs. 4, 5).
Figure 4.
Effect of C. rodentium infection on mRNA expression of several renal P450 isoforms in HeOu and HeJ mice. Mice were treated with either saline or C. rodentium by oral gavage, and hepatic mRNA expression determined after 6 days. Values are expressed as relative levels of mRNA expression after normalization to GAPDH. Values represent means ± S.E.M. for each group (n = 4 or 6), and designations denote significant differences (p<0.05) from respective control groups (*).
Figure 5.
Effect of C. rodentium infection on mRNA expression of renal CYP4A and 4F isoforms in HeOu and HeJ mice. Mice were treated with either saline or C. rodentium by oral gavage, and renal mRNA expression determined after 6 days. Values are expressed as relative levels of mRNA expression after normalization to GAPDH or cyclophilin. Values represent means ± S.E.M. for each group (n = 4 or 6), and designations denote significant differences (p<0.05) from respective control groups (*).
Effect of C. rodentium Infection on Hepatic and Renal Nuclear Receptor mRNA Expression
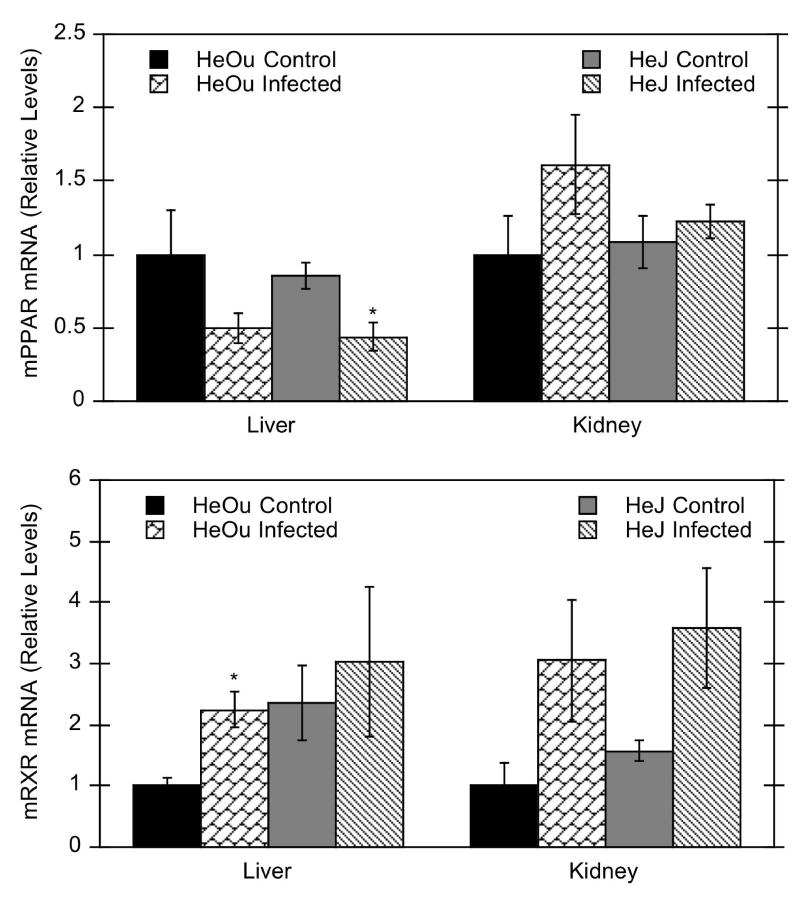
Hepatic peroxisome proliferator activated receptor α (PPARα) mRNA levels tended to decrease in both HeOu and HeJ mice after C. rodentium infection, but this was only statistically significant in the HeJ strain (50% of control) (Fig. 6). In contrast, renal PPARα mRNA levels were unaffected in either strain. Hepatic expression of retinoid X receptor α (RXRα) mRNA, the heterodimer partner of PPARα, tended to increase in both HeOu and HeJ mice (225% and 128% of control), although this parameter was significant only for HeOu mice (Fig. 6). Renal RXRα mRNA levels tended to increase in HeOu and HeJ mice (300% and 230%), although both effects narrowly missed significance (p = 0.067 for HeOu mice and p = 0.056 for HeJ mice).
Figure 6.
Effect of C. rodentium infection on hepatic and renal PPARα and RXRα mRNA expression in HeOu and HeJ mice. Mice were treated with either saline or C. rodentium by oral gavage, and hepatic and renal mRNA expression determined after 6 days. Values are expressed as relative levels of mRNA expression after normalization to GAPDH. Values represent means ± S.E.M. for each group (n = 4 or 6), and designations denote significant differences (p < 0.05) from respective control groups (*).
Effect of C. rodentium Infection on Hepatic Cytokine and Acute Phase Protein mRNA Expression
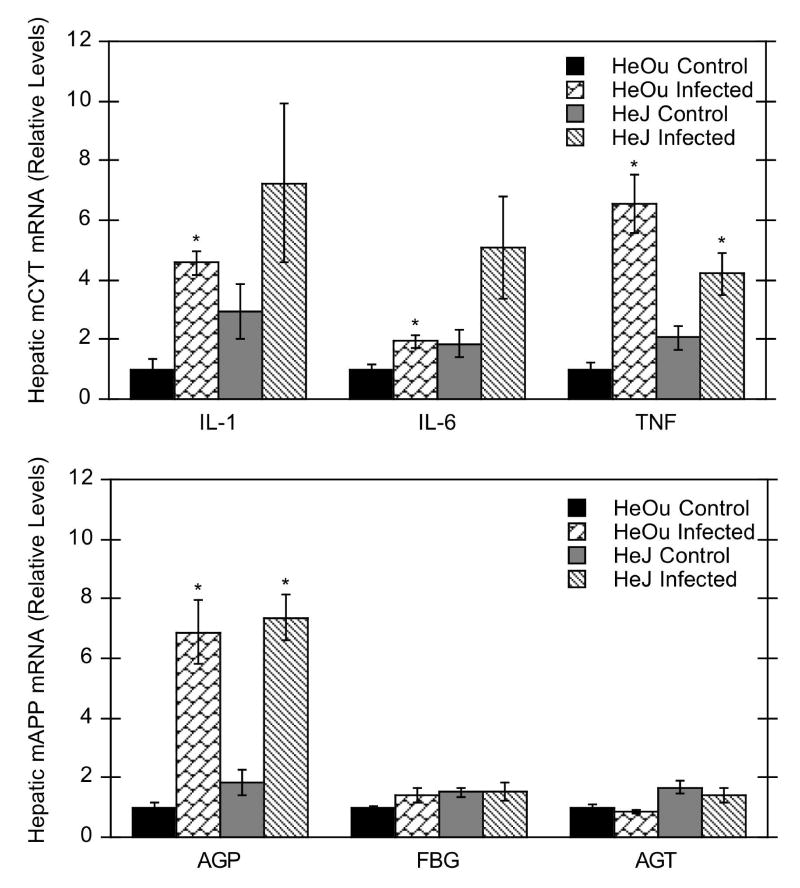
As expected, C. rodentium infection increased hepatic mRNA expression of proinflammatory cytokines and acute phase proteins (Fig. 7). Hepatic mRNA levels of IL-1β (450% of control), IL-6 (193% of control), and TNFα (650% of control) were significantly increased in infected HeOu mice. Similar to HeOu mice, IL-1β and IL-6 tended to increase in HeJ mice, but only TNFα mRNA was significantly increased (200% of control). Hepatic α1-acid glycoprotein (AGP) was induced in infected HeOu (690%) and HeJ (400%) mice, whereas α-fibrinogen (FBG) and angiotensinogen (AGT) were unaffected (Fig. 7).
Figure 7.
Effect of C. rodentium infection on hepatic cytokine and acute phase protein mRNA expression in HeOu and HeJ mice. Mice were treated with either saline or C. rodentium by oral gavage, and hepatic mRNA expression determined after 6 days. Values are expressed as relative levels of mRNA expression after normalization to GAPDH. Values represent means ± S.E.M. for each group (n = 4 or 6), and designations denote significant differences (p < 0.05) from respective control groups (*).
DISCUSSION
Injection of LPS is a well-characterized inflammation model, and treatment of rodents or hepatocytes with LPS suppresses multiple P450 mRNAs and proteins and induces acute phase proteins (Morgan, 2001; Renton, 2004). We hypothesized that the specificity of P450 regulation may be different in live infections than in the LPS model, because other bacterial components may be involved and because the profile, time course, and sources of cytokines affecting the hepatocyte are likely to be dissimilar. To our knowledge, this is the first report investigating hepatic and extrahepatic P450 regulation using C. rodentium as a model of infection. Consistent with our hypothesis, we found that the pattern of hepatic P450 regulation by C. rodentium infection was dramatically different and more enzyme-specific than that produced by LPS. The relatively specific targeting of CYP4A and CYP4Fproteins, that have important roles in metabolism of arachidonic acid and other eicosanoids, supports the concept that CYP regulation in infection may be important in modulating the inflammatory and vascular responses via these metabolites (Morgan, 2001). Furthermore, hepatic P450 mRNA expression was similarly down-regulated in both wildtype (HeOu) and TLR4-mutant (HeJ) mice, indicating that hepatic P450 down-regulation during infection is largely independent of TLR4-LPS signaling. Patterns of renal P450 regulation were different in wildtype mice and TLR4-mutant mice also, and may indicate TLR4 involvement in regulation of renal P450 isoforms.
Hepatic P450 expression during C. rodentium infection is more specifically regulated than in the LPS model of inflammation. Intraperitoneal injection of LPS down-regulates the expression of several mouse hepatic mRNAs, with significant reductions in CYP1A2, 2A5, 2C29, 2E1, 3A11, 4A10, and 4A14 mRNAs at 16 hr (Richardson and Morgan, 2005), and 4F15 and 4F16 mRNAs at 24 hr (Cui et al., 2001). The effect of C. rodentium infection on hepatic P450 mRNAs exhibits both similarities and striking differences with LPS administration. CYP2C29, 3A11, 4A10, 4A14, and 4F15 mRNAs are likewise down-regulated during both LPS exposure (Cui et al., 2001; Richardson and Morgan, 2005) and in infected HeOu mice. CYP1A2, 2E1, 2A5, and 4F16 mRNAs, each down-regulated by LPS, are either unchanged or induced by C. rodentium infection. Notably, hepatic CYP3A13 mRNA expression is unaffected by LPS administration or infection (Fig. 2; Richardson and Morgan, 2005).
Both C. rodentium infection and LPS administration suppress CYP4A10 and 4A14 mRNAs, but CYP4A mRNAs are more affected by bacterial infection as compared to LPS exposure. Infection nearly abolished expression of both CYP4A10 and 4A14 mRNAs (<4% of control), whereas a 16-hr LPS exposure decreased CYP4A10 and CYP4A14 to about 20–30% of control (Richardson and Morgan, 2005). Down-regulation of CYP4A proteins (Fig. 3) during infection was consistent with results for CYP4A mRNAs. Bacterial infection appears to have a far more dramatic effect on CYP4A mRNAs and proteins compared to other P450 subfamilies, These data indicate that exposure to a single bacterial component, LPS, cannot predict the response to a live infection, in which several bacterial components may be a factor.
Most of the hepatic P450 mRNAs studied during infection were significantly down-regulated in both HeOu and HeJ mice, indicating that the effects are TLR4-independent. C. rodentium infection induced hepatic CYP2A5 mRNA to 180% of control in HeOu mice (Fig. 1), but had no effect in HeJ mice, indicating that this up-regulation is dependent on TLR4. Down-regulation of CYP1A2 in HeJ mice could indicate that maintenance of CYP1A2 mRNA levels in HeOu mice is TLR4-dependent also. CYP4F15 was significantly decreased to 48% of control in HeOu mice, and this effect was not apparent in HeJ mice, indicating that the decrease of 4F15 mRNA in HeOu mice is TLR4-dependent (Figs. 1, 2).
Renal P450s during infection also differed significantly from their regulation in the LPS model. Unlike hepatic CYP4A mRNAs, which are down-regulated during inflammation, renal CYP4A mRNAs are induced in both rat and mouse after LPS treatment (Sewer et al., 1997; Barclay et al., 1999; Mitchell et al., 2001). Mouse renal CYP4F15 and 4F16 mRNAs are induced and unaffected by LPS, respectively (Cui et al., 2001). Infection had no significant effect on most renal P450 isoforms in HeOu mice, except for CYP4A10 and 4A14 mRNAs, which were significantly down-regulated. Renal CYP4F15 mRNA is induced after LPS treatment, but remained unchanged during infection, as does CYP4F16 (Fig. 5).
In contrast to HeOu mice, several renal P450 mRNAs in HeJ mice were significantly increased after C. rodentium infection. This may be a compensatory effect for down-regulation of hepatic P450s, as has been suggested for Fasciola hepatica-infected rats with decreased hepatic P450 activities, that also have increased renal P450 activities (Biro-Sauveur et al., 1995). It is unclear why this increase in renal P450s is only seen in HeJ mice, and not in HeOu mice.
C. rodentium infection reduced expression of hepatic CYP4A10 and 4A14 mRNAs to less than 4% of control, and renal expression to 30–40% of control levels. Because CYP4A regulation is mediated by peroxisome proliferator activated receptor alpha (PPARα), it could be surmised that down-regulation of CYP4A mRNA after infection could be due to down-regulation of PPARα mRNA and retinoid X receptor, (RXRα). Hepatic PPARα mRNA was decreased to 50% of control in both HeOu and HeJ mice. Hepatic RXRα levels were significantly increased in HeOu mice and tended to increase in HeJ mice (Fig. 6), unlike the LPS-mediated decrease in RXRα levels (Beigneux et al., 2000). It seems unlikely that the striking down-regulation of hepatic CYP4A10 and 4A14 mRNAs after infection (<4% of control) is due to this modest down-regulation of PPARα mRNA. Surprisingly, renal mRNA levels of PPARα and RXRα both tended to increase after infection. The mechanism for CYP4A mRNA down-regulation in this model requires further study.
Expression of CYP2A mRNAs and proteins is inducible by inflammation, microbial and parasitic infection, and cancer (Montero et al., 1999; Su and Ding, 2004). C. rodentium infection induced hepatic CYP2A5 mRNA to 180% of control in HeOu mice (Fig. 1), but had no effect in HeJ mice, indicating that this effect may be dependent on TLR4. Although the mechanism of CYP2A5 induction remains unknown, hepatic inflammation could be a precursor to induction (Su and Ding, 2004). It has also been suggested that CYP2A5 induction by Helicobacter hepaticus is mediated via increased production of reactive oxygen species (Su and Ding, 2004).
With the exception of CYP3A11, 4A10 and 4F15, basal hepatic P450 mRNAs tended to be higher in HeJ mice compared to HeOu mice (Figs. 1, 2), suggesting that TLR4 may somehow function in regulation of P450 isoforms in the healthy animal. Alternatively, the deficiency of this gene in mouse development could affect P450 expression. We are unaware of any significant genetic difference between the strains, other than TLR4 deficiency, that could explain the difference. Most renal P450 mRNAs in HeJ mice were similar or lower than that in HeOu mice (except CYP1A2 and 2E1). Thus, the influence of TLR4 on basal P450 regulation is both tissue- and isoform-specific.
Down-regulation of multiple P450s during LPS-induced inflammation can be mimicked by in vivo and in vitro treatment with proinflammatory cytokines such as IL-1β, IL-6, and TNFα (Morgan, 2001). C. rodentium infection increased hepatic cytokine mRNAs and α-1-acid glycoprotein in both HeOu and HeJ mice (Fig. 7), indicating activation of Kupffer cells. However, the lack of effect on fibrinogen and angiotensinogen suggests that the level of hepatic inflammation produced during infection is mild. In spite of this, P450 enzymes are sensitive to the resulting hepatic inflammation, particularly the CYP4A isoforms. The mechanism for the selective down-regulation of hepatic P450s during infection and experimental colitis must be investigated further, although cytokine-mediated effects are a likely possibility.
Signaling mechanisms other than TLR4 exist, including signaling through other toll-like receptors such as TLR2 (Yang et al., 1998, 1999), or signaling through the release of bacterial lipoprotein (LP) (Zhang et al., 1997). Human TLR2-transfected HEK 293 cells respond to LPS, require LPS binding protein and CD14, and activate NFκB (Yang et al., 1998, 1999). Bacterial LP induces TNFα and IL-6 production in vivo in LPS-responsive and -nonresponsive mice, and acts synergistically with LPS to induce lethal shock and cytokine production (Zhang et al., 1997). Bacterial culture supernatants containing LP induce IL-6 production in macrophages obtained from LPS-nonresponsive mice (Zhang et al., 1998). Bacterial LP activates TLR2 (Aliprantis et al., 2000), and rodent hepatocytes express TLR2 mRNA that can be upregulated by LPS, and regulated in part by IL-1 and TNFα (Liu et al., 2000; Matsumura et al., 2000). Additional studies are needed to investigate other signaling mechanisms for C. rodentium infection.
In summary, our hypothesis that the specificity of P450 regulation may be different in live infections than in the LPS model was supported by the experimental data. Hepatic inflammation induced by C. rodentium infection is mainly TLR4-independent because hepatic P450 mRNA expression was similarly down-regulated and cytokine mRNAs were similarly induced, in both wildtype and TLR4-mutant mice. In addition, renal P450 expression patterns were different in wildtype mice and TLR4-mutant mice, and TLR4 may be involved in their regulation. The results suggest that the hepatic P450 down-regulation in this model may be cytokine-mediated.
Acknowledgments
We thank Kimberly L. Pierce for excellent technical assistance. The authors also wish to thank Dr. Gary W. Miller, Emory University Center for Neurodegenerative Disease and the Department of Environmental and Occupational Health for the use of equipment.
Footnotes
Reprint requests should be sent to: Dr. Edward T. Morgan, Department of Pharmacology, Emory University School of Medicine, 5119 O. Wayne Rollins Research Center, 1510 Clifton Road NE, Atlanta, GA 30322
The National Institutes of Health Grants GM46897 and DK072372 (ETM), NS44174 (HWS), AR002157 (MS), and AI056067-01 (DK) provided funding for this study. Portions of this work were presented at the 2005 Experimental Biology meeting, San Diego, CA.
References
- Aliprantis AO, Yang RB, Weiss DS, Godowski P, Zychlinsky A. The apoptotic signaling pathway activated by Toll-like receptor-2. EMBO J. 2000;19:3325–36. doi: 10.1093/emboj/19.13.3325. [DOI] [PMC free article] [PubMed] [Google Scholar]
- Altschul SF, Gish W, Miller W, Myers EW, Lipman DJ. Basic local alignment search tool. J Mol Biol. 1990;215:403–410. doi: 10.1016/S0022-2836(05)80360-2. [DOI] [PubMed] [Google Scholar]
- Biro-Sauveur B, Eeckhoutte C, Baeza E, Boulard C, Galtier P. Comparison of hepatic and extrahepatic drug-metabolizing enzyme activities in rats given single or multiple challenge infections with Fasciola hepatica. Int J Parasitol. 1995;25:1193–200. doi: 10.1016/0020-7519(95)00035-z. [DOI] [PubMed] [Google Scholar]
- Beutler B, Du X, Poltorak A. Identification of toll-like receptor 4 (Tlr4) as the sole conduit for LPS signal transduction: Genetic and evolutionary studies. J Endotoxin Res. 2001;7:277–80. [PubMed] [Google Scholar]
- Caradonna L, Amati L, Magrone T, Pellegrino NM, Jirillo E, Caccavo D. Enteric bacteria, lipopolysaccharides and related cytokines in inflammatory bowel disease: biological and clinical significance. J Endotoxin Res. 2000;6:205–214. [PubMed] [Google Scholar]
- Cui X, Kawashima H, Barclay TB, Peters JM, Gonzalez FJ, Morgan ET, Strobel HW. Molecular cloning and regulation of expression of two novel mouse CYP4F genes: expression in peroxisome proliferator-activated receptor alpha-deficient mice upon lipopolysaccharide and clofibrate challenges. J Pharmacol Exp Ther. 2001;296:542–50. [PubMed] [Google Scholar]
- Gobert AP, Cheng Y, Akhtar M, Mersey BD, Blumberg DR, Cross RK, Chaturvedi R, Drachenberg CB, Boucher JL, Hacker A. Protective role of arginase in a mouse model of colitis. J Immunol. 2004;173:2109–2117. doi: 10.4049/jimmunol.173.3.2109. [DOI] [PubMed] [Google Scholar]
- Goncalves NS, Ghaem-Maghami M, Monteleone G, Frankel G, Dougan G, Lewis DJ, Simmons CP, MacDonald TT. Critical role for tumor necrosis factor alpha in controlling the number of lumenal pathogenic bacteria and immunopathology in infectious colitis. Infect Immun. 2001;69:6651–6659. doi: 10.1128/IAI.69.11.6651-6659.2001. [DOI] [PMC free article] [PubMed] [Google Scholar]
- Goosney DL, Gruenheid S, Finlay BB. Gut feelings: enteropathogenic E. coli (EPEC) interactions with the host. Annu Rev Cell Dev Biol. 2000;16:173–189. doi: 10.1146/annurev.cellbio.16.1.173. [DOI] [PubMed] [Google Scholar]
- Haugen DA, Coon MJ. Properties of electrophoretically homogeneous phenobarbital-inducible and beta-naphthoflavone-inducible forms of liver microsomal cytochrome P450. J Biol Chem. 1976;251:7929–7939. [PubMed] [Google Scholar]
- Heid CA, Stevens J, Livak KJ, Williams PM. Real time quantitative PCR. Genome Res. 1996;6:986–94. doi: 10.1101/gr.6.10.986. [DOI] [PubMed] [Google Scholar]
- Higgins LM, Frankel G, Douce G, Dougan G, MacDonald TT. Citrobacter rodentium infection in mice elicits a mucosal Th1 cytokine response and lesions similar to those in murine inflammatory bowel disease. Infect Immun. 1999;67:3031–3039. doi: 10.1128/iai.67.6.3031-3039.1999. [DOI] [PMC free article] [PubMed] [Google Scholar]
- Hoshino K, Takeuchi O, Kawai T, Sanjo H, Ogawa T, Takeda Y, Takeda K, Akira S. Cutting edge: Toll-like receptor 4 (TLR4)-deficient mice are hyporesponsive to lipopolysaccharide: evidence for TLR4 as the Lps gene product. J Immunol. 1999;162:3749–3752. [PubMed] [Google Scholar]
- Jurjus AR, Khoury NN, Reimund JM. Animal models of inflammatory bowel disease. J Pharmacol Toxicol Methods. 2004;50:81–92. doi: 10.1016/j.vascn.2003.12.002. [DOI] [PubMed] [Google Scholar]
- Livak KJ, Schmittgen TD. Analysis of relative gene expression data using real-time quantitative PCR and the 2(-Delta Delta C(T)) method. Methods. 2001;25:402–408. doi: 10.1006/meth.2001.1262. [DOI] [PubMed] [Google Scholar]
- Liu S, Salyapongse AN, Geller DA, Vodovotz Y, Billiar TR. Hepatocyte toll-like receptor 2 expression in vivo and in vitro: role of cytokines in induction of rat TLR2 gene expression by lipopolysaccharide. Shock. 2000;14:361–5. doi: 10.1097/00024382-200014030-00021. [DOI] [PubMed] [Google Scholar]
- Lowry OH, Rosebrough NJ, Farr AL, Randall RJ. Protein measurement with the Folin phenol reagent. J Biol Chem. 1951;193:265–275. [PubMed] [Google Scholar]
- Masubuchi Y, Horie T. Endotoxin-mediated disturbance of hepatic cytochrome P450 function and development of endotoxin tolerance in the rat model of dextran sulfate sodium-induced experimental colitis. Drug Metab Dispos. 2004;32:437–441. doi: 10.1124/dmd.32.4.437. [DOI] [PubMed] [Google Scholar]
- Matsumura T, Ito A, Takii T, Hayashi H, Onozaki K. Endotoxin and cytokine regulation of toll-like receptor (TLR) 2 and TLR4 gene expression in murine liver and hepatocytes. J Interferon Cytokine Res. 2000;20:915–21. doi: 10.1089/10799900050163299. [DOI] [PubMed] [Google Scholar]
- Mitchell SR, Sewer MB, Kardar SS, Morgan ET. Characterization of CYP4A induction in rat liver by inflammatory stimuli: Dependence on sex, strain, and inflammation-evoked hypophagia. Drug Metab Dispos. 2001;29:17–22. [PubMed] [Google Scholar]
- Montero R, Gentile GJ, Frederick L, McMannis J, Murphy T, Silva G, Blankespoor H, Gentile JM. Induced expression of CYP2A5 in inflamed trematode-infested mouse liver. Mutagenesis. 1999;14:217–20. doi: 10.1093/mutage/14.2.217. [DOI] [PubMed] [Google Scholar]
- Morgan ET. Regulation of cytochrome P450 by inflammatory mediators: Why and how? Drug Metab Dispos. 2001;29:207–212. [PubMed] [Google Scholar]
- Nataro JP, Kaper JB. Diarrheagenic Escherichia coli. Clin Microbiol Rev. 1998;11:142–201. doi: 10.1128/cmr.11.1.142. [DOI] [PMC free article] [PubMed] [Google Scholar]
- Okayasu I, Hatakeyama S, Yamada M, Ohkusa T, Inagaki Y, Nakaya R. A novel method in the induction of reliable experimental acute and chronic ulcerative colitis in mice. Gastroenterology. 1990;98:694–702. doi: 10.1016/0016-5085(90)90290-h. [DOI] [PubMed] [Google Scholar]
- Overbergh L, Giulietti A, Valckx D, Decallonne R, Bouillon R, Mathieu C. The use of real-time reverse transcriptase PCR for the quantification of cytokine gene expression. J Biomol Tech. 2003;14:33–43. [PMC free article] [PubMed] [Google Scholar]
- Pan J, Xiang Q, Ball S. Use of a novel real-time quantitative reverse transcription-polymerase chain reaction method to study the effects of cytokines on cytochrome P450 mRNA expression in mouse liver. Drug Metab Dispos. 2000;28:709–713. [PubMed] [Google Scholar]
- Poltorak A, He X, Smirnova I, Liu MY, Van Huffel C, Du X, Birdwell D, Alejos E, Silva M, Galanos C. Defective LPS signaling in C3H/HeJ and C57BL/10ScCr mice: mutations in Tlr4 gene. Science. 1998;282:2085–2088. doi: 10.1126/science.282.5396.2085. [DOI] [PubMed] [Google Scholar]
- Renton KW. Cytochrome P450 regulation and drug biotransformation during inflammation and infection. Curr Drug Metab. 2004;5:235–243. doi: 10.2174/1389200043335559. [DOI] [PubMed] [Google Scholar]
- Richardson TA, Morgan ET. Hepatic cytochrome P450 gene regulation during endotoxin-induced inflammation in nuclear receptor knockout mice. J Pharmacol Exp Ther. 2005;314:703–709. doi: 10.1124/jpet.105.085456. [DOI] [PubMed] [Google Scholar]
- Schauer DB, Falkow S. Attaching and effacing locus of a Citrobacter freundii biotype that causes transmissible murine colonic hyperplasia. Infect Immun. 1993;61:2486–2492. doi: 10.1128/iai.61.6.2486-2492.1993. [DOI] [PMC free article] [PubMed] [Google Scholar]
- Sewer MB, Koop DR, Morgan ET. Differential inductive and suppressive effects of endotoxin and particulate irritants on hepatic and renal cytochrome P450 expression. J Pharmacol Exp Ther. 1997;280:1445–1454. [PubMed] [Google Scholar]
- Su T, Ding X. Regulation of the cytochrome P450 2A genes. Toxicol Appl Pharmacol. 2004;199:285–94. doi: 10.1016/j.taap.2003.11.029. [DOI] [PubMed] [Google Scholar]
- Vallance BA, Deng W, Jacobson K, Finlay BB. Host susceptibility to the attaching and effacing bacterial pathogen Citrobacter rodentium. Infect Immun. 2003;71:3443–3453. doi: 10.1128/IAI.71.6.3443-3453.2003. [DOI] [PMC free article] [PubMed] [Google Scholar]
- Wales AD, Woodward MJ, Pearson GR. Attaching-effacing bacteria in animals. J Comp Pathol. 2005;132:1–26. doi: 10.1016/j.jcpa.2004.09.005. [DOI] [PMC free article] [PubMed] [Google Scholar]
- Weidenbach H, Leiz S, Nussler AK, Dikopoulos N, Bachem M, Buttenschoen K, Reinshagen M, Beger HG, Adler G, Schmid RM. Disturbed bile secretion and cytochrome P450 function during the acute state of experimental colitis in rats. J Hepatol. 2000;32:708–717. doi: 10.1016/s0168-8278(00)80238-x. [DOI] [PubMed] [Google Scholar]
- Yang RB, Mark MR, Gray A, Huang A, Xie MH, Zhang M, Goddard A, Wood WI, Gurney AL, Godowski PJ. Toll-like receptor-2 mediates lipopolysaccharide-induced cellular signalling. Nature. 1998;395:284–8. doi: 10.1038/26239. [DOI] [PubMed] [Google Scholar]
- Yang RB, Mark MR, Gurney AL, Godowski PJ. Signaling events induced by lipopolysaccharide-activated toll-like receptor 2. J Immunol. 1999;163:639–43. [PubMed] [Google Scholar]
- Zhang H, Peterson JW, Niesel DW, Klimpel GR. Bacterial lipoprotein and lipopolysaccharide act synergistically to induce lethal shock and proinflammatory cytokine production. J Immunol. 1997;159:4868–78. [PubMed] [Google Scholar]
- Zhang H, Niesel DW, Peterson JW, Klimpel GR. Lipoprotein release by bacteria: potential factor in bacterial pathogenesis. Infect Immun. 1998;66:5196–201. doi: 10.1128/iai.66.11.5196-5201.1998. [DOI] [PMC free article] [PubMed] [Google Scholar]


