

Abstract
E-selectin plays a role in the binding and extravasation of leukocytes from the bloodstream. The E-selectin gene is rapidly and transiently expressed by endothelial cells activated by inflammatory stimuli. Despite the identification of factors critical for cytokine-induced activation of the E-selectin promoter, little is known about the mechanisms that restrict the gene expression to endothelial cells. We used in vivo approaches to characterize the E-selectin promoter in primary cultures of human umbilical vein endothelial cells and umbilical artery smooth muscle cells. In endothelial cells specifically, nucleosomes are remodeled after tumor necrosis factor (TNF) α induction. Chromatin immunoprecipitation analysis demonstrated the binding of the p65 (RelA) component of nuclear factor-κB (NF-κB) to the endogenous E-selectin promoter after TNFα stimulation along with IκB kinaseα. Multiple coactivators, including p300, steroid receptor coactivator-1, and p300/cAMP-response element-binding protein (CREB)-binding protein (CBP)-associated factor localize differentially to the E-selectin promoter. Additionally, TNFα induced localized histone hyperacetylation, phosphorylation, and methylation in the E-selectin gene specifically in endothelial cells. Post-induction repression of E-selectin expression is associated with recruitment of multiple deacetylases. Collectively, these studies suggest a model for the selective induction of the E-selectin gene in which the core promoter chromatin architecture is specifically modified in endothelial cells.
E-selectin is a member of the selectin family of adhesion molecules that play a central role in the binding and extravasation of leukocytes from the bloodstream into sites of inflammation (for review, see Refs. 1 and 2). E-selectin gene expression is rapidly upregulated upon exposure to inflammatory cytokines such as tumor necrosis factor α (TNFβ)1 (3). The increase in mRNA after the induction is due to an increase in the rate of gene transcription, which is maintained for several hours in the continuous presence of cytokine (4, 5). After removal of TNFα, there is a rapid post-induction transcriptional repression, with gene expression falling to basal levels within 24 h.
Studies of the regulation of E-selectin gene expression have identified promoter elements that regulate inflammatory cytokine inducibility. Sequences within the first 160 bp upstream of the transcriptional start site, the cytokine response region (CRR), are necessary for efficient cytokine-inducible expression of the human E-selectin promoter in transient transfection assays. This promoter region contains binding sites for nuclear factor-κB (NF-κB) and activating transcription factor-2/c-JUN transcription factors as well as the architectural factor, high mobility group I(Y) (HMG-I(Y)) (6–9). Mutations within any of these sites severely reduces or eliminates inducible expression from the E-selectin promoter. The ability of the transcriptional activators to stimulate E-selectin gene expression depends upon their specific spatial arrangement (10) and their ability to recruit a series of coactivators (11, 12). NF-κB inhibition, mRNA degradation, and post-induction repression all play a role in the down-regulation of E-selectin gene expression (4, 13, 14). Despite the identification of factors critical for cytokine-induced activation of the E-selectin promoter, little is known about the mechanisms that restrict the gene expression to endothelial cells. In fact, the activators that regulate the cytokine response region in the E-selectin promoter are broadly expressed, and the proximal promoter of the E-selectin gene is inducible in both endothelial and non-endothelial cells when it is used in promoter-reporter constructs and transient transfection assays.
Mechanisms must exist that allow NF-κB to activate only specific genes in a given cell type. Because the higher order structure of chromatin represents an obstacle to the binding of transcription factors and the formation of preinitiation complexes (for review, see Ref. 15), we hypothesized that chromatin remodeling might be key in controlling the selective induction of many NF-κB-dependent inflammatory genes, including E-selectin (16–19). A second potential mechanism for controlling chromatin structure is selective histone modification. The histone octamers around which genomic DNA is packed can be extensively modified at their N-terminal tails and can serve as signals to regulatory complexes that can either induce or repress expression of the marked region (for review, see Ref. 20). In this way the histone modifications serve as an epigenetic code that indicates a subset of available genes that can be expressed in a given cell in response to a signal (21). Previous studies of NF-κB-dependent gene expression suggest that histone modifications may play a role in the regulation of specific target genes (22–24).
Here we use chromatin immunoprecipitation (ChIP) and nucleosome analysis to demonstrate that the induction of authentic E-selectin gene expression is associated with localized hyperacetylation, phosphorylation, and methylation of histones as well as nucleosome remodeling at the promoter. Neither the localized histone modifications nor the changes in nucleosome positioning take place at the E-selectin locus in vascular smooth muscle cells, suggesting that these chromatin changes are an important part of the endothelial-specific expression of the E-selectin gene.
MATERIALS AND METHODS
Cell Culture and Antibodies
Human umbilical vein endothelial cells (HUVECs) were isolated from fresh human umbilical cords and cultured as described (25). HUVECs were maintained in Medium 199 (Cambrex Corp.) containing 20% fetal bovine serum, 100 μg/ml heparin (Sigma), and 50 μg/ml endothelial growth supplement (Biomedical Technologies, Inc.). Human umbilical artery smooth muscle cells were obtained from Cambrex and maintained according to the supplier’s instructions.
Antibodies were obtained from the following sources: anti-p65 (sc-109), anti-p/CAF (sc-8999), HDAC1 (sc-7872), anti-HDAC2 (sc-7899), anti-HDAC3 (sc-11417), anti-HDAC4 (sc-11418), anti-Sin3A (sc-767), anti-IKKα (sc-7218), anti-IKKβ (sc-7330), c-Rel (sc-272), anti-p52 (sc-298), anti-RNA polymerase II (sc-899), anti-TBP (sc-273), and anti-SRC-1 (sc-6096) (Santa Cruz Biotechnology); anti-p300 (BD Biosciences); anti-diacetyl-H3, anti-phospho-H3-S10, anti-dimethyl-H3-K9, anti-acetyl-H3-K9, and anti-tetra-acetyl-H4 (Upstate Biotechnology); anti-dimethyl-H3-K4 and anti-trimethyl-H3-K4 (Abcam); anti-acetyl-H4-K5, anti-acetyl-H4-K8, anti-acetyl-H4-K12, and anti-acetyl-H4-K16 (Serotec); anti-CBP (a generous gift of D. M. Livingston, Dana-Farber Cancer Institute); anti-Brg-1 (a generous gift of W. Wang, NIA, National Institutes of Health).
Quantitative, Reverse Transcriptase Real-time PCR
Primary cultures of HUVECs at passage 3 were grown to confluence in 10-cm dishes and then treated with 10 ng/ml recombinant, human TNFα (Peprotech) for the indicated time points. Total RNA was harvested using the Absolutely RNA RT-PCR miniprep kit (Stratagene), and the quality was verified on a agarose gel. 500 ng of total RNA was used with the Brilliant SYBR green quantitative RT-PCR master mix (Stratagene). PCR reactions were performed in triplicate with primers to β-actin and E-selectin cDNA (see the sequences in Table I) in separate wells and monitored using a Mx3000P real-time PCR machine (Stratagene). Results are presented as the amount of E-selectin mRNA present relative to the untreated cells and normalized to the level of β-actin mRNA. Specificity of the PCR reaction was verified with dissociation curve analysis, no-template controls, and no-RT controls.
Table I.
Sequences of the primers used for quantitative RT-PCR, ChIP analysis, and CHART PCR
| Primers | Sequence |
|---|---|
| Quantitative RT-PCR | |
| E-selectin | 5′-TGAAGCTCCCACTGAGTCCAA-3′
5′-GGTGCTAATGTCAGGAGGGAGA-3′ |
| β-actin | 5′-GCCGATCCACACGGAGTACT-3′
5′-CATGGAATTCGAACCCAAACA-3′ |
| ChIP quantitative PCR | |
| 5′ | 5′-AGAGCTGTGATGGTCAAGGATGT-3′
5′-CGAGATTCCTTGTTCTACCCAAGT-3′ |
| Primer set A | 5′-GGGAAAGTTTTTGGATGCCATT-3′
5′-TGTCCACATCCAGTAAAGAGGAAAT-3′ |
| Promoter/primer set B | 5′-ACCCACCTGAGAGATCCTGTGT-3′
5′-GGCTGCCCTTATAAAGCGTTCT-3′ |
| CDS | 5′-TGTGAACGAGCTTGGCAAGT-3′
5′-GCTCCAAGCCACCTTTGAAG-3′ |
| 3′ | 5′-TGGCAGGCAGAGGAATGG-3′
5′-CCATTTTCCACACCGCTATGA-3′ |
| CHART PCR | |
| P1 | 5′-GAGACACTACTAACAAGCAAAGTTTTACAA-3′
5′-TGCCTTTATATCGTATATGCAATTTTATTAA-3′ |
| P2 | 5′-TGACATCATTGTAATTTTAAGCATCGT-3′
5′-CCAATGGCATCCAAAAACTTTC-3′ |
| P3 | 5′-ACCCACCTGAGAGATCCTGTGT-3′
5′-GCTTGTACAGATGTGGTTTTTATTAGAAG-3′ |
| P4 | 5′-ATGCTGCCTTAAACATCATGGTAGA-3′
5′-GGAGATAAAACACAAAATGAATTAAAGAAG-3′ |
| β-Actin | 5′-CAGCTCACCATGGATGATGATATC-3′
5′-TGCCGGAGCCGTTGTC-3′ |
Chromatin Immunoprecipitation
Chromatin immunoprecipitations were performed essentially as described (26, 27) with the following changes. Chromatin was harvested from 5 150-mm plates (~2.7 × 10⁷) of passage 4 HUVECs or 10 150-mm plates of vascular smooth muscle cells. Cells were treated for the indicated times with 10 ng/ml TNFα. The cells were then cross-linked with 1% formaldehyde for 10 min at room temperature. Isolated nuclei were subjected to 15 20-s sonication pulses from a Branson Sonifer 250 at the maximum microtip output level. Uniformity of the sonication treatment was confirmed by reversing the cross-linking and running recovered DNA on an agarose gel (data not shown). The chromatin preparation was then divided into 20-μl aliquots, To confirm uniformity, aliquots were subjected to reverse cross-linking and DNA recovery. The quantity of DNA was then compared using real-time PCR. The difference in quantity between aliquots did not exceed 5% (data not shown). Additionally, aliquots from different chromatin preparations were also compared using real-time PCR. The difference in chromatin quantity between chromatin preparations did not differ more than 10% (data not shown).
For each ChIP one aliquot of chromatin was incubated with the indicated antibody overnight at 4 °C. Additionally, an aliquot from the same chromatin preparation was used for a no-antibody negative control. Preblocked protein-A-agarose beads (Roche Applied Science) were added to the binding reaction for 3 h at 4 °C.
Real-time PCR reactions were performed in triplicate with 2 μl of precipitated DNA with and the Brilliant SYBR green quantitative PCR kit (Stratagene). DNA recovered from samples containing an antibody was compared with no-antibody negative controls performed on aliquots from the same chromatin preparation. Additionally, uniformity of the chromatin preparations was confirmed by analyzing the background level of an unrelated genomic locus by real-time PCR. Data are then presented as the amount of DNA recovered relative to the appropriate negative control. In this way, differences between chromatin preparations are normalized. Conclusions are only made about the presence or absence of a particular protein on a stretch of DNA over time. Because each antibody has a different efficiency at binding to its target, no conclusions can be drawn about the relative abundance of proteins on a particular segment of the genome.
CHART-PCR
Nucleosome mapping was performed using chromatin accessibility real-time PCR assays (28). 5 150-mm passage 4 HU-VECs were untreated or treated with 10 ng/ml TNFα for 30, 60, or 120 min. The cells were then harvested and washed in PBS and lysed in 10 mm Tris-HCl, pH 7.4, 10 mm NaCl, 3 mm MgCl2, 0.5% Nonidet P-40, 150 μm spermine, and 500 μm spermidine. The isolated nuclei were then washed in 10 mm Tris-HCl, pH 7.4, 15 mm NaCl, 60 mm KCl, 150 μm spermine, and 500 μm spermidine; then they were resuspended in 700 μl of the same buffer but with the addition of 1 mm CaCl2. 100 μl of nuclei were digested with the indicated amount of micrococcal nuclease (Upstate Cell Signalling Solutions) for 5 min at room temperature. The reaction was stopped by the addition of 10 mm EDTA, 1 mm EGTA, 0.5% SDS, and 75 μg of proteinase K. Genomic DNA was then extracted using the QIAmp kit (Qiagen). 50 μg of DNA from micrococcal nuclease-digested or non-digested control cells was used in real-time PCR with the primer sets listed in Table I. Percent protection was calculated as the amount of DNA recovered from the digested cells relative to the control cells.
RESULTS
TNFα Induces Rapid Expression of the E-selectin Gene
To investigate the sequence of events occurring at the human E-selectin promoter upon induction of the gene by TNFα, we utilized primary cultures of HUVEC cells, which are known to be responsive to inflammatory cytokines. Our group and many others previously demonstrated that upon exposure to TNFα, these cells rapidly express the E-selectin adhesion molecule. To quantitate the induction of E-selectin mRNA in endothelial cells, real-time quantitative RT-PCR was performed. HUVEC cells were exposed to recombinant human TNFα for 0, 5, 15, 30, 60, 120 min and 12 h. Total RNA was collected and used to evaluate the level of E-selectin mRNA relative to the expression level of β-actin (Fig. 1A). Induction of E-selectin gene expression was seen 30–60 min after the addition of TNFα. E-selectin mRNA levels peaked at 11-fold, relative to the untreated cells, at 2 h and then declined. After 12 h of continuous exposure to TNFα, levels of E-selectin mRNA had dropped back down to 4-fold over the levels of resting cells. These data are consistent with other reports of the regulation of E-selectin gene expression (3–5).
Fig. 1.
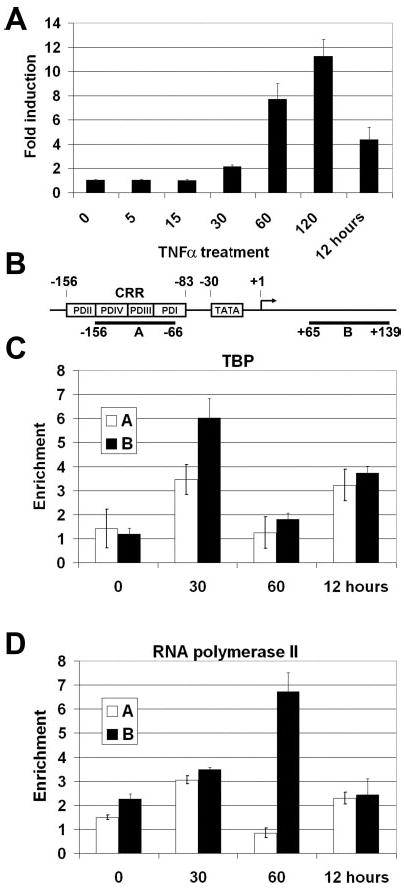
A, relative E-selectin levels as measured by real-time PCR. RNA from HUVECs was collected 0, 5, 15, 30, 60, 120 min and 12 h after stimulation with 10 ng/ml TNFα. 500 ng of total RNA was used in real-time PCR reactions which were evaluated for E-selectin and β-actin levels (n = 3). The E-selectin levels were evaluated relative to time point 0 and normalized to β-actin levels. All reactions were performed in triplicate. B, schematic of the E-selectin promoter. Shown are the locations of the enhancers (PDI-PDIV), the TATA box, and the transcription start site. Locations of the real-time PCR primer sets used for ChIP assays are shown below. C and D, ChIP of TBP (C) and RNA polymerase II (D). Chromatin was extracted from HUVECs 0, 30, and 60 min or 12 h after treatment with 10 ng/ml TNFα and precipitated with antibodies to RNA polymerase II. The recovered DNA was evaluated relative to the negative control by real-time PCR (n = 3).
To correlate the induction of E-selectin gene expression with the binding of RNA polymerase II, we used ChIP assays to evaluate the presence of proteins on the chromatin in vivo. Two primer sets were used for real-time PCR to evaluate the results of the ChIP. Primer set A correlates with the cytokine regulatory region (referred to as CRR throughout the remainder of the paper) at −156/−66, whereas Primer set B corresponds to an area immediately downstream of the transcription start site at +65/+139 (referred to as the downstream region) (Fig. 1B). Although the distance between the two primer sets (131 bp) is smaller than the average chromatin fragments produced during sonication (~1000 bp), the real-time PCR method allowed us to look at the two regions and make logical conclusions about the location of factor binding based on the relative enrichment of each amplified region. The data are presented as the -fold enrichment of target DNA in the antibody containing sample versus that in the negative no-antibody control using the comparative CT method (ABI Prism 7700 Sequence Detection System, User Bulletin 2). The results from the TATA-binding protein (TBP) and RNA polymerase II ChIP show that TBP is maximally detected at the downstream area (primer set B) after 30 min of TNFα treatment and less so by 60 min (Fig. 1C). Likewise, RNA polymerase is observed at the downstream area (primer set B) maximally at 1 h and is then equivalent to basal levels by 12 h (Fig. 1D). This corresponds with the expression data (Fig. 1A). No appreciable polymerase binding is detectable at the CRR at any point.
NF-κB Factors Play a Role in E-selectin Expression Both Early and Late after Induction
The NF-κB dimer is believed to be a critical regulator of E-selectin expression (5, 7–9, 30). To date, however, there has been no direct demonstration that NF-κB interacts in vivo with the promoter of the authentic E-selectin gene.
Using the ChIP technique, we observed that the p65 component of the canonical NF-κB p50/p65 dimer bound mainly to the CRR with peak detection occurring 30 min after TNFα treatment (Fig. 2A). Detection of p65 peaked before maximal E-selectin mRNA accumulation (120 min, Fig. 1) and appeared to be transient, with enrichment levels falling at 60 min. Interestingly, although p50 occurred at the CRR at 30 min, the peak of detection occurred on the downstream region 1 h after treatment (Fig. 2B). Enrichment of p50 is also detected on the CRR 12 h after treatment (Fig. 2B). p50 appears to be present on the E-selectin promoter as p65 levels are diminished or absent. Attempts to identify proteins that are known to interact with p50 such as Bcl-3 were negative (data not shown). Additionally, studies using ChIP for c-Rel and p52 were also negative (data not shown).
Fig. 2. Chromatin immunoprecipitation of activator proteins.
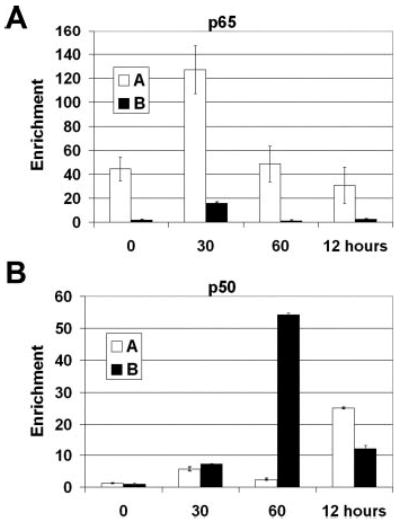
Chromatin from HUVECs was harvested 0, 30, 60 min, and 12 h after stimulation with 10 ng/ml TNFα. The chromatin was precipitated with anti-p65 (A) and anti-p50 antibodies (B). After DNA recovery the precipitates were evaluated by real-time PCR for the level of enrichment over the negative control with the primers shown in Fig. 1B (n = 3).
Multiple Coactivators Localize Differentially to the E-selectin Promoter
Multiple coactivators have been implicated in NF-κB-dependent gene expression (11). We used ChIP analysis to determine whether histone acetyltransferase-containing coactivators associate with the authentic E-selectin promoter during TNFα-induced expression. p300 and cAMP-response element-binding protein (CREB)-binding protein (CBP), closely related histone acetyltransferases with bromodomains for binding to acetylated histone tails, show different patterns of recruitment to the E-selectin promoter. p300 is observed at the downstream region of the E-selectin promoter in HUVECs 30 min after treatment with TNFα (Fig. 3A). In contrast, CBP is minimally detected, and its levels don’t change with induction of E-selectin (Fig. 3B). Like p300, the steroid receptor coactivator-1 (SRC-1), a member of the p160 family of coactivators, is also detected at the downstream region 30 min after TNFα treatment (Fig. 3C).
Fig. 3. Coactivator recruitment to the E-selectin promoter.
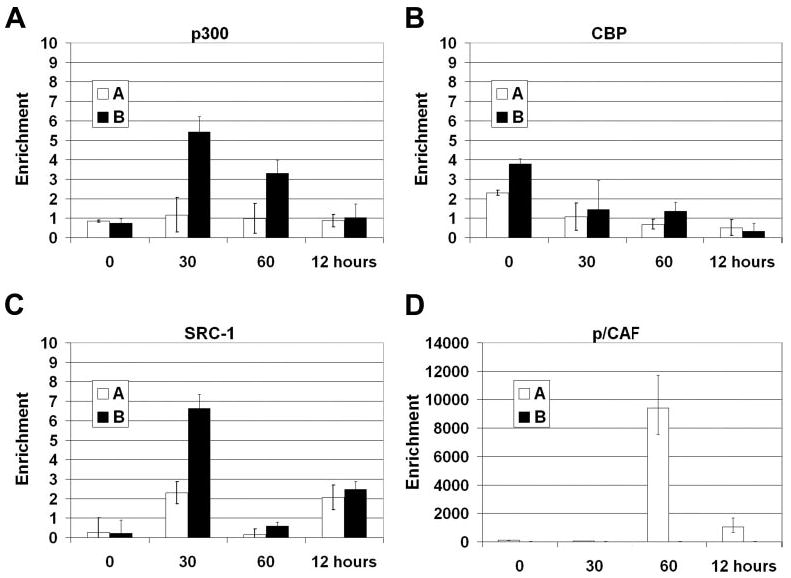
Chromatin from HUVECs was harvested 0, 30, 60 min, and 12 h after stimulation with 10 ng/ml TNFα and precipitated with anti-p300 (A), anti-CBP (B), anti-SRC-1 (C), or anti-p/CAF (D) antibodies. After DNA recovery the precipitates were evaluated by real-time PCR for the level of enrichment over the negative control with the primers shown in Fig. 1B (n = 3). CBP, cAMP-response element-binding protein (CREB)-binding protein.
p300/CBP-associated factor (p/CAF) exhibits a different recruitment pattern from that of p300 or SRC-1. Undetectable on the downstream region at any point, there is a dramatic peak of enrichment of the CRR after ChIP for p/CAF 60 min after TNFα treatment (Fig. 3D). The differences in both time and location of the coactivators recruited to the promoter suggest that at least two distinct coactivator complexes, one containing p300 and another containing p/CAF, participate in the regulation of the E-selectin gene.
The Histones on the E-selectin Gene Are Locally Acetylated on Specific Residues
The H3 and H4 subunits of the nucleosome octamer are capable of undergoing extensive modifications including acetylation, phosphorylation, and methylation (for review, see Ref. 20). The modifications occur in a locus-specific manner in a way that can determine whether an area of the genome is actively transcribed (euchromatic) or silent (heterochromatic). To determine what modifications were taking place on the E-selectin promoter in HUVECs after TNFα treatment, we used various antibodies specific for modified histone tails in ChIP assays and multiple primer sets covering the extreme 5′ region (−2851/−2772), promoter (+65/+139), coding sequence (+7040/+7109), and extreme 3′ region of the E-selectin gene (+13914/+13977) (Fig. 4A).
Fig. 4. Chromatin immunoprecipitation of acetylated H3 histones.
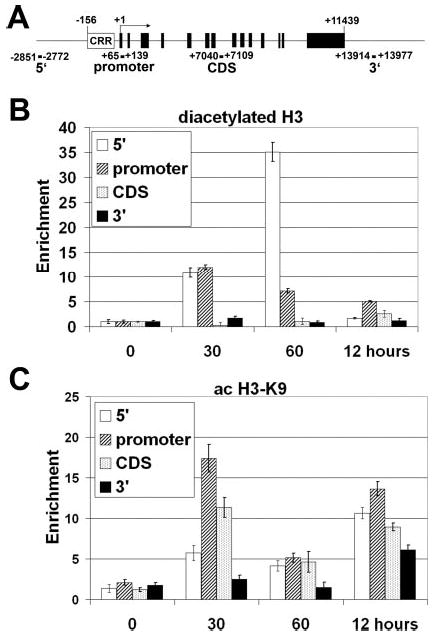
A, schematic of the E-selectin gene. The white box represents the enhancer/promoter region. Black boxes represent exons. Locations of the primers used in evaluating anti-histone modification ChIPs are shown below the line. Chromatin from HUVECs was harvested 0, 30, 60 min, and 12 h after stimulation with 10 ng/ml TNFα. Shown are results from ChIP analysis using anti-diacetyl-H3 (B) or anti-acetylated H3-K9 antibodies (C). After DNA recovery the precipitates were evaluated by real-time PCR for the level of enrichment over the negative control (n = 3).
Acetylation has long been known to associate with actively transcribed genes (31, 32). Antibodies specific for diacetylated H3 (K9 and K14) and tetraacetylated H4 (K5, K8, K12, and K16) reveal a pattern of transient, localized acetylation at the promoter and 5′ regions of the E-selectin gene (Figs. 4B and 5A). Both detect a strong increase in histone acetylation at the 0.5-h time point with maximum detection of the 5′ region at the 1-h mark. In both instances acetylation is more pronounced in the 5′ and promoter regions of the E-selectin gene, indicating a localized effect. It is important to note that the diacetyl-H3 (Fig. 4B) and tetraacetyl-H4 antibodies (Fig. 5A), which preferentially recognize the fully modified tails, do not precipitate E-selectin chromatin at 12 h post-induction.
Fig. 5. Chromatin immunoprecipitation of acetylated H4 histones.
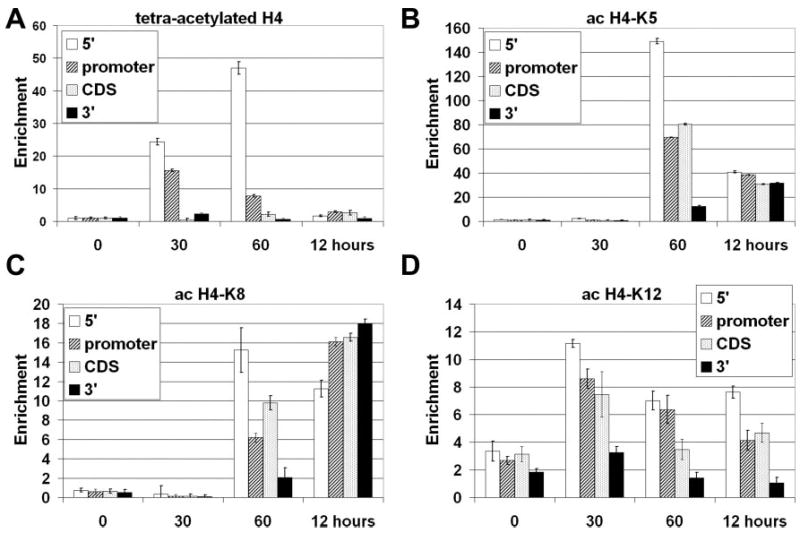
Chromatin from HUVECs was harvested 0, 30, 60 min, and 12 h after stimulation with 10 ng/ml TNFα. Shown are results from ChIP analysis using anti-tetraacetyl-H4 (A), anti-acetyl-H4-K5 (B), anti-acetyl-H4-K8 (C), or anti-acetyl-H4-K12 antibodies (D). After DNA recovery, the precipitates were evaluated by real-time PCR for the level of enrichment over the negative control (n = 3).
Detailed analysis with antibodies that recognize individual acetylation sites on histones H3 and H4 disclose more complex patterns. Acetylated lysine 9 of histone H3 (H3-K9) is observed primarily in the coding sequence and the promoter at 0.5 h and again at 12 h over a broader range of the E-selectin gene (Fig. 4C). Analysis of individual lysines on histone H4 suggests that these residues appear to have different patterns of acetylation and deacetylation. Both lysines 5 and 8 are acetylated at the 60-min time point, and lysine 8 retains acetylation after 12 h, whereas lysine 5 becomes deacetylated (Figs. 5B and C). It is interesting to note that the acetylation of H4-K8 histones appears to spread downstream, from being predominantly on the 5′ end of the gene to being highly enriched throughout the gene (Fig. 5C). H4-K12 appears to be maximally acetylated within 30 min at the promoter, 5′, and coding regions and decrease afterward (Fig. 5D). ChIP analysis of lysine 16 (H4-K16) gave high background levels, and the relative change in this modification appears to be minimal (data not shown).
Histones on the E-selectin Promoter Are Transiently and Locally Phosphorylated
Histone phosphorylation has been shown to mark the promoter of some stimulus-induced inflammatory genes (22). E-selectin possesses this trait, showing H3-S10 phosphorylation in the promoter and coding regions of the gene (Fig. 6A). This phosphorylation is transient, peaking at 30 min post-induction and no longer detectable at 60 min. Primers for the 5′ and 3′ regions of the E-selectin gene failed to show phosphorylation at any time point, indicating that histone H3-S10 phosphorylation is a localized modification of the E-selectin gene.
Fig. 6. Histone phosphorylation and kinase recruitment to the E-selectin promoter.
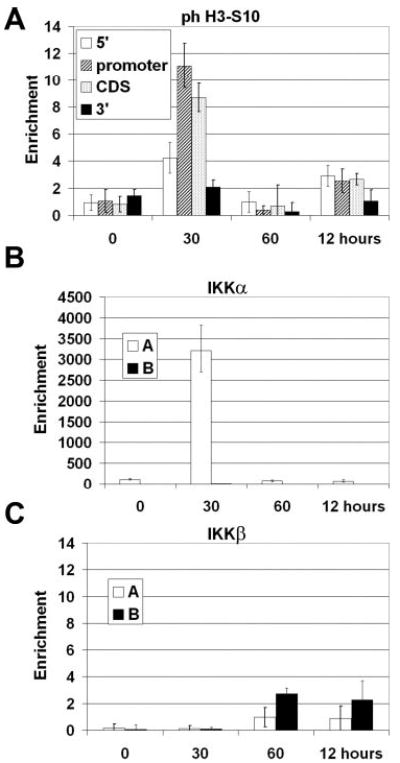
Chromatin from HUVECs was harvested 0, 30, 60, min, and 12 h after stimulation with 10 ng/ml TNFα. A, results from ChIP analysis using anti-phospho-H3-S10 antibody. The purified DNA was evaluated by real-time PCR with the primer sets described in Fig. 4A. B, results from ChIP analysis using the anti-IKKα antibody. C, results from ChIP analysis using the anti-IKKβ antibody. Purified DNA was evaluated by real-time PCR with the primer sets shown in Fig. 1B (n = 3).
Recent evidence points to a role for the IκB kinase α (IKKα) in the modification of chromatin in NF-κB-regulated genes (33, 34). ChIP analysis using an antibody against IKKα revealed dramatic recruitment to the promoter. The kinase was specifically associated with the CRR region of the E-selectin promoter at the 30-min time point and released by 1 h (Fig. 6B) in a kinetic pattern similar to that of p65 (Fig. 2A). To serve as a control, we also used an antibody against IKKβ, another kinase in the NF-κB pathway (for review, see Ref. 35) and were unable to detect significant levels at any point (Fig. 6C). This suggests that there is some specificity in the recruitment of kinases to the E-selectin promoter.
Histone Methylation Leaves a Lasting Mark on the E-selectin Gene
Histone methylation is also an important regulator of transcriptional expression, signaling activation, repression, and silencing of a particular locus (for review, see Ref. 36). To determine what role histone methylation plays in the regulation of the E-selectin gene, antibodies against specific methylated histone tail residues were used in ChIP assays. As expected, no evidence of H3-K9 methylation of the E-selectin gene was observed in endothelial cells (Fig. 7A). H3-K9 methylation serves as a signal for chromatin silencing by recruiting the HP1 protein (heterochromatin protein 1) and is mutually exclusive with H3-K9 acetylation, which was observed (Fig. 4C).
Fig. 7. Chromatin immunoprecipitation of methylated chromatin.
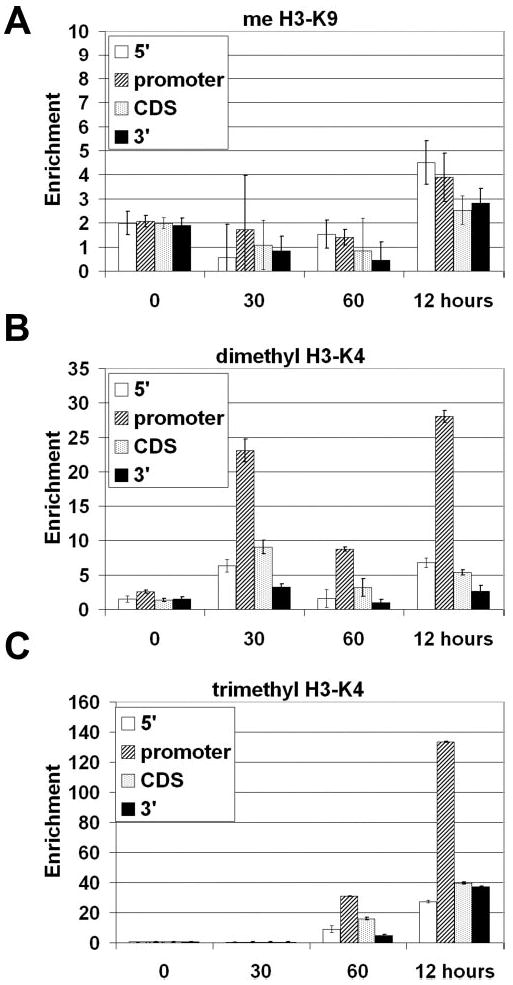
Chromatin from HUVECs was harvested 0, 30, 60 min, and 12 h after stimulation with 10 ng/ml TNFα. Shown are results from ChIP analysis using anti methyl-H3-K9 (A), anti-dimethyl H3-K4 (B), or anti-trimethyl-H3-K4 (C) antibodies. After DNA recovery, the precipitates were evaluated by real-time PCR for the level of enrichment over the negative control using primers described in Fig. 4A (n = 3).
Studies have suggested that trimethylation is found only in actively transcribed genes, whereas dimethylation is found in both silent and active genes (37). We found that upon treatment of HUVECs with TNFα, the H3-K4 residue is dimethylated at 30 min, loses this modification at 60 min, but then regains it at the 12 h mark, primarily within the promoter region (Fig. 7B). This pattern mirrors that of H3-K9 acetylation (Fig. 4C), and it is possible that these two modifications act together to form a post-activation signal. Furthermore, the trimethylated H3 was observed to be highly enriched at the 5′ end of the gene after 12 h, further suggesting a post-activation specific signal that serves to distinctly mark the chromatin (Fig. 7C).
Nucleosomes Are Remodeled in the E-selectin Gene Post-activation
In addition to serving as signaling platforms, histones also regulate gene expression by acting as physical barriers to regulatory factors and the polymerase. This inhibition is overcome by ATP-dependent nucleosome remodeling complexes. We assessed the role of these complexes by performing ChIP assays using an antibody that recognizes both Brg1 and Brm1, the ATPase subunit of the SWI/SNF-remodeling complexes. The results indicate that a SWI/SNF complex is present at the CRR in resting endothelial cells (Fig. 8A). 30 min after induction, the complex became undetectable, only to reappear after 60 min of TNFα treatment at both the CRR and downstream region (Fig. 8A).
Fig. 8. Nucleosome remodeling.

Chromatin immunoprecipitation of Brg1/Brm1. Chromatin from HUVECs was harvested 0, 30, 60 min, and 12 h after stimulation with 10 ng/ml TNFα. A, results from ChIP analysis using an antibody that recognizes both Brg1 and Brm1. After DNA recovery the precipitates were evaluated by real-time PCR for the level of enrichment over the negative control using the primers described in Fig. 1B (n = 3). B, schematic of the E-selectin promoter showing the primer locations for CHART-PCR. C, relative nuclease accessibility of E-selectin in HUVECs versus UASMCs. Nuclei from HUVECs or UASMCs were harvested and treated with 30 units of micrococcal nuclease for 5 min. Then the genomic DNA was purified and quantitated relative to DNA from untreated nuclei using the primers described in B and listed as percent protected (n = 3). HUVECs (D) or UASMCs (E) were treated with 10 ng/ml TNFα for 0, 30, 60, or 120 min then analyzed as above. The results are presented as protection levels relative to cells untreated with TNFα (n = 3). F, relative nuclease accessibility of β-actin in HUVECs versus UASMCs. Experiments were performed as in C (n = 3).
To analyze the nature of the nucleosome position changes that take place on E-selectin, we utilized a technique called CHART-PCR. CHART-PCR evaluates the accessibility of genomic DNA by comparing the quantity of intact DNA from a nuclease-treated sample to that of an untreated sample (28). Toward that end, we analyzed chromatin extracted from HUVECs after they had been exposed to micrococcal nuclease. Chromatin recovered from both micrococcal nuclease-treated and untreated cells was quantitated by real-time PCR at four regions along the enhancer and promoter regions of the E-selectin gene (Fig. 8B). For comparison, we also analyzed the accessibility of the E-selectin gene in umbilical artery smooth muscle cells (UASMCs), which do not express E-selectin. In DNA from HUVECs after micrococcal nuclease treatment we were able to recover only 10–30% of the DNA from the E-selectin promoter as compared with undigested chromatin (Fig. 8C). In contrast, in DNA from UASMCs, 80–100% of the same regions were still intact after micrococcal nuclease treatment (Fig. 8C). This suggests that the E-selectin gene in endothelial cells is more accessible to micrococcal nuclease and, thus, is less covered by histones than in smooth muscle cells.
The same experiments were then performed on HUVECs and UASMCs after they had been treated with TNFα for 0, 30, 60, and 120 min. In HUVECs, the regions immediately upstream of the transcription start site, including the CRR, became more exposed upon treatment with TNFα for only 30 min. The protection levels for the regions covered by primer sets P1 and P2 dropped by 50%, whereas the downstream regions, primer sets P3 and P4 showed a slower decay, dropping to 70% after 2 h (Fig. 8D). However, in UASMCs all regions of the promoter do not exhibit any change in the accessibility of the chromatin, and in the case of the D region may even become more protected upon exposure to TNFα (Fig. 8E). These data indicate that the E-selectin gene undergoes localized, cell-specific nucleosome remodeling upon TNFα treatment.
To confirm that the nuclear preparations from HUVECs and UASMCs are equivalent, CHART-PCR experiments were performed to analyze the chromatin state of a housekeeping gene, β-actin. As shown in Fig. 8F, the level of protection of the β-actin gene is comparable in UASMCs and HUVECs. This is significantly different from the cell type-specific level of protection seen for E-selectin (Fig. 8C). Furthermore, the level of protection of the β-actin gene does not change dramatically in response to TNFα treatment in either HUVECs or UASMCs. This is in dramatic contrast to the further exposure of E-selectin DNA to micrococcal nuclease in HUVECs (Fig. 8D). These results show that the cell type-specific changes in chromatin conformation we observe for E-selectin are in fact gene-specific and not a general condition.
Post-induction Repression of E-selectin Expression Involves Multiple Factors
E-selectin transcription is actively repressed in cultured HUVECs (4). To further investigate negative regulation of the E-selectin gene, we looked at the level of HDACs binding to the E-selectin gene. HDAC2 is recruited to the CRR after 30 min of TNFα treatment and then is no longer detected (Fig. 9A). HDAC3 is detected downstream of the transcription start site but not at the CRR (Fig. 9A). HDACs 1 and 4 are not detected at any time at either position (Fig. 9A). This demonstrates specificity in the recruitment of deacetylases to the E-selectin gene.
Fig. 9. Chromatin immunoprecipitation of histone deacety-lases and Sin3A.
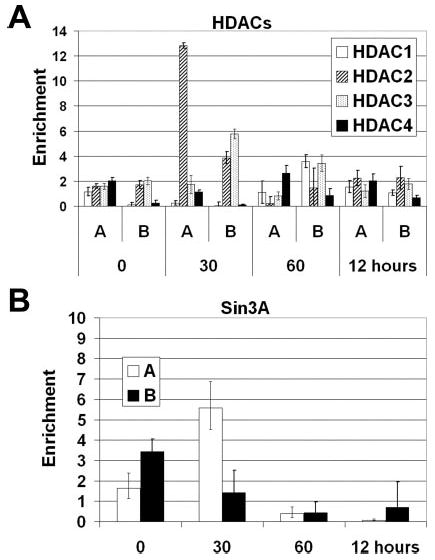
Chromatin from HUVECs was harvested 0, 30, 60 min, and 12 h after stimulation with 10 ng/ml TNFα and precipitated with anti-HDAC1, 2, 3, 4 (A) or anti-Sin3A (B). The recovered DNA was evaluated with real-time PCR using primer set A or primer set B described in Fig. 1B (n = 3).
HDACs are often found in complexes with one another and with scaffold proteins, including Sin3 (38). To determine whether the HDACs we identified as being recruited to the E-selectin gene were part of a Sin3 complex, Sin3A antibodies were used to perform ChIP analysis. We were able to detect Sin3A recruitment to the CRR of E-selectin 30 min after TNFα induction. This is the same time point at which we were able to detect HDAC2 binding to the CRR (region A) of the promoter (Fig. 9B). Collectively, this evidence strongly points to a Sin3A·HDAC2 complex regulating E-selectin gene expression.
Chromatin Changes in the E-selectin Gene Are Cell Type-specific
To determine what is responsible for the cell-specific expression of E-selectin in endothelial cells, chromatin was prepared from primary umbilical artery smooth muscle cells. In the umbilical cord, these cells are in close anatomic proximity to the endothelium, but they cannot be induced by inflammatory cytokines to express E-selectin. We first asked if it was possible to detect any acetylation of histones in the E-selectin locus in response to TNFα in cultured umbilical vein smooth muscle cells. We were unable to detect any change in either histone H3 or H4 acetylation in these cells (data not shown). To our surprise, however, we were also unable to detect methylated H3-K9 nucleosomes (data not shown). This histone modification is associated with silenced chromatin (39, 40). Its absence in vascular smooth muscle cells suggests that the E-selectin gene in these cells is held in a silent state through mechanisms that don’t involve interactions between methylated H3-K9 and HP1 (heterochromatin protein 1).
DISCUSSION
In this paper we provide evidence that the induction of E-selectin gene expression in endothelial cells by an inflammatory cytokine is associated with localized hyperacetylation, phosphorylation, and methylation of histones. These changes are accompanied by coactivator recruitment and chromatin remodeling. Neither the localized histone modifications nor the changes in nucleosome positioning take place is vascular smooth muscle cells.
For purposes of discussion, we propose a model for the induction of E-selectin gene expression in endothelial cells that summarizes some of the findings described in this paper (Fig. 10). In the model of events taking place at the promoter of the gene, a protein is usually represented at the time and in the location where it was maximally detected by ChIP, as determined by the enrichment of either amplicon A or B (Fig. 1B). Moreover, to be cautious with the results of real-time PCR, a 4-fold enrichment was considered the minimum for consideration as a positive result. An enrichment of less than 4-fold could be arrived at by a change in CT of less than one in both the control and experimental sample. Additionally, the histone modifications observed in the promoter region of the gene are depicted with nucleosome remodeling being represented by the disappearance of the nucleosome.
Fig. 10. Schematic representation of the sequence of events that occurs at the E-selectin locus in endothelial cells upon activation with TNFα for 0 min (A), 30 min (B), 60 min (C), and 12 h (D).
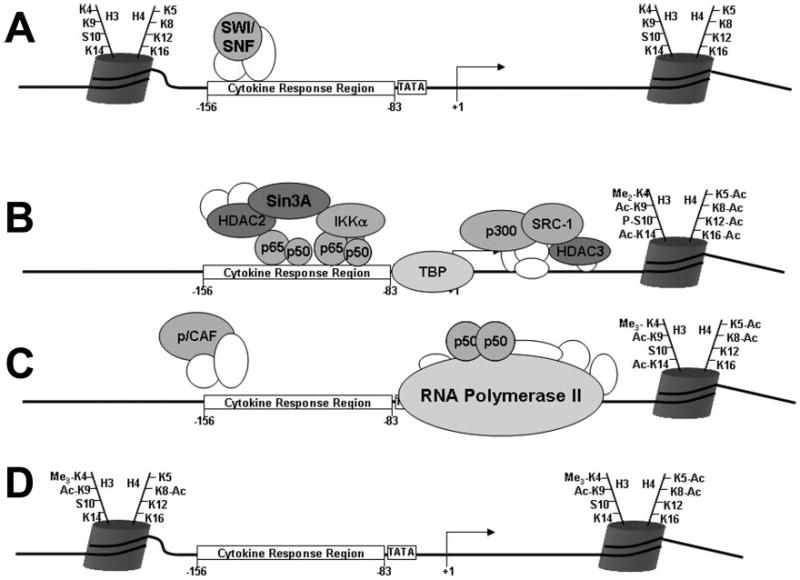
See “Discussion” for details.
Under resting conditions some nucleosomes are found in the promoter, but the CRR of the gene is in a generally open configuration (Fig. 10A). This is consistent with a previous report of a DNase I-hypersensitive site in the proximal promoter region of the E-selectin gene (8). Additionally, the rapid kinetics of the induction of E-selectin are consistent with an accessible regulatory region, which is in contrast to some other κB-inducible genes (e.g. IL-12) that have slower induction kinetics and cryptic NF-κB recognition elements. In quiescent cells histones contained in the E-selectin nucleosomes are unmodified. SWI/SNF is found associated with the CRR of the promoter of the gene in resting cells (Fig. 8A). SWI/SNF complexes remodel nucleosomes and may be primed for the rapid movement of nucleosomes after TNFα induction.
At 30 min after TNFα treatment (Fig. 10B) the SWI/SNF is no longer present, and the p50 and p65 components of NF-κB are found on the CRR along with IKKα (Figs. 2A and B, 6B, and 8A). Although peak detection of p50 occurs elsewhere, the model includes it at 30 min because a large body of evidence exists that the p50/p65 NF-κB heterodimer is the primary composition of NF-κB in endothelial cells and that p50/p65 dimers regulate E-selectin expression (41). TBP is bound to the transcriptional start site (Fig. 1C). At this early time point, there is localized histone acetylation (H3-K9, K14, and H4-K12), methylation (H3-K4), and phosphorylation (H3-S10) in the promoter of the gene (Figs. 4–6). The coactivators SRC-1 and p300 are recruited downstream of the transcription start site (Figs. 3A and C). SRC-1 and other members of the p160 family of coactivators stimulate NF-κB-dependent transcription (11). The intrinsic histone acetyltransferase activity of p300 may be responsible for the acetylation of histones (for review, see Ref. 42) as well as the acetylation of the p65 (43) and the p50 components (44) of NF-κB.
Interestingly, at the 30-min time point (Fig. 10B), when transcription takes place, a HDAC2·Sin3A repressive complex is recruited to the CRR region of the gene, and HDAC3 is found downstream of the transcriptional start site (Fig. 9A). This suggests that this complex may play a role other than histone deacetylation. For example, the HDAC complexes may play a role in regulating p65 acetylation (43, 45, 46).
At 60 min after TNFα treatment, RNA polymerase II has docked on the transcriptional start site of the promoter of the gene (Fig. 10C). There have been dramatic changes in the pattern of histone modification on the promoter of the gene as well as changes in the activation complex. Histone acetylation is diminished on H3-K9, possibly as a result of HDAC3 action, and both the methylation (H3-K4) and the phosphorylation of H3 (H3-S10) have been lost or reduced (Figs. 6A and 7B). The nature of the H3 demethylase and the phosphatase responsible for these changes are unknown. Histone acetylation is more pronounced on H4 (H4-K5 and K8) than found at the earlier time point (Fig. 5). Much of the activation complex observed at 30 min is gone, having been replaced by other factors. On the CRR the p/CAF coactivator is observed (Fig. 3D), possibly accounting for the higher level of H4 acetylation.
The localized detection of p50 at the downstream region of the promoter may reflect cryptic NF-κB binding sites located in this region, or p50 may be bound to other protein factors in a DNA-independent manner. After 12 h this interaction is no longer detected, but p50 is observed at the CRR. This enrichment is higher that what is observed after 30 min, suggesting that multiple p50 subunits bind to the CRR, providing multiple epitopes for antibody recognition. This may indicate that p50/p50 homodimers are involved in post-activation repression of E-selectin, consistent with previous in vitro studies demonstrating that overexpression of p50 suppresses expression of the gene (9, 30). To place these findings in a more general perspective, some of the interesting features of the chromatin modifications of the E-selectin gene will be discussed below based on the type of histone modification.
Acetylation
In the quiescent cultures of primary human endothelial cells and vascular smooth muscle cells levels of modified histones were low in contrast to results with some other established cell lines (47). Additionally, levels of modified histones in endothelial cells were dramatically increased by exposure to TNFα. Many of the histone modifications induced in response to TNFα are localized in the E-selectin gene, similar to the modifications seen in other κB-dependent genes, such as the localized hyperacetylation that occurs during the induction of the interferon-βgene in response to virus infection (48). Also of great interest is the observation that the H3-K9 and H4-K8 residues are acetylated 12 h post-induction. At this time point RNA polymerase is no longer detectable on the promoter, and mRNA levels have dropped to almost basal levels. This would suggest that RNA polymerase II release occurs independently of extensive histone deacetylation.
Previous studies have demonstrated that transcription of the E-selectin gene is actively shut down after TNFα exposure (4, 13, 14). Our data suggest a possible mechanism for this active repression. In our studies, Brg1/Brm1, the ATPase engines of the SWI/SNF chromatin modifying complexes, is weakly observed bound at the E-selectin downstream region in elevated amounts at the 60-min and 12-h time points, when H4-K8 acetylation is detected. Acetylated H4-K8 histone tails mediate the recruitment of SWI/SNF complexes, which can function as inhibitors of transcription (24, 49, 50).
Phosphorylation
As with acetylation, levels of phosphorylated histones such as H3-S10 are dramatically increased in endothelial cells in response to TNFα. This finding is consistent with general proposals that phosphorylated H3-S10 serves as a marker for a subset of inducible genes. This modification has been shown to increase binding of histone acetyltransferase-containing coactivators to the promoter (51, 52). Because these coactivators are a component of RNA polymerase II holoenzyme, H3 phosphorylation can promote recruitment of the polymerase to the promoter.
The nature of the histone kinase mediating H3-S10 phosphorylation in endothelial cells is uncertain. Recent data have described a role for IKKα in the phosphorylation of H3-S10 after NF-κB activation (33, 34). Both IKKα and phosphorylated H3-S10 appear in the E-selectin promoter at the 30-min time point, suggesting that IKKα might be the relevant histone kinase.
Methylation
The N-terminal tails of H3 and H4 can be methylated at several lysine and arginine residues that are linked to either transcriptional activation or repression. For example, methylated H3-K9 provides a specific interaction site for the heterochromatin protein 1 (HP1) proteins, which have been implicated in transcriptional repression and the establishment and maintenance of heterochromatin (39, 40, 53). Interestingly, a common pattern of H3-K9 methylation occurs in a subset of inducible inflammatory genes (23). This pattern is characterized by a rapid loss of constitutive levels of H3-K9 methylation after activation followed by a restoration of methylation concurrent with post-induction transcriptional repression. In the E-selectin gene there are no constitutive levels of H3-K9 methylation, and only a minimal level of this type of methylation was detected at the late time point after TNFα treatment, long after transcriptional termination (Fig. 7A).
Dynamic changes in the methylation of the E-selectin promoter did occur after induction of the gene. Lysine 4 of histone H3 can be di- or trimethylated. Trimethylation is associated with actively transcribed genes, whereas dimethylation is associate with both silent and active genes. Our results show that histone H3-K4 methylation occurs primarily at the promoter region of the gene, a result that is consistent with prior studies (55, 56). This modification persists at the 12-time point. This is consistent with studies suggesting that H3-K4 methylation is a marker of recent transcription (54).
Endothelial-specific Nucleosome Patterning
An interesting result from these studies is that in HUVECs, a cell type that expresses E-selectin, there are nucleosomes that are actively rearranged upon gene induction. This leads to interesting questions. At what point in development is this chromatin arrangement established in endothelial cells? Is there active opening up of the chromatin or active shutting down? Evidence seems to point to the latter. In a study of both murine embryos and embryoid bodies, derived from differentiated embryonic stem cells, E-selectin was differentially regulated during development (57). The earliest endothelial lineage cells did not express E-selectin in the basal state or after stimulation, whereas later stages were characterized by both basal and inducible expression of E-selectin. This developmentally regulated acquisition of E-selectin inducibility during embryogenesis may be the result of changes in chromatin accessibility within the endothelial lineage that could further restrict inducibility of the gene to particular endothelial subpopulations.
With this study we have described for the first time the histone code and chromatin arrangement for a cell-specific, highly inducible, NF-κB-regulated gene. Although initial characterizations of the histone modifications of the IFNβ (24) and the tetraspanin KAI1 promoters (29) have been performed, our study is the first to show cell type-specific alterations in histone pattern and modification. These results reveal possible mechanisms for cell type-specific expression and help to explain how only subsets of genes are expressed in response to activation of a ubiquitous transcription factor.
Acknowledgments
We thank Kay Case and Deanna Lamont for excellent technical skills in HUVEC isolation and culture.
Footnotes
This work was supported by National Institutes of Health Grant HL-45462.
The abbreviations used are: TNF, tumor necrosis factor; HDAC, histone deacetylase; CHART PCR, chromatin accessibility real-time PCR; ChIP; chromatin immunoprecipitation; CRR, cytokine response region; HUVEC, human umbilical vein endothelial cell; p/CAF, p300/CBP-associated factor; IKK, IκB kinase; TBP, TATA-binding protein; RT, reverse transcription; SCR-1, steroid receptor coactivator; UASMC, umbilical artery smooth muscle cell.
References
- 1.Kansas GS. Blood. 1996;88:3259–3287. [PubMed] [Google Scholar]
- 2.Pober JS. Arthritis Res. 2002;43(Suppl):109–116. doi: 10.1186/ar576. [DOI] [PMC free article] [PubMed] [Google Scholar]
- 3.Bevilacqua MP, Stengelin S, Gimbrone MA, Jr, Seed B. Science. 1989;243:1160–1165. doi: 10.1126/science.2466335. [DOI] [PubMed] [Google Scholar]
- 4.Read MA, Neish AS, Gerritsen ME, Collins T. J Immunol. 1996;157:3472–3479. [PubMed] [Google Scholar]
- 5.Whelan J, Ghersa P, Hooft van Huijsduijnen R, Gray J, Chandra G, Talabot F, DeLamarter JF. Nucleic Acids Res. 1991;19:2645–2653. doi: 10.1093/nar/19.10.2645. [DOI] [PMC free article] [PubMed] [Google Scholar]
- 6.Kaszubska W, Hooft van Huijsduijnen R, Ghersa P, DeRaemy-Schenk AM, Chen BP, Hai T, DeLamarter JF, Whelan J. Mol Cell Biol. 1993;13:7180–7190. doi: 10.1128/mcb.13.11.7180. [DOI] [PMC free article] [PubMed] [Google Scholar]
- 7.Lewis H, Kaszubska W, DeLamarter JF, Whelan J. Mol Cell Biol. 1994;14:5701–5709. doi: 10.1128/mcb.14.9.5701. [DOI] [PMC free article] [PubMed] [Google Scholar]
- 8.Schindler U, Baichwal VR. Mol Cell Biol. 1994;14:5820–5831. doi: 10.1128/mcb.14.9.5820. [DOI] [PMC free article] [PubMed] [Google Scholar]
- 9.Whitley MZ, Thanos D, Read MA, Maniatis T, Collins T. Mol Cell Biol. 1994;14:6464–6475. doi: 10.1128/mcb.14.10.6464. [DOI] [PMC free article] [PubMed] [Google Scholar]
- 10.Meacock S, Pescini-Gobert R, DeLamarter JF, Hooft van Huijsduijnen R. J Biol Chem. 1994;269:31756–31762. [PubMed] [Google Scholar]
- 11.Sheppard KA, Rose DW, Haque ZK, Kurokawa R, McInerney E, Westin S, Thanos D, Rosenfeld MG, Glass CK, Collins T. Mol Cell Biol. 1999;19:6367–6378. doi: 10.1128/mcb.19.9.6367. [DOI] [PMC free article] [PubMed] [Google Scholar]
- 12.Merika M, Williams AJ, Chen G, Collins T, Thanos D. Mol Cell. 1998;1:277–287. doi: 10.1016/s1097-2765(00)80028-3. [DOI] [PubMed] [Google Scholar]
- 13.Kluger MS, Johnson DR, Pober JS. J Immunol. 1997;158:887–896. [PubMed] [Google Scholar]
- 14.Chu W, Presky DH, Swerlick RA, Burns DK. J Immunol. 1994;153:4179–4189. [PubMed] [Google Scholar]
- 15.Adelman K, Lis JT. Mol Cell. 2002;9:451–452. doi: 10.1016/s1097-2765(02)00487-2. [DOI] [PubMed] [Google Scholar]
- 16.Agalioti T, Lomvardas S, Parekh B, Yie J, Maniatis T, Thanos D. Cell. 2000;103:667–678. doi: 10.1016/s0092-8674(00)00169-0. [DOI] [PubMed] [Google Scholar]
- 17.Lomvardas S, Thanos D. Cell. 2002;110:261–271. doi: 10.1016/s0092-8674(02)00822-x. [DOI] [PubMed] [Google Scholar]
- 18.Rao S, Gerondakis S, Woltring D, Shannon MF. J Immunol. 2003;170:3724–3731. doi: 10.4049/jimmunol.170.7.3724. [DOI] [PubMed] [Google Scholar]
- 19.Weinmann AS, Plevy SE, Smale ST. Immunity. 1999;11:665–675. doi: 10.1016/s1074-7613(00)80141-7. [DOI] [PubMed] [Google Scholar]
- 20.Fischle W, Wang Y, Allis CD. Nature. 2003;425:475–479. doi: 10.1038/nature02017. [DOI] [PubMed] [Google Scholar]
- 21.Jenuwein T, Allis CD. Science. 2001;293:1074–1080. doi: 10.1126/science.1063127. [DOI] [PubMed] [Google Scholar]
- 22.Saccani S, Pantano S, Natoli G. Nat Immunol. 2002;3:69–75. doi: 10.1038/ni748. [DOI] [PubMed] [Google Scholar]
- 23.Saccani S, Natoli G. Genes Dev. 2002;16:2219–2224. doi: 10.1101/gad.232502. [DOI] [PMC free article] [PubMed] [Google Scholar]
- 24.Agalioti T, Chen G, Thanos D. Cell. 2002;111:381–392. doi: 10.1016/s0092-8674(02)01077-2. [DOI] [PubMed] [Google Scholar]
- 25.Gimbrone MA., Jr Prog Hemostasis Thromb. 1976;3:1–28. [PubMed] [Google Scholar]
- 26.Edelstein LC, Lagos L, Simmons M, Tirumalai H, Gelinas C. Mol Cell Biol. 2003;23:2749–2761. doi: 10.1128/MCB.23.8.2749-2761.2003. [DOI] [PMC free article] [PubMed] [Google Scholar]
- 27.Orlando V, Strutt H, Paro R. Methods. 1997;11:205–214. doi: 10.1006/meth.1996.0407. [DOI] [PubMed] [Google Scholar]
- 28.Rao S, Procko E, Shannon MF. J Immunol. 2001;167:4494–4503. doi: 10.4049/jimmunol.167.8.4494. [DOI] [PubMed] [Google Scholar]
- 29.Baek SH, Ohgi KA, Rose DW, Koo EH, Glass CK, Rosenfeld MG. Cell. 2002;110:55–67. doi: 10.1016/s0092-8674(02)00809-7. [DOI] [PubMed] [Google Scholar]
- 30.Read MA, Whitley MZ, Williams AJ, Collins T. J Exp Med. 1994;179:503–512. doi: 10.1084/jem.179.2.503. [DOI] [PMC free article] [PubMed] [Google Scholar]
- 31.Marushige K. Proc Natl Acad Sci U S A. 1976;73:3937–3941. doi: 10.1073/pnas.73.11.3937. [DOI] [PMC free article] [PubMed] [Google Scholar]
- 32.Caldarera CM, Casti A, Guarnieri C, Moruzzi G. Recent Adv Stud Card Struct Metab. 1975;7:91–97. [PubMed] [Google Scholar]
- 33.Anest V, Hanson JL, Cogswell PC, Steinbrecher KA, Strahl BD, Baldwin AS. Nature. 2003;423:659–663. doi: 10.1038/nature01648. [DOI] [PubMed] [Google Scholar]
- 34.Yamamoto Y, Verma UN, Prajapati S, Kwak YT, Gaynor RB. Nature. 2003;423:655–659. doi: 10.1038/nature01576. [DOI] [PubMed] [Google Scholar]
- 35.Aggarwal BB. Nat Rev Immunol. 2003;3:745–756. doi: 10.1038/nri1184. [DOI] [PubMed] [Google Scholar]
- 36.Sims RJ, Nishioka K, Reinberg D. Trends Genet. 2003;19:629–639. doi: 10.1016/j.tig.2003.09.007. [DOI] [PubMed] [Google Scholar]
- 37.Santos-Rosa H, Schneider R, Bannister AJ, Sherriff J, Bernstein BE, Emre NC, Schreiber SL, Mellor J, Kouzarides T. Nature. 2002;419:407–411. doi: 10.1038/nature01080. [DOI] [PubMed] [Google Scholar]
- 38.Ahringer J. Trends Genet. 2000;16:351–356. doi: 10.1016/s0168-9525(00)02066-7. [DOI] [PubMed] [Google Scholar]
- 39.Bannister AJ, Zegerman P, Partridge JF, Miska EA, Thomas JO, Allshire RC, Kouzarides T. Nature. 2001;410:120–124. doi: 10.1038/35065138. [DOI] [PubMed] [Google Scholar]
- 40.Lachner M, O’Carroll D, Rea S, Mechtler K, Jenuwein T. Nature. 2001;410:116–120. doi: 10.1038/35065132. [DOI] [PubMed] [Google Scholar]
- 41.Collins T, Read MA, Neish AS, Whitley MZ, Thanos D, Maniatis T. FASEB J. 1995;9:899–909. [PubMed] [Google Scholar]
- 42.Berger SL. Curr Opin Cell Biol. 1999;11:336–341. doi: 10.1016/S0955-0674(99)80046-5. [DOI] [PubMed] [Google Scholar]
- 43.Chen L, Fischle W, Verdin E, Greene WC. Science. 2001;293:1653–1657. doi: 10.1126/science.1062374. [DOI] [PubMed] [Google Scholar]
- 44.Deng WG, Zhu Y, Wu KK. J Biol Chem. 2003;278:4770–4777. doi: 10.1074/jbc.M209286200. [DOI] [PubMed] [Google Scholar]
- 45.Ashburner BP, Westerheide SD, Baldwin AS., Jr Mol Cell Biol. 2001;21:7065–7077. doi: 10.1128/MCB.21.20.7065-7077.2001. [DOI] [PMC free article] [PubMed] [Google Scholar]
- 46.Kiernan R, Bres V, Ng RW, Coudart MP, El Messaoudi S, Sardet C, Jin DY, Emiliani S, Benkirane M. J Biol Chem. 2003;278:2758–2766. doi: 10.1074/jbc.M209572200. [DOI] [PubMed] [Google Scholar]
- 47.Martens JH, Verlaan M, Kalkhoven E, Zantema A. Mol Cell Biol. 2003;23:1808–1816. doi: 10.1128/MCB.23.5.1808-1816.2003. [DOI] [PMC free article] [PubMed] [Google Scholar]
- 48.Parekh BS, Maniatis T. Mol Cell. 1999;3:125–129. doi: 10.1016/s1097-2765(00)80181-1. [DOI] [PubMed] [Google Scholar]
- 49.Baker KM, Wei G, Schaffner AE, Ostrowski MC. J Biol Chem. 2003;278:17876–17884. doi: 10.1074/jbc.M209480200. [DOI] [PubMed] [Google Scholar]
- 50.Martens JA, Winston F. Genes Dev. 2002;16:2231–2236. doi: 10.1101/gad.1009902. [DOI] [PMC free article] [PubMed] [Google Scholar]
- 51.Lo WS, Trievel RC, Rojas JR, Duggan L, Hsu JY, Allis CD, Marmorstein R, Berger SL. Mol Cell. 2000;5:917–926. doi: 10.1016/s1097-2765(00)80257-9. [DOI] [PubMed] [Google Scholar]
- 52.Cheung P, Tanner KG, Cheung WL, Sassone-Corsi P, Denu JM, Allis CD. Mol Cell. 2000;5:905–915. doi: 10.1016/s1097-2765(00)80256-7. [DOI] [PubMed] [Google Scholar]
- 53.Hwang KK, Eissenberg JC, Worman HJ. Proc Natl Acad Sci U S A. 2001;98:11423–11427. doi: 10.1073/pnas.211303598. [DOI] [PMC free article] [PubMed] [Google Scholar]
- 54.Ng HH, Robert F, Young RA, Struhl K. Mol Cell. 2003;11:709–719. doi: 10.1016/s1097-2765(03)00092-3. [DOI] [PubMed] [Google Scholar]
- 55.Liang G, Lin JC, Wei V, Yoo C, Cheng JC, Nguyen CT, Weisenberger DJ, Egger G, Takai D, Gonzales FA, Jones PA. Proc Natl Acad Sci U S A. 2004;101:7357–7362. doi: 10.1073/pnas.0401866101. [DOI] [PMC free article] [PubMed] [Google Scholar]
- 56.Schneider R, Bannister AJ, Myers FA, Thorne AW, Crane-Robinson C, Kouzarides T. Nat Cell Biol. 2004;6:73–77. doi: 10.1038/ncb1076. [DOI] [PubMed] [Google Scholar]
- 57.Milstone DS, O‘Donnell PE, Stavrakis G, Mortensen RM, Davis VM. Lab Investig. 2000;80:943–954. doi: 10.1038/labinvest.3780097. [DOI] [PubMed] [Google Scholar]