Abstract
Triatoma guasayana (Wygodzinsky & Abalos) is a secondary vector of Trypanosoma cruzi (Chagas), the etiologic agent of Chagas disease, in the Chaco region of Argentina, Bolivia, and Paraguay. The spatial distribution of T. guasayana in a rural community in northwestern Argentina is described and analyzed using very high spatial resolution satellite imagery, geographic information systems, and spatial statistics. Since a 1992 residual spraying with insecticides of all houses, site-specific domestic and peridomestic reinfestations by triatomine bugs were monitored using various methods semiannually from 1993 to 2002. The reinfestation by T. guasayana started with finding of only adult bugs in a few sites. Bug abundance was significantly clustered and predominantly peridomestic in the southern and northern extremes of the community. The identified source of reinfestation in the northern cluster was a colonized wood pile, whereas no potential peridomestic source was found for the southern cluster. The spatial distribution of T. guasayana was positively associated with the abundance and spatial distribution of goats. Active dispersal from the hypothesized source and the surrounding sylvatic environment, and passive transport of bugs in wood piles seems to be the most likely mechanisms underlying the observed spatial pattern of T. guasayana. The absence of domestic colonization indicates that, to date, there is no trend toward increased local domiciliation of T. guasayana. The clustering zones can be considered “hot spots” where bug invasion from other sources is expected to be higher and where eventually, introduction of sylvatic T. cruzi to suitable hosts may occur.
Keywords: spatial clustering, spatial statistics, Triatoma guasayana, Chagas disease, vector
Chagas disease (American trypanosomiasis), caused by Trypanosoma cruzi (Chagas) and transmitted by triatomine bugs, is one of the most important vector-borne diseases in Latin America, with an estimated 11 to 12 million people infected and 100 million people at risk of infection (Schofield and Dias 1999). The only effective strategy used to interrupt the vector transmission of T. cruzi is the elimination of triatomine bugs in domiciliary areas. But the elimination of Triatoma infestans (Klug), the major vector in the southern cone countries, may lead to the domiciliation of sylvatic triatomine species that were not targets of control actions (Dias 1988, Diotaiuti et al. 1995). Hence, the study of emerging triatomine vector species with high tendencies to invade and colonize human habitations is relevant.
Triatoma guasayana (Wygodzinsky & Abalos) is considered a potential substitute for T. infestans in the Chaco region of Argentina, Bolivia, and Paraguay because it is frequently found to be infected by T. cruzi (Cecere et al. 1999; Noireau et al. 1999, 2000); actively invades human habitations (Gürtler et al. 1999); feeds on humans, dogs, and cats (Wisnivesky-Colli et al. 1993, Gajate et al. 1996); and was found associated with the occurrence of T. cruzi-infected young dogs after the residual application of pyrethroid insecticides (Castañera et al. 1998). Furthermore, T. guasayana has been suggested as the main sylvatic vector of T. cruzi in parts of the dry Chaco region (Wisnivesky-Colli et al. 1997, Noireau et al. 1999). Because there is no evidence of vector transmission of T. cruzi to humans by T. guasayana, this species is not considered a target for control at present. In the sylvatic environment, T. guasayana is found aggregated in low numbers mainly in dry cacti, bromeliads, and fallen logs (Carcavallo and Martinez 1985, Wisnivesky-Colli et al. 1997, Noireau et al. 2000, Vezzani et al. 2001). In peridomestic areas, the main ecotopes of T. guasayana are goat or sheep corrals, wood piles, and fences made with branches (Canale et al. 2000). Neither the association between T. guasayana and its main peridomestic hosts (goats, pigs, and chickens) nor its spatial distribution within a rural community after insecticide spraying has been reported previously.
The application of geographic information systems (GISs), satellite imagery, and software for spatial statistics allows for the consideration of the spatial component in the epidemiology of vector-borne diseases, and the development of predictions of the potential distribution of arthropod vectors and the risk of transmission of pathogens (Clarke et al. 1996; Kitron 1998, 2000; Hay et al. 2000). One such spatial analysis tool is point pattern analysis (PPA), a set of spatial statistics that is applied to determine whether the distribution of data points is random and to infer the process that may have generated the observed pattern (Boots and Getis 1988). PPA has been successfully applied to determine the patterns and underlying mechanisms of disease clustering (Kitron 1998, 2000; Robinson 2000; Cromley and McLafferty 2002; Cecere et al. 2004).
As part of a larger project on the ecoepidemiology and control of Chagas disease, our objectives were to describe and analyze the spatial distribution of T. guasayana in a rural community over the 10 yr that followed a residual spraying with insecticides, by using GIS, very high spatial resolution satellite imagery, and spatial statistics, and to identify factors and mechanisms underlying the observed patterns.
Materials and Methods
Study Area and Field Surveys
Field studies were carried out in the rural village of Amamá (27° 12′ 33″ S, 63° 02′ 10″ W), Province of Santiago del Estero, Argentina. The community is located in a semiarid plain with hardwood forest undergoing intensive exploitation and included 59 houses distributed in 140 ha (Fig. 1). The area and the history of infestation by T. infestans and other triatomine species have been described previously (Gürtler et al. 1999, Canale et al. 2000, Cecere et al. 2002).
Fig. 1.
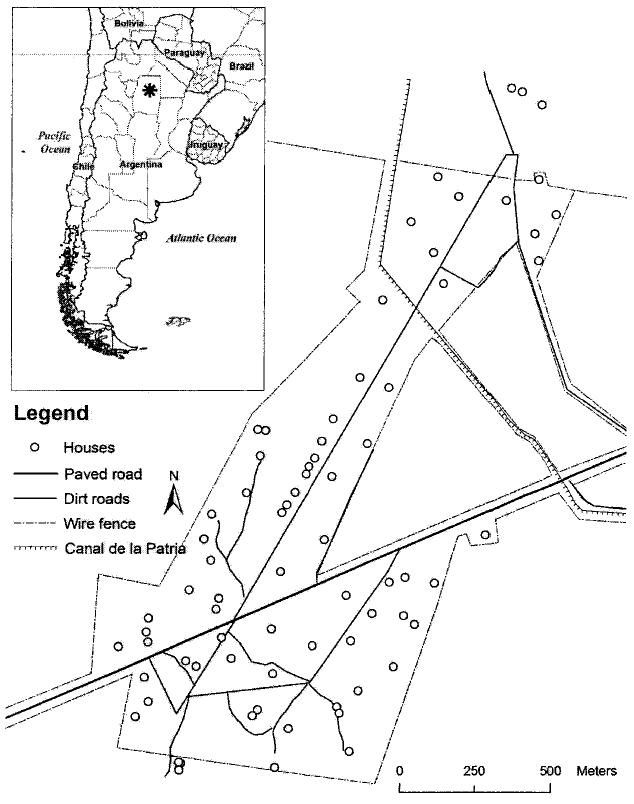
Location of study area. Map of Amamá houses, roads, canal, and fence. Inset shows location of Amamá and Santiago del Estero province.
Most houses are made of adobe walls and thatched roofs, with one or two adjacent bedrooms and a front veranda 5–10 m in width. These areas share a common roof and are referred to hereafter as domestic or domiciliary areas. Poultry, pigs, and goats are usually raised for subsistence in the compound around the domiciliary area. This peridomestic environment includes storerooms, chicken coops, and corrals (Canale et al. 2000). All houses were identified with a numbered plaque and mapped in 1992. New and abandoned structures are continuously recorded.
All houses of Amamá and neighboring villages were sprayed with deltamethrin following standard procedures by the National Chagas Service (NCS) in 1985 (Gürtler et al. 1994) and in 1992 (Cecere et al. 2002). In October 1992, all dead triatomine bugs that were found 24 h postspraying in the domiciles were collected (knockdown method, KD) (Cecere et al. 2002). The surveillance phase spanned from December 1992 to October 2002 and included a strong community participation component (Gürtler et al. 1999, Cecere et al. 2002). From 1993 to 1995, only sites with at least one T. infestans bug (not other triatomine species) were treated selectively with deltamethrin by NCS staff. Surveillance activities were transferred to the communities from late 1995 to May 1996. Since 1996, the capture of one T. infestans of any stage resulted in spraying of domiciles and all peridomestic sites of the infested house by householders.
All domestic and peridomestic sites of Amamá were searched for triatomine bugs from October 1993 to October 2002. The vector collection methods used were described by Gürtler et al. (1999). Briefly, the reinfestation was evaluated by skilled bug collectors from NCS by using 0.2% tetramethrin (Icona, Buenos. Aires, Argentina) as an irritant agent (timed manual collections, TMC, or flushing-out method), house-holders’ collections (HD), and domestic sensor boxes (SB) (Biosensor, Biocientífica de Avanzada, Buenos Aires, Argentina) placed in bedroom areas. In peri-domestic areas, the search was performed by TMC (one-half person per hour per house) nearly every 6 mo, whereas in the domiciles TMC (one person per hour per house) were performed every spring (October–December). HD and SB data were recorded every 6 mo. All triatomine bugs collected were identified to species and stage at the field laboratory as described previously (Canale et al. 2000).
Mapping and Geospatial Processing
An Ikonos satellite image (Space Imaging, Atlanta, GA) of the study area taken in October 2002 (spatial resolution 1 m2 panchromatic and 4 m2 multispectral) was georeferenced using global positioning system (GPS, Trimble GeoExplorer II, Sunnyvale, CA) readings and then used to digitize the location of the 636 surveyed sites, vegetation and other landscape features. A sketch map of each house with the distance of surveyed sites to the domicile was drawn for almost every date of evaluation. The sketch maps were then used to digitize structures that were surveyed but not visible in the satellite image by using ArcGIS 8.1 (ESRI, Redlands, CA). The map was then projected in Universal Transverse Mercator (UTM), Zone 20S, WGS1984 datum. The distance matrix from all the digitized structures was associated with the entomological database of Amamá.
Statistical Analyses
The association between the presence of a T. guasayana-infested site and the occurrence of other infested sites within 250 m was assessed using the Fisher exact test. The Wilcoxon ranked test was applied to determine the association between the number of T. guasayana bugs collected by householders and the distance to the wire fence.
Global spatial statistics were used to detect the presence of a spatial clustering anywhere within the study area. The null hypothesis (no clustering exists) is tested first by considering the locations of infested sites in comparison with locations of all sites (K-function, Ripley 1976) and then by considering also the number of T. guasayana at each site (weighted K-function, Getis 1984). Local spatial statistics identify the precise location of clusters or “hot spots” by comparing the values (e.g., number of bugs) at all locations j within specified distances (d) of the location i under consideration, either including [Gi*(d)] or excluding [Gi(d)] the value at the point under consideration (Getis and Ord 1996):
where Wij(d) is a spatial weights matrix with values of 1 for all links within distance d of a given i. When calculating significance level, adjustment for multiple testing is made (Getis and Ord 1996).
Gi(d) also can be used as a focal spatial statistic to detect spatial clustering around known and suspected sources and to calculate the range of distances over which such clustering occurs (Kitron et al. 1992, Clennon et al. 2004). The suspected sources considered were the first high-density colonies found in Amamá in May 1995 (a wood pile and a goat corral). The number of T. guasayana collected in time t in the suspected source of infestation was incorporated into the database of the following years (t + 1) up to six survey dates later (t + 6) and evaluated as a potential source for further infestations by using Gi(d) (Cecere et al. 2004, Clennon et al. 2004). In this way, we represented the spread of bugs from the suspected source adding a time delay in the detection of new infestations. All spatial analyses were performed using the PPA software (San Diego State University, San Diego, CA, http://www-rohan.sdsu.edu/≈aldstadt/tools.htm).
The spatial distribution of goats, pigs, and chickens per house was mapped using the simple Kernel density function (Silverman 1986) with the ArcGIS Spatial Analyst extension (ESRI). This function was chosen because goats, pigs, and (less frequently) chickens can be found at night in the forest that surrounds the peridomestic compound, and their local density can be expressed as a decreasing function of the distance to the house.
The association between the total number of T. guasayana per compound in 1993–2002 and the median number of goats/sheep, pigs, and chickens per house in the same period was analyzed with a multiple linear regression (Zar 1996). The same regression was performed again with the independent variables spatially filtered (Getis 1995). The rationale for the spatial filtering is to adjust the spatially dependent variables only to the point where spatial dependence is not longer embodied in them (Getis 1995). Each independent variable is decomposed into two new variables that describe the spatial component (association among location of houses) and the nonspatial component (association among the number of hosts per house) that are included in the regression model. To successfully perform the spatial filtering of each variable, it is necessary to determine the distance at which the spatial dependency is lost. This filtering distance is the value that corresponds to the maximum absolute sum of the values of Gi(d) for all i observations of each variable (Getis 1995). For each host species, the spatial filtering distances were 350 m for goats, 500 m for pigs, and 1,000 m for chickens.
For all collection methods, the term “infested” or “positive” meant finding at least one live or moribund T. guasayana, whereas “colonized” meant the finding of at least one nymph of T. guasayana. Peridomestic sites were divided into frequent (in which T. guasayana was found in at least 5% of the surveyed sites) and infrequent (in < 5% of surveyed sites) according to Canale et al. (2000). Given the decrease in house-holders’ collections of T. guasayana from 1996 to 2002 (possibly because of increased awareness that T. guasayana was not the target of control actions) and the dependence of bug collections on householders’ motivation (Gürtler et al. 1999), we considered in the spatial analyses only timed manual collections and sensor boxes’ collections in domiciles, but not house-holders’ collections. However, householders’ collection data from 1993 to 1995 were mapped to explore the spatial pattern of house invasion by T. guasayana.
Results
Temporal and Spatial Patterns of Reinfestation
In total, 175 T. guasayana was collected by TMC during 1993–2002, including only 10 adult bugs from domiciles (Table 1). Most of the T. guasayana (68%) were collected in goat or sheep corrals, wood piles, and fences. After detecting no T. guasayana infestation in 1993 and 1994, prevalence increased to 14% in May 1995 and to 22% in December 1997. After the peak of insecticide spraying in December 1997, prevalence declined and remained below 8% from May 1998 through October 2002 (Fig. 2A). The temporal infestation pattern of goat or sheep corrals accounted for the increase in overall infestation from 1995 to 1997 (4 –22%), whereas infestation in fences and wood piles decreased from 2 and 8%, respectively, to 0% (Fig. 2A). Few of the main ecotopes of T. guasayana were sprayed with insecticides, and sprays were clustered in May 1997, between November 1997 and May 1998, and 2002. The mean catch of T. guasayana in goat corrals remained high over time (one to six bugs) compared with fences or wood piles, which peaked (10 and eight bugs, respectively) only in November 1995 (Fig. 2B). Seven eggs and four first instars from an unidentified sylvatic triatomine species (probably Triatoma garciabesi Carcavallo et al. or T. guasayana) were collected by SB in domiciles during 1993–2002.
Table 1.
Prevalence of infestation and number of colonies of T. guasayana in domiciles and peridomestic ecotopes (Amamá, 1993–2002)
| No. examined | No. infested | No. colonies (%) | Total no. of T. guasayana collected | |
|---|---|---|---|---|
| Domicile | 707 | 6 (0.8) | 0 | 10 |
| Frequent peridomestic ecotopes | ||||
| Fence | 36 | 3 (8.3) | 3 | 10 |
| Goat corral | 308 | 19 (6.2) | 18 | 73 |
| Wood pile | 139 | 8 (5.8) | 7 | 36 |
| Infrequent peridomestic ecotopes | ||||
| Chicken coop | 222 | 7 (3.2) | 6 | 10 |
| Pig corral | 408 | 8 (2.0) | 7 | 12 |
| Cow/horse corral | 102 | 2 (2.0) | 1 | 3 |
| Storeroom | 354 | 4 (1.1) | 3 | 7 |
| Latrine | 250 | 2 (0.8) | 1 | 2 |
| Tree | 899 | 5 (0.6) | 3 | 12 |
| Total | 3,425 | 64 (1.0) | 49 | 175 |
Fig. 2.
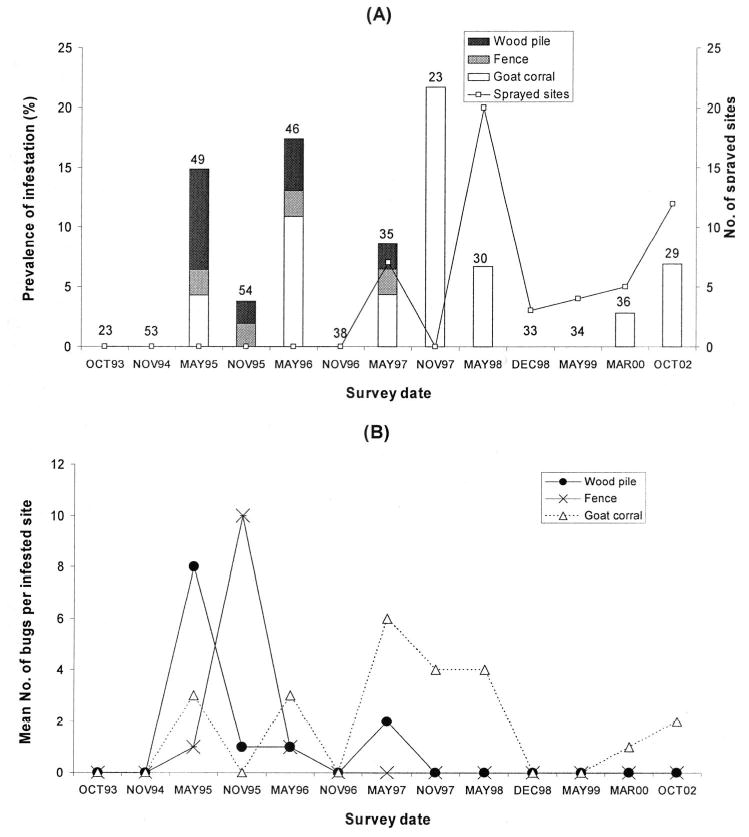
(A) Prevalence of infestation by T. guasayana in frequent peridomestic ecotopes (wood piles, fences, and goat corrals) and number of frequent sites sprayed with pyrethroid insecticides. Numbers on top of bars refers to the total number of frequent sites surveyed. (B) Mean number of T. guasayana per positive site assessed by TMCs. Amamá, 1993–2002.
T. guasayana infestations were first detected in the initial survey conducted 12 mo after spraying (1993) when only adults were collected in three domiciles in northern and central Amamá and in one chicken coop in the southern extreme (Fig. 3). The first colonies were detected in May 1995 (31 mo postspraying). When we considered temporal patterns, the presence of a T. guasayana-infested site was not significantly associated with the occurrence of other infested sites within 250 m during one of the two subsequent surveys (Fisher tests for each date, P > 0.05). Given this absence of temporal dependence, we pooled site-specific bug abundance data for all surveys to analyze the global spatial pattern of infestation.
Fig. 3.
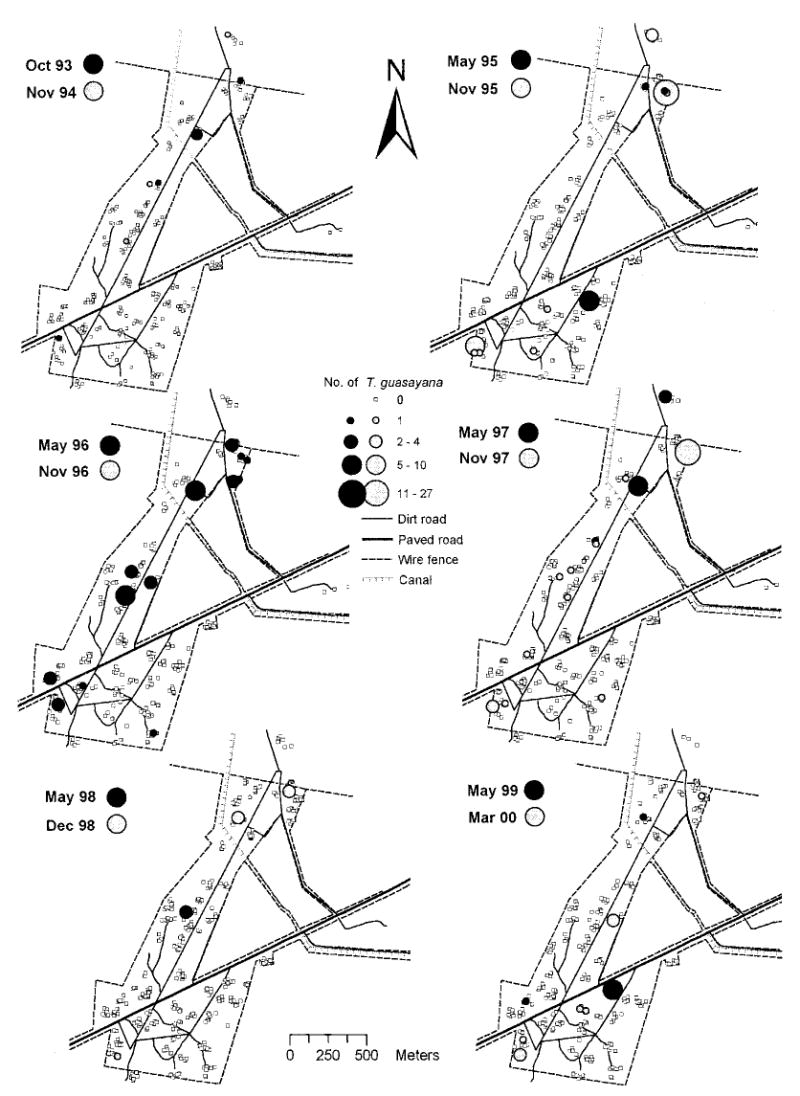
Number of T. guasayana collected per site by TMCs. Amamá, 1993–2000.
The global pattern of aggregation of T. guasayana infestations showed no clustering of all sites and significant clustering of infested sites. The maximum distance at which a spatial association of infested sites was detected was 500 m, and clustering peaked at 165 m (K-function). When the spatial distribution was weighted with the abundance of T. guasayana per site (weighted K-function), the maximum distance at which aggregation occurred was reduced to 125 m; this is the mean distance between peridomestic sites belonging to the same house or to immediately neighboring houses. When performing the same analysis with the abundance of T. guasayana per compound (i.e., pooling all data for domestic and peridomestic sites belonging to the same house), the global spatial clustering disappeared and the infestation pattern did not differ from a random distribution. This indicates that the association is indeed limited to the within-compound level.
To identify clusters of sites with high abundance of T. guasayana, we applied the Gi*(d) statistic and found two significant clusters, one in the northern and one in the southern extremes of Amamá [Gi* (d) > 3.71, P < 0.05]. At the northern extreme, clustering was highest at a distance of 400 m and was significant up to a distance of 1,000 m (Fig. 4), whereas for the southern extreme, clustering was much more localized, peaking at 100 m and remaining significant only up to 150 m. When the analysis was conducted at the compound level, the same clustering was noted [Gi*(d) > 3.71, P < 0.05] but only up to a maximum distance of 400 m for the northern and 150 m for the southern extreme (not shown). The same analysis was performed for the frequent ecotopes (goat corral, fence, and wood pile), and again the same patterns of clustering in northern and the southern Amamá were evident, at maximum distances of 500 and 100 m, respectively (not shown).
Fig. 4.
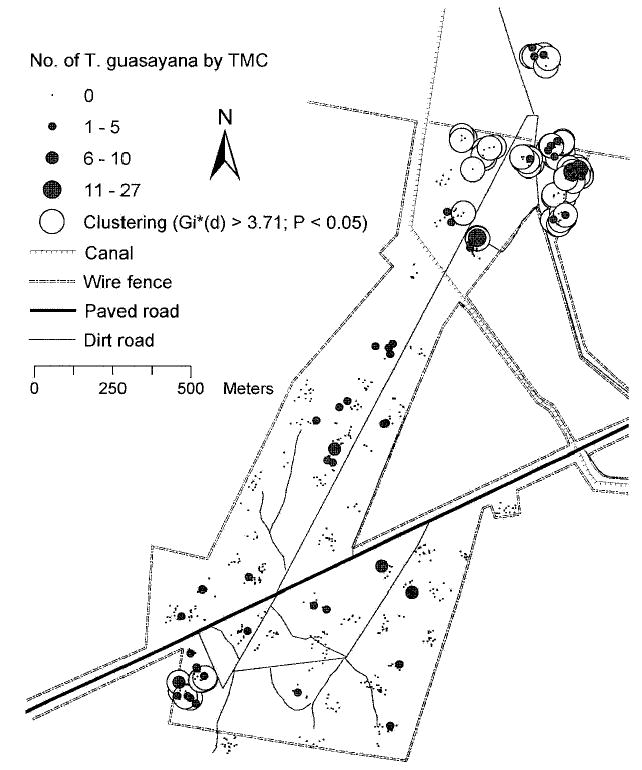
Total number of T. guasayana collected per site by TMCs during the period 1993–2002 and significant clusters [Gi*(d) > 3.71, P < 0.05] of high bug density per site. Amamá, 1993–2002.
Potential Sources of Reinfestation
To test whether each cluster may have originated through active dispersal of bugs from a high-density site (suspected source), we performed a focal analysis taking a wood pile in the northern area (with 27 T. guasayana in May 1995) and a goat corral in the southern area (with five bugs in May 1995) as hypothesized sources of reinfestation. For the northern area, infestation from May 1996 to December 1998 was significantly clustered around the wood pile [Gi(d) > 2.44, P < 0.05], with peak clustering occurring within 100 m (at the compound level), but continuing up to a distance of 400 – 600 m for most years, and up to 1000 m in 1997 (Fig. 5A). In the southern area, there was no significant clustering around the suspected source during any of the monitoring periods (Fig. 5B).
Fig. 5.
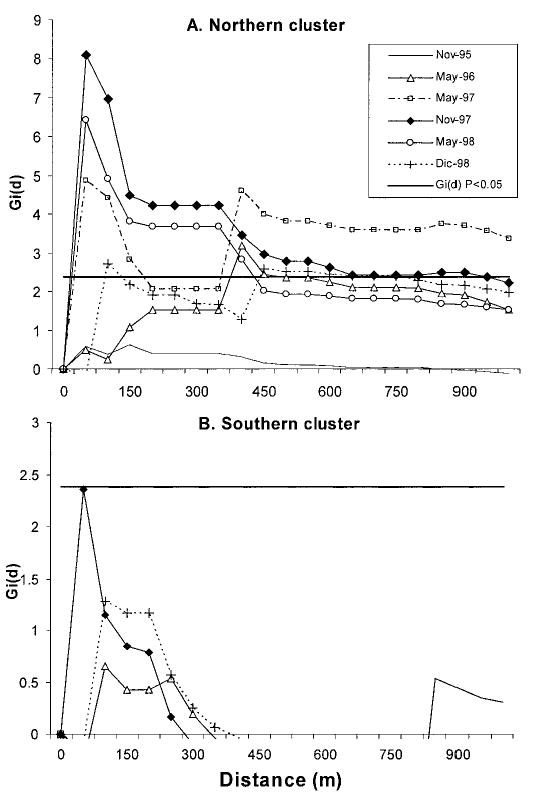
Focal clustering [Gi (d)] performed on the northern cluster (A) (a wood pile with 27 T. guasayana) and on the southern cluster (B) (a goat corral with five T. guasayana) of Amamá from 1995 to 1998.
House Invasion
Most of the T. guasayana were collected by KD and HD in houses at the edges of Amamá, close to the wire fence (Fig. 6). T. guasayana-positive houses were significantly closer to the wire fence (73 m) than negative houses (134 m) (Wilcoxon ranked test, Z = 2.1, P = 0.04). Collection of T. guasayana adults in domiciles by HD was not associated with the finding of the respective peridomicile infested by T. guasayana (χ2 < 2 for each date, P > 0.05) or with the finding of an infested site within a distance of 250 m around the positive domicile (χ2 < 1.5 for each date, P > 0.05).
Fig. 6.
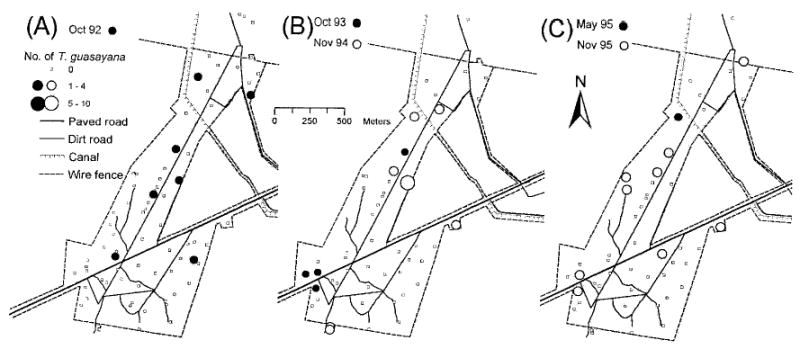
Number of T. guasayana collected in Amamá per house by KD in 1992 (A) and by HD during 1993–1994 (B) and 1995 (C).
Factors Determining the Observed Pattern
Goat density was highest (6.5–7.5 goats per hectare) and significantly clustered up to 300 m [Gi*(d) > 3.08, P < 0.05] in northern Amamá, coinciding with T. guasayana clustering (Fig. 7A). Pig density was significantly clustered in the center up to 200 m [Gi*(d) >3.08, P < 0.05)] (Fig. 7B). Chickens were found throughout the community (Fig. 7C). The total number of T. guasayana in 1993–2002 was significantly associated with the median number of goats per house in the same period (multiple linear regression coefficient [beta] = 0.213, t = 3.3, P < 0.001), whereas no association was found with pigs (beta = 0.002, t = 0.002, P > 0.5) or chickens (beta = −0.002, t = −0.05, P > 0.5).
Fig. 7.
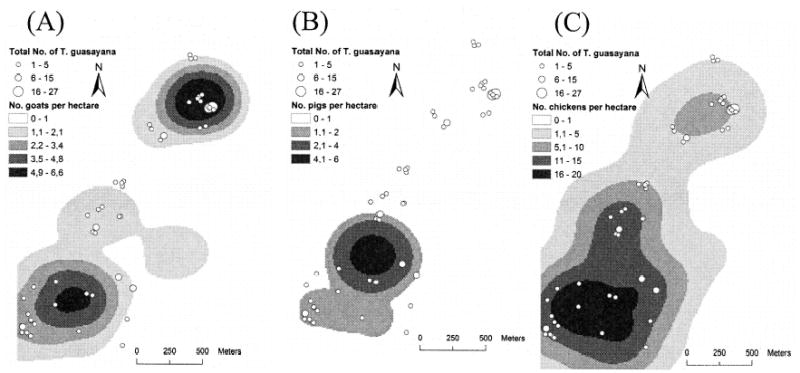
Median number of goats (A), pigs (B), and chickens (C) per hectare and total number of T. guasayana collected in 1993–2002 in Amamá.
When the spatial filter was applied to the regression analysis, the number of T. guasayana per compound was positively and significantly associated with both the spatial (beta = 0.227, t = 0.474, P < 0.001) and the nonspatial (beta = 0.485, t = 0.458, P < 0.001) components of the median number of goats/sheep per house. The model fit (r2) increased from 0.145 in the standard regression to 0.204 in the model with the filtered variables, but remained low, explaining only 20% of the variance. This suggests that additional variables need to be considered when attempting to explain the spatial distribution of T. guasayana in Amamá.
Discussion
Underlying Mechanisms
The very slow process of reinfestation of Amamá by T. guasayana during the first 2 yr after insecticide spraying is consistent with this species having a generation time of 1 yr (Ghilini 1982, Carcavallo and Martinez 1985). The absence of domestic or peridomestic bug colonies and the lack of association of domiciliary invasion (assessed by house-holders’ collections) with peridomestic infestation by T. guasayana in 1993–1994 points to active flight dispersal from the sylvatic habitats around houses as the most likely mechanism underlying the observed pattern, rather than the occurrence of a residual foci. Because nearly all of the female T. guasayana collected by light traps in the forest that surrounded Amamá in October 2002 were inseminated or had immature eggs (unpublished data), the first female bugs collected in 1993–1994 probably founded the colonies detected in May 1995. Thereafter, the sources of reinfestation differed between clustering zones. In the north, the reinfestation probably occurred mainly by active dispersal from a heavily infested wood pile. In central and southern Amamá, however, the apparent absence of peridomestic sources and the increased house invasion by T. guasayana near the peripheral wire fence suggest that the forest surrounding the community was the source of flight-dispersing T. guasayana.
The sharp reduction in T. guasayana peridomestic infestation since 1997 can probably be attributed to increased insecticide spraying performed by householders. Although the residual effects of pyrethroid insecticides against triatomine bugs last only for 1 to 2 wk in peridomestic structures (Gürtler et al. 2004), it probably exerted significant and adverse effects on the already slow-growing peridomestic populations of T. guasayana after the 1992 and 1997–1998 insecticide sprays. Other factors, such as increasing deforestation and habitat degradation, may have contributed to the slow recolonization after control interventions. Because timed manual collections lack sensitivity, they probably underestimated the prevalence and abundance of infestation systematically.
The prevalence of infestation differed among peri-domestic ecotopes, with wood piles being more important during the first 2 yr postspraying. Because most (70%) of the wood piles persisted < 1.5 yr, the frequent finding of T. guasayana (including high-density colonies) in wood piles probably resulted from passive transport from the sylvatic environment. In northern Brazil, peridomestic reinfestation by Triatoma brasiliensis Neiva after insecticide spraying was enhanced by the constant replenishment of wood piles from the forest (Oliveira-Lima et al. 2000). Our data suggest that passive transport may be a source of T. guasayana in the peridomestic environment, in addition to flight dispersal from different sources.
Spatial Clustering
Quantitative spatial analysis by using global, local, and focal statistics demonstrated that bug infestation patterns are clustered. The global clustering of T. guasayana density per site disappeared when the same analysis was run at the compound level. Furthermore, focal analysis also showed that strong clustering of infestations was limited to very short distances (< 100 m). Thus, both analyses demonstrated that the spatial association occurred at the compound level. This means that the likelihood of one site becoming infested by T. guasayana increased when other sites in the peridomestic compound were infested. Similarly, the spatial pattern of reinfestation by T. infestans was clustered at the site level at even shorter distances than T. guasayana (Cecere et al. 2004). The difference in range of clustering may be due to T. infestans spreading from one original residual focus through most of the village, whereas T. guasayana reinfestation originated from many sylvatic sources and spread independently in the north and south, generating a more locally clustered spatial distribution. The different local clustering distances of T. guasayana between the northern and southern clusters (1,000 versus 150 m, respectively) may reflect the effects of different sources of bugs. Whereas in the southern cluster only sylvatic habitats were a source of reinfestation, in the northern cluster, the joint invasion from the suspected peridomestic source and the surrounding sylvatic habitats created a bigger source that in turn accelerated the colonization and propagation rates of T. guasayana in the vicinity. The clustering zones can be considered hot spots where invasion from other sources is expected to be higher, and where, eventually, introduction of sylvatic T. cruzi to suitable hosts may occur.
Factors Determining Observed Spatial Pattern
The abundance and spatial distribution of T. guasayana were positively associated with the local density of goats, especially in the northern cluster. This was to be expected, because host availability limits the size of triatomine bug populations and population growth rate (Schofield 1980, Piesman et al. 1983, Gürtler et al. 1992). Free-ranging goats usually sleep near bromeliads and dry cacti that are frequently infested by T. guasayana, as recent field observations showed. Moreover, the prevalence of infestation by T. guasayana in bromeliads and cacti around houses within the northern cluster was higher than in other sectors within Amamá and in the surrounding forest (unpublished data). These habitats located around houses are actually intermediate between the peridomestic (corrals) and truly sylvatic habitats because the local hosts and landscape characteristics may differ from the truly peridomestic and truly sylvatic habitats located deep in the forest, where little or no human activity occurs. The landscape matrix with natural vegetation surrounding houses and goat management practices at each household may further explain the heterogeneous spatial distribution of T. guasayana within Amamá.
Epidemiological Implications
T. guasayana has been suggested as a potential secondary vector once T. infestans is eliminated from domiciliary areas (Carcavallo and Martinez 1985; Wisnivesky-Colli et al. 1993, 1997; Noireau et al. 1999). However, during the 10 yr that followed the community-wide insecticide spraying and despite the very low domiciliary abundance of T. infestans and repeated finding of adult T. guasayana indoors, the overall prevalence of domiciliary infestation remained very low, no successful domiciliary colonization occurred, and very few T. guasayana infected with T. cruzi were collected (Cecere et al. 1999). In the Amamá area, T. guasayana continues to be predominantly sylvatic and peridomestic. In agreement with an early assessment (Gürtler et al. 1999), the present 10-yr time series shows no increasing trend of T. guasayana toward domiciliation and its very low epidemiological importance at present. However, local villagers in Santiago del Estero and other semiarid areas regard T. guasayana as an important nuisance because of its aggressive biting behavior and the allergic reaction it frequently induces, and these villages sometimes request control actions against T. guasayana. Ongoing research is directed to assess the possibly changing role of T. guasayana in the transmission of T. cruzi during the surveillance phase, to determine its role as the sylvatic vector of T. cruzi, and to determine whether T. guasayana can act as a bridge between the domestic and sylvatic transmission cycles.
Acknowledgments
We thank Roberto Chuit and Abel Hurvitz and staff at the National Control Service (Argentina) for providing active support during fieldwork; María Moyano and Omar Sitatti for field accommodation; Amamá residents for participation in this effort; and Janet Thornhill for assistance in the digitizing phase. The Amamá database is the product of a sustained collaborative effort between researchers from University of Buenos Aires (REG), Directorate of Epidemiology, Minister of Health and Social Action, Argentina-National Chagas Service (Roberto Chuit), and Rockefeller University (Joel E. Cohen) between 1992 and 2000. This study was supported by awards from the National Institutes of Health/National Science Foundation Ecology of Infectious Disease program award R01 TW05836 funded by the Fogarty International Center and the National Institute of Environmental Health Sciences to U.K. and R.E.G., Agencia Nacional de Promoción Científica y Técnica (Argentina) and University of Buenos Aires to R.E.G. R.E.G. and M.C.C. are members of Consejo Nacional de Investigaciones Científicas y Técnicas Researcher’s Career.
References
- Boots, B. A., and A. Getis. 1988. Point pattern analysis. Sage Publications, Beverly Hills, CA.
- Canale DM, Cecere MC, Chuit R, Gürtler RE. Peridomestic distribution of Triatoma garciabesi and Triatoma guasayana in north-west Argentina. Med Vet Entomol. 2000;14:383–390. doi: 10.1046/j.1365-2915.2000.00254.x. [DOI] [PubMed] [Google Scholar]
- Carcavallo, R. U., and A. Martinez. 1985. Biología, ecología y distribución geográfica de los triatominos americanos (excepto R. prolixus, P. megistus, T. dimidiata y T. infestans). In R. U. Carcavallo, J. E. Rabinovich, and R. J. Tonn [eds.], Factores biológicos y ecológicos en la Enfermedad de Chagas. Ministerio de Salud y Acción Social de Argentina, Buenos Aires, Argentina.
- Castañera MB, Lauricella MA, Chuit R, Gürtler RE. Evaluation of dogs as sentinels of the transmission of Trypanosoma cruzi in a rural area of north-western Argentina. Ann Trop Med Parasitol. 1998;92:671–683. doi: 10.1080/00034983.1998.11813327. [DOI] [PubMed] [Google Scholar]
- Cecere MC, Castañera MB, Canale DM, Chuit R, Gürtler RE. Trypanosoma cruzi infection in Triatoma infestans and other triatomines: long-term effects of a control program in a rural northwestern Argentina. Pan Am J Public Health. 1999;5:392–399. doi: 10.1590/s1020-49891999000500003. [DOI] [PubMed] [Google Scholar]
- Cecere MC, Gürtler RE, Canale DM, Chuit R, Cohen JE. Effects of partial housing improvement and insecticide spraying on the reinfestation dynamics of Triatoma infestans in rural northwestern Argentina. Acta Trop. 2002;84:101–116. doi: 10.1016/s0001-706x(02)00183-3. [DOI] [PubMed] [Google Scholar]
- Cecere MC, Vazquez-Prokopec GM, Gürtler RE, Kitron U. Spatio-temporal analysis of reinfestation by Triatoma infestans (Hemiptera: Reduviidae) following insecticide spraying in a rural community in Northwestern Argentina. Am J Trop Med Hyg. 2004;71:803–810. [PMC free article] [PubMed] [Google Scholar]
- Clarke KC, McLafferty SL, Tempalski BJ. On epidemiology and geographic information systems: a review and discussion of future directions. Emerg Infect Dis. 1996;2:85–92. doi: 10.3201/eid0202.960202. [DOI] [PMC free article] [PubMed] [Google Scholar]
- Clennon JA, King CH, Muchiri EM, Kariuki HC, Ouma JH, Mungai P, Kitron U. Spatial patterns of urinary Schistosomiasis infection in a highly endemic area of coastal Kenya. Am J Trop Med Hyg. 2004;70:443– 448. [PubMed] [Google Scholar]
- Cromley, E. K., and S. L. McLafferty. 2002. GIS and public health. The Guilford Press, New York.
- Dias JCP. Controle de vectores da doenca de Chagas no Brasil e riscos de reinvasao domiciliar por vectores secundarios. Mem Inst Oswaldo Cruz. 1988;83:387–391. doi: 10.1590/s0074-02761988000500031. [DOI] [PubMed] [Google Scholar]
- Diotaiuti L, Ribeiro de Paula O, Lima Falcao P, Pinto Dias JC. Avaliacao do programa de controle vetorial da doenca de Chagas em Minas Gerais, Brasil, com referencia especial ao Triatoma sordida. Bol Oficina Sanit Panam. 1995;118:211–219. [Google Scholar]
- Gajate PP, Bottazzi MV, Pietrokovsky SM, Wisnivesky-Colli C. Potential colonization of the peridomicile by Triatoma guasayana (Hemiptera: Reduviidae) in Santiago del Estero, Argentina. J Med Entomol. 1996;33:635– 639. doi: 10.1093/jmedent/33.4.635. [DOI] [PubMed] [Google Scholar]
- Getis A. Interaction modeling using second-order analysis. Environ Planning A. 1984;16:173–183. [Google Scholar]
- Getis, A. 1995. Spatial filtering in a regression framework: examples using urban crime, regional inequality, and government expenditures, pp. 191–203. In L. Anselin and R. Florax [eds.], New directions in spatial econometrics. North Holland Press, Amsterdam, The Netherlands.
- Getis, A., and J. K. Ord. 1996. Local spatial statistics: an overview, pp. 261–277. In P. Longley and M. Batty [eds.], Spatial analysis: modeling in a GIS environment. Geoinformation International, Cambridge, United Kingdom.
- Ghilini JM. Estadísticas vitales de Triatoma guasayana Wigodzinsky y abalos 1949 (Hemiptera –Reduvi-idae) bajo condiciones de laboratorio. Rev Soc Entomol Argentina. 1982;41:211–224. [Google Scholar]
- Gürtler, R. E., M. C. Cecere, D. N. Rubel, and N. J. Schweigmann. 1992. Determinants of the domiciliary density of Triatoma infestans, vector of Chagas disease. Med. Vet. Entomol. 6: 75-/83. [DOI] [PubMed]
- Gürtler RE, Petersen RM, Cecere MC, Schweigmann NJ, Chuit R, Gualtieri JM, Wisnivesky-Colli C. Chagas disease in north-west Argentina: risk of domestic reinfestation by Triatoma infestans after a single community-wide application of deltamethrin. Trans R Soc Trop Med Hyg. 1994;88:27–30. doi: 10.1016/0035-9203(94)90483-9. [DOI] [PubMed] [Google Scholar]
- Gürtler RE, Cecere MC, Castañera MB, Canale DM, Chuit R, Cohen JE. Monitoring house reinfestation by triatomine vectors of Chagas disease: a comparative trial of detection methods during a four-year follow-up. Acta Trop. 1999;59:47–54. doi: 10.1016/s0001-706x(98)00096-5. [DOI] [PubMed] [Google Scholar]
- Gürtler RE, Canale DM, Spillmann C, Stariolo R, Salomón OD, Blanco S, Segura EL. Effectiveness of residual spraying with deltamethrin and per-methrin on peridomestic populations of Triatoma infestans in rural western Argentina: a district-wide randomized trial. Bull World Health Organ. 2004;82:196 –205. [PMC free article] [PubMed] [Google Scholar]
- Hay, S. I., S. E. Randolph, and D. J. Rogers. 2000. Remote sensing and geographical information systems in epidemiology, pp. 2–27. In S. Hay and S. Randolph [eds.], Advances in Parasitology, vol. 47. Academic, London, United Kingdom.
- Kitron U. Landscape ecology and epidemiology of vector-borne diseases: tools for spatial analysis. J Med Entomol. 1998;35:435– 445. doi: 10.1093/jmedent/35.4.435. [DOI] [PubMed] [Google Scholar]
- Kitron U. Risk maps: Transmission and burden of vector-borne diseases. Parasitol Today. 2000;16:324 –325. doi: 10.1016/s0169-4758(00)01708-7. [DOI] [PubMed] [Google Scholar]
- Kitron U, Jones CJ, Bouseman JK, Nelson JA, Baumgartner DL. Spatial analysis of the distribution of Ixodes dammini (Acari: Ixodidae) on white-tailed deer in Ogle county, Illinois. J Med Entomol. 1992;29:259 –266. doi: 10.1093/jmedent/29.2.259. [DOI] [PubMed] [Google Scholar]
- Noireau F, Gutierrez T, Flores R, Breniere F, Bosseno M, Wisnivesky-Colli C. Ecogenetics of Triatoma sordida and Triatoma guasayana (Hemiptera: Reduvi-idae) in the Bolivian Chaco. Mem Inst Oswaldo Cruz. 1999;94:451– 457. doi: 10.1590/S0074-02761999000400004. [DOI] [PubMed] [Google Scholar]
- Noireau F, Flores R, Gutierrez T, Abad-Franch F, Flores E, Vargas F. Natural ecotopes of Triatoma infestans dark morph and other sylvatic triatomines in the Bolivian Chaco. Trans R Soc Trop Med Hyg. 2000;94:23–37. doi: 10.1016/s0035-9203(00)90426-7. [DOI] [PubMed] [Google Scholar]
- Oliveira-Lima AM, Faria Filho FO, Furtado Vieira JB, Oliveira Filho AM. Alteracoes do peridomi-cilio e suas implicacoes para o controle do Triatoma brasiliensis. Cad Saude Publica 16. 2000;75:81. [PubMed] [Google Scholar]
- Piesman J, Sherlock IA, Christensen HA. Host availability limits population density of Panstrongylus megistus. Am J Trop Med Hyg. 1983;32:1445–1450. doi: 10.4269/ajtmh.1983.32.1445. [DOI] [PubMed] [Google Scholar]
- Ripley BD. The second-order analysis of stationary point processes. J Appl Probab. 1976;13:255–266. [Google Scholar]
- Robinson, T. P. 2000. Spatial statistics and geographical information systems in epidemiology and public health, pp. 82–120. In S. Hay and S. Randolph [eds.], Advances in Parasitology, vol. 47. Academic, London, United Kingdom. [DOI] [PubMed]
- Schofield CJ. Nutritional status of domestic populations of Triatoma infestans. Trans R Soc Trop Med Hyg. 1980;74:770 –778. doi: 10.1016/0035-9203(80)90197-2. [DOI] [PubMed] [Google Scholar]
- Schofield CJ, Dias JCP. The southern cone initiative against chagas disease. Adv Parasitol. 1999;42:1–27. doi: 10.1016/s0065-308x(08)60147-5. [DOI] [PubMed] [Google Scholar]
- Silverman, B. W. 1986. Density estimation for statistics and data analysis. Chapman & Hall, London, United Kingdom.
- Vezzani D, Schweigmann NJ, Pietrokovsky SM, Wisnivesky-Colli C. Characterization of Triatoma guasayana biotopes in a hardwood forest of Santiago del Estero, Argentina. Mem Inst Oswaldo Cruz. 2001;96:459 – 466. doi: 10.1590/s0074-02762001000400004. [DOI] [PubMed] [Google Scholar]
- Wisnivesky-Colli C, Gürtler RE, Solarz ND, Schweigmann NJ, Pietrokovsky SM, Alberti A, Flo J. Dispersive flight and house invasion by Triatoma guasayana and Triatoma sordida in Argentina. Mem Inst Oswaldo Cruz. 1993;88:27–32. doi: 10.1590/s0074-02761993000100006. [DOI] [PubMed] [Google Scholar]
- Wisnivesky-Colli C, Schweigmann NJ, Pietrokovsky S, Bottazi V, Rabinovich JE. Spatial distribution of Triatoma guasayana (Hemiptera: Reduviidae) in hardwood forest biotopes in Santiago del Estero, Argentina. J Med Entomol. 1997;34:102–109. doi: 10.1093/jmedent/34.2.102. [DOI] [PubMed] [Google Scholar]
- Zar, J. H. 1996. Biostatistical analysis, 3rd ed. Prentice Hall, Englewood Cliffs, NJ.


