

Abstract
Collagen type I is composed of three polypeptide chains transcribed from two separate genes (COL1A1 and COL1A2) with different promoters requiring coordinate regulation. Our recent publications, centering on COL1A2 regulation, demonstrate that methylation in the first exon of COL1A2 at a regulatory factor for X box (RFX) site (at −1 to +20) occurs in human cancer cells and correlates with increased RFX1 binding and decreased collagen transcription (Sengupta, P. K., Erhlich, M., and Smith, B. D. (1999) J. Biol. Chem. 274, 36649 – 36655; Sengupta, S., Smith, E. M., Kim, K., Murnane, M. J., and Smith, B. D. (2003) Cancer Res. 63, 1789 – 1797). In normal cells, RFX5 complex along with major histo-compatibility class II transactivator (CIITA) is induced by interferon-γ to occupy this site and repress collagen transcription (Xu, Y., Wang, L., Buttice, G., Sengupta, P. K., and Smith, B. D. (2004) J. Biol. Chem. 279, 41319 – 41332). In this paper, we demonstrate that COL1A1 has an RFX consensus binding site surrounding the transcription start site (−11 to +10) that contains three methylation sites rather than one in the COL1A2 gene RFX binding site. RFX1 interacts weakly with the unmethylated COL1A1 site, and binds with higher affinity to the methylated site. RFX1 represses the unmethylated COL1A1 less efficiently than COL1A2. COL1A1 promoter activity is sensitive to DNA methylation and the COL1A1 gene is methylated in human cancer cells with coordinately decreased collagen expression. The DNA methylation inhibitor, 5-aza-2′-deoxycytidine (aza-dC) increases collagen gene expression with time in human cancer cells. On the other hand, RFX5 interacts with both collagen type I genes with a similar binding affinity and represses both promoters equally in transient transfections. Two dominant negative forms of RFX5 activate both collagen genes coordinately. Finally, CIITA RNA interference experiments indicate that CIITA induction is required for interferon γ-mediated repression of both collagen type I genes.
Collagen, a major extracellular matrix component, plays a significant role influencing cell behavior and maintaining tissue structure (1). Type I collagen, the most abundant member of the collagen family, is composed of two identical α1(I) polypeptide chains and a similar, but distinct polypeptide chain designated α2(I). Collagen expression is controlled in a developmental and tissue-specific manner. In adult tissue, type I gene expression is largely inactivated, but stimulated after injury. The two type I collagen genes (COL1A1 and COL1A2) are within separate chromosomes with different regulatory sequences in their promoters, yet they need to be regulated coordinately to ensure proper function.
Synthesis of collagen by cells in culture is down-regulated upon oncogenic transformation with viruses or chemical carcinogens (2-5). We have previously demonstrated (5) that collagen α2(I) is not expressed in a tumorigenic cell line, W8, after treatment of the parental liver epithelial-like cell line, K16, with the carcinogen 2-N-(acetoxyacetyl)-aminofluorine. Analysis of genomic DNA isolated from W8 cells revealed that the promoter-5′ region of the α2(I) gene, COL1A2, was methylated (6). Furthermore, reporter constructs containing the COL1A2 promoter region (218 bp), as well as the first exon (54 bp) of the COL1A2 gene, were inactivated by DNA methylation in transient transfection experiments and in vitro transcription as-says (6, 7). The inhibition of reporter gene expression was attributable to CpG methylation within the first exon surrounding the transcription start site of the COL1A2 gene. Finally, the collagen transcription start site (−1 to +20) contains a low affinity-binding site for the regulatory factor for X box (RFX) family (8, 9). The binding affinity of RFX1 is increased if the CpG site at +7 is methylated or mutated to thymidine on the coding strand.
RFX1 is a member of the RFX family of closely related proteins, RFX1– 4 (10-13), that can bind methylated DNA sequences with higher affinity within a sequence-specific 14-bp consensus sequence. Methylation-dependent binding sites have been located for RFX at the beginning of human genes such as hypoxanthine phosphoribosyltransferase, α-galactosidase A, human leukocyte antigens, and the apoferritin H gene (14) suggesting a role for this protein family in DNA methylation induced gene repression. Most importantly, the RFX proteins repress COL1A2 gene expression in transient transfection as well as in vitro transcription assays (8).
Our data suggest that RFX5 complex and CIITA play an important role in repression of COL1A2 gene when fibroblast cells are treated with IFN-γ1 (15, 16). RFX5, a member of the RFX family binds to DNA in a sequence-specific and methylation-insensitive manner (8). Previously, we demonstrated that the RFX5 complex of transcription factors can also bind to COL1A2 at the transcription start site (8, 9). Other components of the RFX5 complex, RFXB and RFXAP, contribute to repression of COL1A2 gene expression (15) as well as class II transactivator (CIITA) in fibroblasts (8). RFX5 and CIITA play an important role inducing major histocompatability class II (MHC II) gene expression and are induced in fibroblasts by IFN-γ (17, 18). In fact, blocking CIITA expression by RNA interference (RNAi) also blocks IFN-γ-mediated repression (16).
Because our published studies to date center on the COL1A2 gene, it was important to determine whether the COL1A1 gene is regulated in a similar manner. In this publication, we demonstrate that the α1(I) gene, COL1A1, is also methylated in human cancer cells and this methylation occurs, in most cases, coordinately with the COL1A2 gene. In addition, the COL1A1 gene contains a methylation specific binding site for the RFX family at the transcription start site farther upstream than in the COL1A2 gene. The RFX proteins bind to both genes and act as repressors, but do so with different binding affinities and transcriptional activities.
MATERIALS AND METHODS
Cell Culture, Treatments, Transfection, and Luciferase Assay
Human lung fibroblasts, IMR-90, (IMR, NJ), fibrosarcoma cells (HT1080, American Type Culture Collection), hepatocarcinoma cells (SNU387, SNU398, SNU449, PLC/PRF/5), and breast epithelial carcinoma cells (Hs578T) were maintained in Dulbecco's modified Eagle's medium (DMEM) (Invitrogen) supplemented with 10% fetal bovine serum (FBS, Hyclone). Media for Hs578T contained additional insulin (1 μg/ml). A second breast carcinoma cell line (MCF-7) was maintained in high glucose Dulbecco's modified Eagle's medium. The colon cancer cell line (HCT116) was maintained in McCoys medium.
The IMR-90 cell line was used for transfection studies. Prior to transfection, cells were plated in 6-well culture plates at a density of 3 × 10⁵ per well and incubated at 37 °C with 5% CO2 for 16 – 24 h. Transfections were performed using Lipofectamine reagent (Invitrogen) according to the manufacturer's protocol. Three hours after transfection, cells were transferred to DMEM with 10% FBS and harvested 24 h later. Cells were then lysed in 1× reporter lysis buffer (Promega, Madison, WI) and luciferase activities were assayed using a luciferase reporter assay system (Promega). Luciferase activity was normalized for total protein and transfection efficiency. Transfection efficiency was monitored by fluorescent readings for the co-transfected GFP construct (0.1 μg). Experiments were routinely performed in duplicate plates. The ratio of experimental to control (reporter plasmid with empty vector) × 100 was calculated for each experiment with the control values set at 100. Values from three or more experiments were averaged and presented in this paper.
IFN-γ Treatment
In several studies IMR-90 cells were treated with IFN-γ. IMR-90 fibroblasts were plated in p35 tissue culture dishes at 4 × 10⁵ cells/dish for mRNA studies and maintained in DMEM with 10% FBS for 16 – 24 h. Cells were pretreated in DMEM with 0.4% FBS for 16 h prior to IFN-γ treatment with 100 units/ml in 0.4% DMEM for 24 h.
Aza-dC Treatment
HT1080 cells were plated at 250,000 cells per p35-mm well plate and treated with 1 μm 5-aza-2′-deoxycytidine (aza-dC) daily for 0, 1, 2, or 3 days before harvesting.
Plasmids
The COL1A1 promoter plasmids were all cloned into a pGL2-lucif-erase vector from the −804hCOL1-luc plasmid described previously (19). All constructs have the exact same 3′ end as the −804hCOL1-Luc (+114). The −311COL1-luc was constructed using exonuclease III digestion. First, −804COL1-Luc was digested with KpnI and XhoI (both cut upstream of −804) to linearize the plasmid. Then the plasmid was treated with exonuclease III followed by mung bean nuclease to remove single-stranded ends. The resulting DNA was self-ligated to recircularize −311COL1-Luc. The −112COL1-Luc construct was amplified by PCR using a 20-nucleotide primer at −112 and a luciferase primer (GL2 primer from Promega) downstream. The PCR product was cloned into pCR2.1 by TA cloning. The fragment was then excised with KpnI and HindIII and cloned into pGL2basic. These constructs were verified by DNA sequencing.
In some experiments, plasmids were methylated by Sss1 methylase using the manufacturer's recommendations (New England Biolabs, Inc.) as described previously (7). Unmethylated plasmids were incubated in the reaction mixture with S-adenosylmethionine and purified in the same way as the methylated plasmids. In several experiments, full-length expression constructs for RFX1, FLAG-RFX5, FLAG-RFXB/ ANK, FLAG-CIITA, and His-RFXAP constructs were co-transfected with collagen reporter constructs as described previously (8, 15, 16).
Electrophoretic Mobility Gel Shift Assay
Nuclear extracts were prepared essentially according to Dignam et al. (20) with some modifications. Extractions of protein from isolated nuclei were performed at higher salt conditions than normal using 500 or 420 mm NaCl rather than 350 mm NaCl in buffer C. All buffers contained the protease inhibitors leupeptin (40 μg/ml), aprotinin (200 μg/ml), pepstatin A (40 μg/ml), and phenylmethylsulfonyl fluoride (0.5 mm) as well as the phosphatase inhibitor orthovanadate (1 mm). Protein concentration of the extracts was determined by the Bradford reagent using bovine serum albumin as a standard. Collagen sequences or MDBP/RFX consensus sequences (Table I) with HindIII overhangs were synthesized (Oligo Etc.; CT and Integrated DNA Technology) as complementary strands, annealed to make double-stranded oligonucleotides, and radiolabeled using the [α-32P]dATP and the Klenow fragment to fill in the HindIII overhang. For DNA mobility shift assay, the binding reaction was performed for 30 min at room temperature in 20 μl of binding buffer containing 90,000 – 100,000 cpm/200 fmol of labeled probe, 1 μg of poly(dI-dC)[H18528]poly(dI-dC) and nuclear extract containing 4.5–5.0 μg of protein. Double-stranded annealed complementary oligo-nucleotides for mpBr322 (Oligo Etc., CT and Integrated DNA Technology) were used as competitors. Separation of free radiolabeled DNA from DNA-protein complexes was carried out on a 4–5% non-denaturing polyacrylamide gel with a standard Tris borate electrophoresis buffer at 300 V in the cold (4 °C). Autoradiography was performed by overnight exposure to Kodak Biomax film (Eastman Kodak Co.). The intensities of the bands were quantified using Instant Imager (Packard Instrument Co.).
Table I.
Probes for gel shift analysis
| Gene | ||
|---|---|---|
| α1(I) −11 to +10 | α1(1) Promoter first exon sequence | aagcttAGTCGTCGGAGCAGACGGGAGTCAGCAGCCTCGTCTGCCCTCttcgaa |
| α2(I) −1 to +20a | α2(1) First exon sequence | aagcttAGCACCACGGCAGCAGGAGGTTCGTGGTGCCGTCGTCCTCCAttcgaa |
| α1(I) −1 to +20 | α1(1) First exon | aagcttAGCAGACGGGAGTTTCACCTTCGTCTGCCCTCAAAGTGGAttcgaa |
| Xb | MHC class II X-box | aagcttTTCCCCTAGCAACAGATAAAGGGGATGCTTGTCTATttcgaa |
| pB1c | pBR322 | aagcttATCGTCACGGCGATTAGCAGTGCCGCTAttcgaa |
Methylation Status
Bisulfite Modification of Genomic DNA —DNA, isolated from cells, was modified by bisulfite treatment to analyze methylation of collagen at the +7 CpG site as previously described (8, 21). The bisulfite modification causes unmethylated cytosines (Cs) to be converted to uracil. Methylated cytosines are resistant to deamination. PCR was used to amplify the modified DNA replacing uracil residues with thymine. Primers were designed using a converted sequence (Cs to Ts) in a region that did not contain any possible CpG methylation sites. Separate primers were designed to amplify the coding strand (−65 to +151) or the template strand (−71 to +144) (see Table II). The PCR product was separated on 2% low melting agarose gel and purified using the Qia-quick Qiagen gel extraction kit (Qiagen, Valencia, CA).
Table II.
Bisulfite modified primers for PCR and MS-SNuPE assay
| Name | Position | 5′-3′ Sequencea |
|---|---|---|
| COL1A2 primers | ||
| Forward primer (FP) | α2(1) Promoter −65 to −37 | GGAGGTATTTTAGGTTAGGGAAATTTTTG |
| Reverse primer (RP) | α2(I) First exon +121 to +151 | CACAAAACTAAACATATCTAACACTTAAA |
| +7 primer (SNuPE) | α2(I) Transcription start site −17 to +6 | GGGATTTGTTATTTTAAGTATTA |
| Control primer | α2(I) Promoter −59 to −43 | ATTTTAGGTAGGGAAA |
| COL1A1 primers | ||
| Forward primer (FP) | α1(1) Promoter −15 to −98 | AATTAATCTCAACAAACC |
| Reverse primer (RP) | α1(1) First exon +78 to +96 | ATTTTTTGTGGTTGGGGAG |
| +6 primer (SNuPE) | α1(1) Transcription start site −14 to +5 | AAACAAAACTACTAACCAA |
The PCR and MS-SNuPE primers are the predicted bisulfite converted collagen bases based on COL1A2 sequences in the GenBank (accession number AF004877). The PCR primers have been chosen from regions that do not contain any methylation sites. The region amplified by these primers contained a % GC of 56% and a CG:GC ratio of 0.55.
Methylation-sensitive Single Nucleotide Primer Extension (MSSNuPE) Assay—For determining methylation at individual sites, we used MS-SNuPE (22). This method established whether the nucleotide at +7 remained a C (methylated) residue or has been converted to T (unmethylated) as described previously (8, 21). The MS-SNuPE primers are in Table I and their relationship to the collagen gene is diagrammed in Fig. 1A. The reaction mixture contained gel-purified PCR fragments, primers, 1× Taq polymerase buffer, and 1 μCi of radiolabeled [32P]dCTP or dTTP to identify methylated or unmethylated residues, respectively, for coding strand, and [32P]dGTP or dATP to identify methylated or unmethylated residues, respectively, for template strand (Promega). After denaturation at 95 °C for 3 min, the primers were annealed at 40 °C for 2 min (template strand) or 50 °C for 2 min (coding strand), and extended at 72 °C for 1 min with Taq polymerase (1 unit) (Promega). The reaction was stopped by addition of 10 μl of stop buffer. The reaction products were heated at 95 °C for 2 min before loading onto a 15% acrylamide, 7 m urea gel. The radioactivity of the specific bands was quantified by a Packard Instant Imager (PerkinElmer Life Sciences) and pictured by autoradiography. The percent of methylation was calculated by dividing the amount of radiolabeled dCTP or dGTP incorporated into the primer by the total radioactivity multiplied by 100.
Fig. 1.

RFX family of proteins can bind near the start site of the COL1A1 gene. A, schematic representation of the sequence near the start site of both human COL1A1 (AF017178 accession number) and COL1A2 (AF004877 accession number) genes to show the homology between the two genes. RFX binding sites have been indicated using bold and italic bases in both genes. CpG sequences near the start sites were shown by asterisks (*). B, RFX1–3 proteins can bind to COL1A1 (−11/+10) and COL1A2 sequences in a methylation-sensitive manner as evidenced by the electrophoretic mobility shift assay. Unmethylated (U) and methylated (M) radiolabeled probes (see Table I for sequences) were incubated with the nuclear extract from rat fibroblasts cells as described under “Materials and Methods.” Protein and DNA were separated on native 4% polyacrylamide gels. The dried gel was autoradiographed at −80 °C overnight. Lanes 1 and 2 shows the methylation-sensitive binding at the COL1A2 sequence. Lanes 3 and 4 indicate no binding to either probe when the homologous sequence from COL1A1 is used as probe. Lanes 5 and 6 represent the methylation dependent binding of RFX protein at COL1A1 sequence. C, strong RFX5 complex is generated at the COL1A1 gene, similar to the COL1A2 and X-box sequence when RFX1–3 binding is removed using the methylated PBR322 sequence. Gel shift experiment was performed similarly to B in the presence a 50-fold molar excess of mPBR322. The higher mobility complex is designated as RFX5 complex.
Construction of Dominant Negative Clones in Lentivirus Vectors—The wild type RFX5 and the two dominant negative constructs, RFX5Δ1 and RFX5Δ5, were amplified from the original pcDNA3 vectors (23) and cloned into pLenti6/V5-D-TOPO vector using a directional TOPO cloning kit (Invitrogen). Constructs were sequenced to be sure there were no mutations, deletions, or extra bases.
PCR Shagging-based RNAi
Three different reverse primers were designed by RNAi oligo retriever program on Cold Spring Harbor web site (http://katahdin.cshl.org:9331/RNAi/html/rnai.html) and cloned into pLenti6-V5-TOPO vectors as previously described (16). A pGEM1-U6 vector was used as the template to clone U6 promoter driving short hairpin RNA (shRNA). PCR were performed by 95 °C for 3 min; 30 cycles of 95 °C for 30 s, 55 °C for 30 s, and 72 °C for 1 min followed by one cycle of 72 °C for 10 min. PCR products were separated on 1% agarose gel, sliced from gel, purified by a Qiagen gel extraction kit, and ligated into pLenti6-V5-TOPO vector using a Viralpower directional cloning kit. Ligation products were transformed into TOP10 competent cells and positive clones were screened by restriction digestion and direct sequencing.
Generation of Lentiviral Stocks and Transduction
Viral packaging cells (293FT, Invitrogen, Carlsbad, CA) were maintained in DMEM supplemented with 10% FBS, 1% penicillin-streptomycin, and 500 μg/ml geneticin (Invitrogen). The lentiviral stock was prepared by transfecting our constructs (RFX5, RFX5Δ1, and RFX5Δ5) or three shRNA clones as well as a LacZ construct expressing β-galactosidase plus an empty TOPO vector along with ViralPower packaging mixture into 293FT cells using Lipofectamine 2000 reagent according to the manufacturer's protocol (Invitrogen). After 48–72 h, viruses containing supernatants were harvested, centrifuged, and stored in 1-ml aliquots. Titers of lentiviral stocks were performed according to the manufacturer's protocol using HT1080 cells to determine the number of virus particles. IMR-90 cells were infected with virus at the multiplicity of infection of 1. Cells were treated with or without 100 units/ml IFN-γ for an additional 24 h before harvesting. Proteins were extracted using RIPA buffer (1× phosphate-buffered saline, 0.1% SDS, 1% Nonidet P-40, 0.5% sodium deoxycholate) and analyzed by SDS-PAGE gel followed by Western blot. RNAs were extracted and analyzed as described in the following section.
RNA Isolation and Real-time PCR
Cells were harvested and RNA was extracted using an RNeasy RNA isolation kit (Qiagen) according to the manufacturer's protocol. Reverse transcriptase reactions were performed using a SuperScript First-strand Synthesis System (Invitrogen) according to manufacturer's protocol. Real-time PCR were performed on ABI Prism 7700 sequence detection PCR machine (Applied Biosystems, Foster City, CA) according to the manufacturer???s protocol. The oligonucleotide primers (for-ward and reverse) and Taqman probes are described in Table III.
Table III.
Primers for real-time PCR specific for human genes
| Gene | Amplicon location (GenBank accession number) | Exon | Sequences |
|---|---|---|---|
| Human COL1A1 mRNA | 201–1735 (NC_000017) | ||
| Forward primer | Exon1 | 5′-CAGGTCTCGGTCATGGTACCT-3′ | |
| Taqman probe | Exon1/2 | 6FAM-CATCCCACCAATCACCTGCGTACAGA-TAMRA | |
| Reverse primer | Exon2 | 5′-GTCGAGGGCCAAGACGAA-3′ | |
| Human COL1A2 mRNA | 7568–8965 (AF004877) | ||
| Forward primer | Exon5 | 5′-GCCCCCCAGGCAGAGA-3′ | |
| Taqman probe | Exon5/6 | 6FAM-CCTGGTCTCGGTGGGAACTTTGCTG-TAMRA | |
| Reverse primer | Exon6 | 5′-CCAACTCCTTTTCCATCATACTGA-3′ | |
| Human type III CIITA mRNA | 156–218 (AF410154) | ||
| Forward primer | Exon1 | 5′-ACGCCCTGCTGGGTCC-3′ | |
| Taqman probe | Exon1/2 | 6FAM-ACCTGTCAGAGCCCCAAGGCAGC-TAMRA | |
| Reverse primer | Exon2 | 5′-AACTCCATGGTGGCACACTG-3′ | |
| Human HLA-DRA mRNA | 341–427 (NM01911) | ||
| Forward primer | Exon2 | 5′-GCCAACCTGGAAATCATGACA-3′ | |
| Taqman probe | Exon2/3 | 6FAM-CAACTATACTCCGATCACCAATGTACCTCCAGAG-TAMRA | |
| Reverse primer | Exon3 | 5′-AGGGCTGTTCGTGAGCACA-3′ |
Western Blots
For detection of expressed proteins, fibroblasts were extracted using RIPA buffer (1× phosphate-buffered saline, 1% Nonidet P-40, 0.5% sodium deoxycholate, 0.1% SDS) with freshly added phenylmethylsulfonyl fluoride (100 μg/ml RIPA) and protease inhibitor tablet (Roche, Mannheim, Germany). The protein concentration was determined by the Bradford protein assay (Bio-Rad). Proteins in extracts were separated by 10% polyacrylamide gel electrophoresis with pre-stained markers (Bio-Rad) for estimating molecular weight and efficiency of transfer to blots. Proteins were transferred to nitrocellulose membranes (BioRad) in a Mini-Trans Blot Cell (Bio-Rad). The membranes were blocked with 5% milk powder in Tris-buffered saline (TBST) (0.05% Tween 20, 150 mm NaCl, 100 mm Tris-HCl, pH 7.4) buffer at 4 °C overnight and incubated for 3 h with monoclonal anti-V5 (1:1000) (Sigma), monoclonal anti-β-actin (1:1,000) (Sigma), or monoclonal anti-CIITA (1:100) (7–1H, Santa Cruz) as indicated. After 3 washes with TBST, the membranes were incubated with appropriate secondary antibodies, anti-mouse IgG (1:1000) (Amersham Biosciences) conjugated to horseradish peroxidase, for another1hat room temperature. Then protein blots were visualized using ECL reagent (Pierce) on a Kodak Image station (Kodak).
RESULTS
RFX Proteins Interact with the COL1A1 Site (−11 to +6) at the Transcription Start Site with Different Affinity Than COL1A2—As stated in the Introduction, most of our previous studies indicate that the RFX family represses the collagen α2(I) gene, COL1A2. The collagen α1(I) gene, COL1A1, is homologous to the α2(I) gene mainly in the first 20 bases and surrounding the TATA sequence (Fig. 1A). Therefore, we hypothesized that RFX1 would bind to the first 20 bases of the homologous gene. To our surprise, RFX1 did not form a high affinity complex on this α1(I) sequence with or without methylation (Fig. 1B) and the first 20 bases of α1(I) did not compete with the RFX1 complex on the α2(I) sequence at 50- or 20-fold molar excess (data not shown).
However, there is a site upstream in the α1(I) gene, between −11 and +6 (Fig. 1A, underlined), that is a closer match to the RFX consensus sequence. Therefore, proteins binding to oligos at both α1(I) sites were compared with proteins binding to the α2(I)-binding site (Fig. 1B). There was no complex formation on the α1(I) gene at the homologous site (−1 to 20). There was complex formation on the upstream site between −11 and +10 that contains three methylation sites (stars). In both cases, there are two closely spaced complexes migrating in these gels suggesting that other family members of the RFX family or other proteins are binding to these sites.
Further studies indicate that RFX5 also interacts with the α1(I) transcription start site when RFX1 is removed by the methylated RFX1 consensus sequence (Fig. 1C). It seems that RFX1 has more affinity for α2(I) than α1(I), whereas RFX5 interacts slightly better with α1(I) than α2(I) (Fig. 1C).
Methylation of COL1A1 Inhibits Promoter Activity—The RFX consensus sequence on the COL1A1 promoter contains several potential methylation sites. Because we previously found that COL1A2 promoter activity is sensitive to methylation (7, 24, 25), experiments were performed to determine whether COL1A1 transcription is also methylation sensitive. Three human COL1A1 promoter constructs of different lengths were methylated using Sss1 methylase as previously described (7, 25) and transfected into IMR-90 cells. Promoter activities of all three COL1A1 constructs were dramatically down-regulated when they were methylated (Fig. 2). Therefore, it is clear that the human COL1A1 promoter is methylation sensitive, similar to the COL1A2 (7, 25).
Fig. 2.

COL1A1 promoter activity is sensitive to methylation. Three COL1A1 promoter-reporter constructs (−112, −311, and −804) were treated with (M) or without (U) Sss1 methylase and transfected separately into IMR-90 cells as described under “Methods and Materials.” Luciferase activities were normalized by both protein concentration and green fluorescent protein fluorescence. Each experiment was repeated three times and values represented mean ± S.D. Statistical significance was assessed by one-sample two-tailed t test. Methylase treatment significantly inhibited the activities of all three COL1A1 promoter constructs (**, p < 0.01).
COL1A1 Gene Is Methylated in Human Cancer Cells—Because the COL1A2 gene is methylated in human cancer cells, methylation status of the COL1A1 gene was evaluated. Genomic DNA extracted from six cancer cell lines and one normal cell line was modified by the bisulfite technique and analyzed using single nucleotide primer extension assays as we have reported previously (8). Bisulfite treatment converts cytosines to uracil in single-stranded DNA under conditions that do not alter 5-methylcytosine. After bisulfite modification, the collagen promoter and first exon regions were amplified by PCR using primers for the coding strand (Table I). To analyze methylation within the collagen RFX binding site, specific primers (Fig. 1A and Table I) were annealed to a sequence at the +6 CpG site followed by single nucleotide primer extension with radiolabeled nucleotides. The methylation status of the COL1A1 gene was compared in this experiment to the methylation status on the coding strand of +7 CpG site in the COL1A2 gene. There was coordinate methylation in all but one cell line (PLC/PRF/5) where, like W8 cells, the COL1A1 gene was not methylated, whereas the COL1A2 was methylated (Fig. 3A).
Fig. 3.
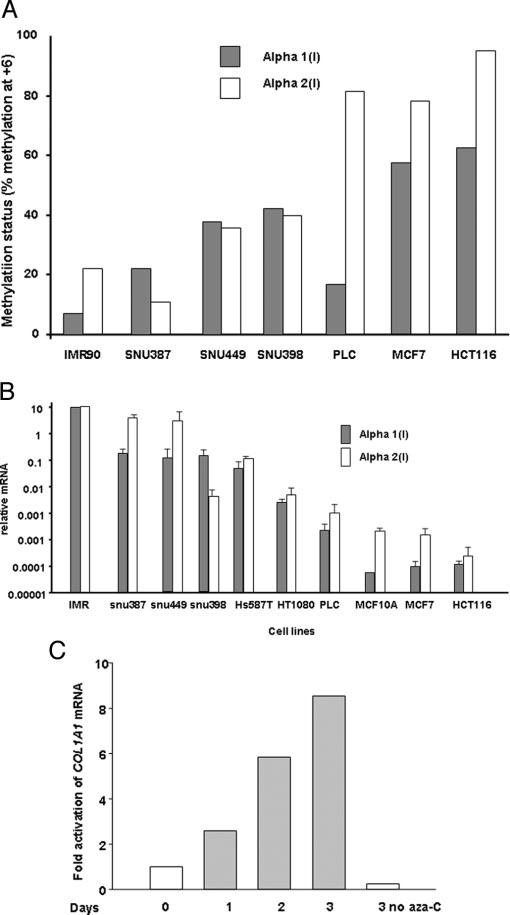
Methylation status at the RFX1 site in human cancer cells is inversely proportional to steady state mRNA level of the COL1A1 and COL1A2 genes. A, methylation status at the RFX1 site in human cancer cells. The methylation status at +7 of COL1A1 and COL1A2 genes was compared using normal (IMR90) and different cancer cell lines. Genomic DNA from the cell lines were bisulfite modified, amplified using converted primers, and the product was gel purified using 2% agarose gel. The isolated product was then subjected to primer extension (methylation sensitive-single nucleotide primer extension) using single radioactive dNTP and run in 7 m urea, 15% acrylamide sequencing gel at room temperature. The gel was partially dried and autoradiographed for 1 h at −80 °C. The percent methylation was determined as described under “Materials and Methods.” In the majority of cases both COL1A1 and COL1A2 genes are coordinately methylated in cancer cell lines compared with normal cell lines. B, steady state mRNA level of COL1A1 and COL1A2 genes in human cancer cells. Methylation status of the collagen gene at the +7 site correlated with mRNA expression. Steady state levels of COL1A1 and COL1A2 mRNA were measured using real-time RT-PCR. Primers used for these experiments are found in Table III. Relative mRNA for each cell line (bars) was normalized for 18 S rRNA and calculated using the 2[-Delta Delta C(T)] method (21, 68) comparing mRNA amounts measured from each cell line to mRNA amounts from normal unmethylated fibroblast (IMR-90). C, the aza-dC can reactivate the COL1A1 gene. A time study indicated the reactivation of COL1A1 gene in HT1080 cells after treatment of 1 μm aza-dC. Cells were treated with 1 μm aza-dC every day for 3 days, total RNA was isolated and reverse transcribed. Real-time RT-PCR was performed with collagen-specific primers and Taqman probe as presented in Table III. Reactivation of the COL1A1 gene was observed during 3 days of aza-dC treatment.
COL1A1 Expression Is Inversely Proportional to DNA Methylation in Cancer Cells—Next, steady state mRNA levels were measured by real-time RT-PCR to determine whether collagen expression is inversely correlated to collagen gene methylation. All the samples were normalized to 18 S rRNA and compared with the lung fibroblast cell mRNA as the standard in each real-time experiment using the 2(-Delta Delta C(T)) method (26) (Fig. 3B). At least three samples in duplicate were analyzed for each cell line (bar graph, Fig. 3B). In general, COL1A1 expression decreased with increasing methylation surrounding the collagen start site and correlated with COL1A2.
Collagen α1(I) Expression Is Reactivated by Demethylation using Aza-dC—To investigate whether the expression of mRNA for collagen is inactivated by methylation, the HT1080 cells were treated for different days with the demethylating agent, aza-dC. The steady state levels of COL1A1 increased in a time-dependent manner with aza-dC treatment similar to COL1A2 (Fig. 3C) (21). The data shown are a representative experiment performed three times in duplicate. Therefore, the expression of α1(I) mRNA is dependent, in part, on the methylation of the gene.
RFX1 Represses the COL1A1 Promoter Activity Less Than RFX5 in Transient Transfection—Co-transfection studies have been performed using α1(I) promoter (−311 to +114) luciferase constructs. RFX1 is a weaker repressor of the α1(I) promoter (Fig. 4A) than the α2(I) (8). On the other hand, RFX5 represses α1(I) (Fig. 4B) better than α2(I) (8). This may be the result of different binding affinities seen in gel shift analysis (Fig. 1). Co-transfection with the other RFX5 complex proteins (RFXB and RFXAP) repressed the α1(I) promoter (Fig. 4C) similar to the α2(I) promoter (8). Because these proteins are induced during IFN-γ treatment (15), we have confirmed results by others (27) that IFN-γ represses α1(I) promoter activity as well as the endogenous COL1A1 steady state mRNA levels (Fig. 4D).
Fig. 4.

RFX family of proteins repress COL1A1 promoter activity. A, RFX1 represses COL1A1 promoter construct. COL1A1 promoter construct (−311, 0.5 μg) was co-transfected with green fluorescent protein (0.1 μg) and increasing amounts of RFX1 constructs into FR cells. Luciferase activities were normalized by both protein concentration and green fluorescent protein fluorescence and expressed as a ratio compared with the empty vector control. Each experiment was repeated three times and values represent mean ± S.D. One-sample two-tailed t test was used to assess the statistical significance. At each dose tested, RFX1 significantly repressed COL1A1 promoter activity (*, p < 0.05). B, RFX5 represses the COL1A1 promoter construct. COL1A1 promoter construct (−311, 0.5 μg) was co-transfected with green fluorescent protein (0.1 μg) and increasing amounts of RFX5 constructs into FR cells. Luciferase activities were normalized by both protein concentration and green fluorescent protein fluorescence and expressed as a ratio compared with the empty vector control. Each experiment was repeated three times and values represent mean ± S.D. One-sample two-tailed t test was used to assess the statistical significance. At each dose tested, RFX1 significantly repressed COL1A1 promoter activity (**, p < 0.01). C, all three components of the RFX5 complex repress COL1A1 promoter activity better than individual members. COL1A1 promoter construct (−311, 0.5 μg) was co-transfected with green fluorescent protein (0.1 μg) and RFX5, RFXB, or RFXAP constructs individually or together into FR cells. Luciferase activities were normalized by both protein concentration and green fluorescent protein fluorescence and expressed as a ratio compared with the empty vector control. Each experiment was repeated three times and values represented mean ± S.D. One analysis of variance with post-hoc Scheffe test was used to assess the statistical significance. Co-transfection of three components of the RFX5 complex repressed COL1A1 promoter activity significantly more than each individual members (*, p < 0.05). D, IFN-γ represses the COL1A1 promoter construct in a dose-dependent manner. COL1A1 promoter construct (−311, 0.5 μg) was co-transfected with green fluorescent protein (0.1 μg) and increasing doses of IFN-γ into IMR-90 cells. Luciferase activities were normalized by both protein concentration and green fluorescent protein fluorescence and expressed as a ratio compared with the empty vector control. Each experiment was repeated three times and values represented mean ± S.D.
Dominant Negative RFX5 Mutants Increase Both Collagen Gene Expression and Decreases MHC II Expression—Because two mutated forms of RFX5 acted as dominant negative proteins activating COL1A2 promoter activity and blocking IFN-γ repression in transfection assays (15), we decided to test whether these proteins would activate endogenous collagen gene expression. Because human lung fibroblasts have low transfection efficiency, an efficient gene transfer system was needed to transfect cells that were not rapidly dividing. We decided to use the lentiviral expression system (Invitrogen) for several reasons. First, lentiviral vectors can transduce slow or even non-dividing cells (28-31). Second, transgenes introduced with the lentiviral backbone are more resistant to transcriptional silencing common to other retrovirus-transduced cells (32). Third, this vector can be used in animal studies because it can be expressed during development (30, 33). Finally, lentiviral-based gene therapy has begun using a third generation of vectors with elimination of certain genes (34-37) and the use of multiple constructs to package a non-replication competent lentivirus (33).
To analyze transduction efficiency, whole cell (IMR-90) extracts were prepared and Western analyses were performed after transduction to examine the expression of the viral clones using an anti-V5 antibody. The anti-V5 antibody recognizes the epitope present on the expressed proteins. All four constructs were expressed as proteins of correct sizes and expression levels of all four constructs were comparable (Fig. 5A).
Fig. 5.

Two RFX5 mutants behaved as dominant negative factors activating collagen transcription. A, top, schematic structures of wild type as well as two mutated RFX5 constructs; bottom, wild type RFX5, RFX5Δ1, and RFX5Δ5 as well as LacZ constructs were expressed in IMR-90 cells. IMR-90 cells were infected with virus carrying RFX5, RFX5Δ1, RFX5Δ5, or LacZ viral expression construct, or an empty vector (TOPO). 48 h after infection, cells were harvested and whole cell extracts were prepared as described under “Materials and Methods.” Protein expressions were examined by 10% SDS gel followed by Western blot using an anti-V5 antibody. B and C, RFX5Δ1 and RFX5Δ5 both acted as dominant negative proteins activating basal level as well as IFN-γ mediated COL1A1 (B) and COL1A2 (C) expression. IMR-90 cells were infected with or without virus carrying RFX5, RFX5Δ1, RFX5Δ5, or LacZ viral expression construct, or an empty vector (TOPO). 48 h after infection, cells were treated with 100 units/ml IFN-γ ([unk]) or without (□) for an additional 24 h before harvesting. COL1A1 (B) or COL1A2 (C) mRNA was amplified using primers listed in Table III by real-time PCR. Each experiment was repeated three times in duplicate wells and data are expressed as relative RNA levels compared with no infection control. One-sample two-tailed t test (without IFN-γ) or one-way analysis of variance (with IFN-γ) was employed to assess the statistical significance (*, p < 0.05; **, p < 0.01). D, RFX5Δ1 and RFX5Δ5 both blocked the IFN-γ stimulated expression of HLA-DRA molecules. IMR-90 cells were infected with or without virus carrying RFX5, RFX5Δ1, RFX5Δ5, or LacZ viral expression construct, or an empty vector (TOPO). 48 h after infection, cells were treated with 100 units/ml IFN-γ ([unk]) for an additional 24 h before harvesting. HLA-DRA mRNA was amplified using primers listed in Table III by real-time PCR. Each experiment was repeated three times in duplicate wells and data are expressed as relative RNA levels compared with no infection control. One-sample two-tailed t test was employed to assess the statistical significance (***, p < 0.01). E, lentiviral infections did not lead to detectable changes in expression of CIITA mRNA. IMR-90 cells were infected with or without virus carrying RFX5, RFX5Δ1, RFX5Δ5, or LacZ viral expression construct, or an empty vector (TOPO). 48 h after infection, cells were treated with 100 units/ml IFN-γ ([unk]) or without (□) for an additional 24 h before harvesting. CIITA mRNA was treated an additional 24 h before harvesting. HLA-DRA mRNA was amplified using primers listed in Table III by real-time PCR. A representative experiment was shown.
Next, steady state levels of COL1A1 mRNA were measured after viral infections in IMR-90 cells. Infections of the cells with either the empty vector or LacZ construct did not have any effect on COL1A1 mRNA levels with or without IFN-γ treatment (Fig. 5B). Infection of the cells with the RFX5 construct inhibited COL1A1 mRNA expression by about 15% on average without IFN-γ treatment (Fig. 5B) (one-sample two tailed t test, p < 0.01). In the presence of IFN-γ, RFX5 infection down-regulated COL1A1 mRNA level by 52% (one-sample two tailed t test, p < 0.05) indicating that RFX5 was a negative regulator of collagen expression in vivo. Both RFX5Δ1 and RFX5Δ5 infections activated COL1A1 mRNA expression with or without IFN-γ treatment (Fig. 5B, without IFN-γ one-sample two tailed t test, p < 0.1 for RFX5Δ1 and p < 0.05 for RFX5Δ5; with IFN-γ one-way analysis of variance, p < 0.05 for both RFX5Δ1 and RFX5Δ5), confirming that these two mutants had dominant negative effects on endogenous COL1A1 gene expression. However, in the presence of IFN-γ, the repression of mRNA steady state levels is only partially reversed and do not reach control levels, possibly because RFX5 complex protein levels increase with IFN-γ treatment (15). Steady state COL1A2 mRNA levels were also activated by RFX5Δ1 and RFX5Δ5 with or without IFN-γ treatment (Fig. 5C). These data suggested that both RFX5Δ1 and RFX5Δ5 acted as dominant negative factors coordinately on endogenous collagen type I transcription.
Because RFX5 has been reported to be an effective activator of MHC II expression (38), similar experiments were performed to examine the effect of RFX5 mutants on the endogenous MHC II expression in human lung fibroblast cells. RFX5 tended to enhance the HLA-DRA mRNA expression by IFN-γ (Fig. 5D, one-sample two tailed t test, p < 0.1). Both RFX5Δ1 and RFX5Δ5 dramatically inhibited the IFN-γ-induced HLA-DRA expression (Fig. 5D, one-sample two tailed t test, p < 0.01 for both RFX5Δ1 and RFX5Δ5) strongly arguing that RFX5 is an important factor for both collagen and MHC II transcription.
Because lentiviral infection can induce an IFN-γ response in some cells and because CIITA expression is markedly induced by IFN-γ, viral expression alone could induce CIITA expression. Therefore, CIITA expression in cells after transduction was analyzed as a negative control. As expected, IFN-γ markedly up-regulated CIITA expression. Most importantly, none of the infections had any effect on expression of CIITA mRNA, confirming that dominant effects of RFX5 mutants were gene-specific rather than artifacts of lentiviral infection (Fig. 5E).
CIITA Is a Repressor of COL1A1 Gene Expression—CIITA is recruited to the COL1A2 gene, in part through RFX5 and is an important mediator of IFN-γ-induced repression of COL1A2 transcription (16). Therefore, several experiments were conducted to determine whether COL1A1 was also sensitive to CIITA-mediated repression. First, co-transfection experiments indicated that CIITA repressed COL1A1 promoter activity in a dose responsive manner (Fig. 6A). To determine whether CIITA increases repression beyond RFX5, CIITA was co-transfected alone and with the RFX5 complex with slightly additive effect (Fig. 6B). Deletion mutations in CIITA had the same effects on both collagen promoters (data not shown) suggesting a role for CIITA in repression of both collagen genes.
Fig. 6.

CIITA represses COL1A1 promoter construct. A, COL1A1 promoter construct (−311, 0.5 μg) was co-transfected with green fluorescent protein (0.1 μg) and increasing amounts of CIITA constructs into FR cells. Luciferase activities were normalized by both protein concentration and green fluorescent protein fluorescence and expressed as a ratio compared with the empty vector control. Each experiment was repeated three times and values represented mean ± S.D. One-sample two-tailed t test was used to assess the statistical significance. At each dose tested, CIITA significantly repressed COL1A1 promoter activity (**, p < 0.01). B, all three components of the RFX5 complex with CIITA repress COL1A1 promoter activity better than CIITA alone. COL1A1 promoter construct (−311, 0.5 μg) was co-transfected with green fluorescent protein (0.1 μg) and RFX5, RFXB, or RFXAP constructs together with or without CIITA into IMR-90 cells. Luciferase activities were normalized by both protein concentration and GFP fluorescence and expressed as a ratio compared with the empty vector control. Each experiment was repeated three times and values represented mean ± S.D.
The next question is whether CIITA is an important COL1A1 repressor induced and activated in fibroblasts during IFN-γ treatment. In our earlier publication (16) we used RNAi to CIITA in lentiviral vectors to knock-down the IFN-γ-stimulated expression of CIITA in human lung fibroblasts. Briefly, shRNA sequences against different regions of CIITA were cloned into a lentiviral vector. Three viral stocks were generated using lentiviral vectors containing different CIITA shRNA sequences to infect human lung fibroblasts. Cells were transduced and treated 48 h after infection with IFN-γ for an additional 24 h before harvesting. Two clones, named pLenti6-CSH4 and pLenti6-CSH6, respectively, were able to inhibit IFN-γ-induced expression of CIITA at both mRNA and protein levels (16). Expression of a certain MHC II molecule, HLADRA, was also examined and CIITA shRNA could specifically block the stimulation of HLA-DRA expression by IFN-γ. Moreover, the CIITA RNAi were capable of alleviating the IFN-γ-mediated down-regulation of COL1A2 mature mRNA suggesting that CIITA is required for IFN-γ-mediated COL1A2 transcription repression. Here we demonstrate that CIITA is also required for IFN-γ-mediated COL1A1 repression (Fig. 7A). The relative mRNA levels of collagen decreased when CIITA protein levels increased as demonstrated by the linear regression plot of four experiments performed in duplicate (Fig. 7B). This data confirms that CIITA is a key regulator of collagen type I expression.
Fig. 7.
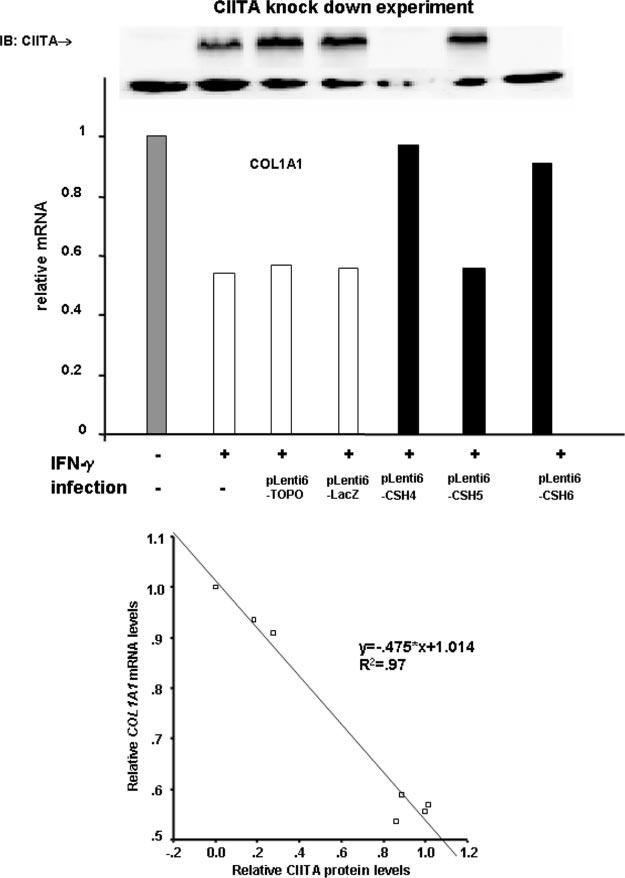
Inhibition of IFN-γ-induced expression of CIITA leads to partial alleviation of collagen repression. A, CIITA protein levels (top panel) and mRNA levels (lower graph) are decreased by CSH4 and CSH6 shRNAi. RNAi experiments were performed as described under “Materials and Methods.” Each experiment was repeated at least three times and a representative figure of CIITA Western blot and mRNA each was shown. B, top panel, collagen (COL1A1) mRNA levels are not repressed by IFN-γ in the presence of CSH4 and CSH6 shRNA. RNAi experiments were performed as described under “Materials and Methods.” Bottom panel, average COL1A1 mRNA level was plotted versus the CIITA protein level in four experiments performed in duplicate. Linear regression curve demonstrates significant correlation between high levels of CIITA and low levels of COL1A1.
In summary, COL1A1 has an RFX consensus binding site in a similar region to the COL1A2 gene that contains three methylation sites rather than one. The COL1A1 gene is aberrantly methylated in human cancer cells and the transcription of COL1A1 is down-regulated in cancer cells, a process that can be reversed by aza-dC. RFX1 represses COL1A1 less efficiently than COL1A2. On the other hand, RFX5 complex and CIITA repress both type I genes in response to IFN-γ.
DISCUSSION
Previously, we demonstrated that the COL1A2 transcription start site has a methylation responsive binding site for the RFX family mostly within the first exon (−1to +20) (7, 9). The RFX1 protein represses collagen transcription and binds with higher affinity when the C at +7 is methylated on the coding strand or mutated from C to T (7-9). In addition, the +7 site as well as several other CpG sites in the surrounding area become methylated in cancer cell lines and tumors (21). The COL1A1 gene has limited homology to the COL1A2 gene with a crucial base missing within the RFX binding site placing the CpG site at +6. Therefore, because these two genes need to be coordinately expressed for normal collagen production, it was important to determine whether the COL1A1 gene also contains a functional RFX binding site. In the present study, we demonstrate that the COL1A1 gene is methylated at the collagen transcription start site within a RFX consensus binding site (−11 to +10). The RFX binding region in the COL1A1 gene contains the transcription start site and 3 rather than 1 methylation sites. COL1A1 construct was extremely sensitive to methylation. Others have also reported that methylation of the COL1A1 promoter constructs is accompanied by down-regulation of promoter activity (39-42). The mechanism for promoter repression was described as indirect (41), possibly through chromatin (42). Indeed, recent evidence demonstrates that chromatin changes and DNA methylation are linked and are important in cancer (43-45). The linkage occurs in part because certain methylation binding factors (46) and/or transcription factors such as Rb (47), recruit co-repressor complexes that contain histone modifying enzymes that may induce a more compact chromatin configuration (48, 49). Our preliminary data suggest that RFX1 interacts with histone deacetylases and DNA methyltranserases that may alter the histone acetylation and methylate DNA surrounding the collagen transcription start site when RFX1 interacts with DNA.2
COL1A1 methylation has been noted in aging periodontal fibroblasts (40), in MOV virus integration (50-52) and during development (53), but it has not been reported previously in human cancer cells. Because the COL1A2 RFX1 site is methylated in human cancer cells, the same cells were examined for methylation status at the +6 CpG site in COL1A1. The COL1A1 gene was methylated in cells that also contained COL1A2 methylation. As expected, COL1A1 expression was inversely proportional to the DNA methylation status. In addition, COL1A1 expression was increased with time in the presence of aza-dC, an agent that decreases overall DNA methylation similar to other studies with transfected constructs (42). Thus, COL1A1 joins the multiple examples of genes that are aberrantly methylated in aberrant cancers, such as cell cycle-related (RB1, p16INK4A), DNA repair (hMLH1, MGMT), adhesion molecule (E cadherin), and extracellular matrix (thrombospondin, TIMP3) genes (for review, see Ref. 44). Recent investigation of the hypermethylated regions have focused on so called “CpG islands” that are short regions (0.5–4 kb) with high numbers (>100) of methylated CpG sites that are normally not methylated. These regions are usually within promoters of genes close to the start site. In the case of both collagen type I genes the major methylation sites within RFX1 site are located near the transcription start site. The COL1A1 region is in a limited CpG-like island with more CpG sites than COL1A2. Because the COL1A1 promoter/first exon is highly sensitive to DNA methylation and RFX1, a repressor for this gene, binds with higher affinity to the methylated sequence, RFX1 may be responsible in part for repression of COL1A1 on methylated sequences.
Our previous data demonstrate that RFX5 also interacts with the COL1A2 start site, as judged by gel shift migration patterns and blocking of binding by RFX5 and RFXB antibodies (8, 9). This was the first demonstration that RFX5 complex can form on DNA other than on the X-box site in the MHC I or MHC II promoters. RFX5 complex interacts with the COL1A1 gene with similar affinity to COL1A2 on gel shift analysis. RFX5 complex assembly causes repression of COL1A2 and activation of MHC II (23, 54). Using mutational studies to examine protein-protein interactions and DNA-protein interactions, it was demonstrated that all three components are critical for COL1A2 (15). Most likely, all three components are necessary for COL1A1 repression as well.
IFN-γ treatment of human lung fibroblasts increases the expression of RFX5 complex proteins, increases nuclear location, and enhances complex formation of RFX5 (15). Furthermore, mutants of RFX5 containing either deletions of the DNA binding domain (RFX5Δ1) or the proline-rich CIITA interaction domain (RFX5Δ5) can compete with wild-type RFX5 and reverse the COL1A2 promoter repression (15). When these same cDNAs are cloned into lentivirus to increase the efficiency of expression in human lung fibroblasts, the endogenous levels of both collagen type I genes increase by ∼20–30% with or without IFN-γ. This is a small, but significant increase in endogenous steady state mRNA levels. Strikingly, the human lung fibroblasts express MHC II after 24 h of IFN-γ treatment and both RFX5 mutants repress this activation. This data suggests that the RFX5 DNA binding domain and the CIITA interaction domain are important for IFN-γ mediated coordinate repression of type I collagen.
CIITA is considered as a master regulator of MHC II gene expression (55, 56). However, this protein also enhances the transcription of the invariant chains coordinately regulated with classical MHC II, suggesting that it could be an important protein for antigen presentation (57, 58). Recently, it has been established using microarray analysis that multiple genes are both activated and suppressed by CIITA (59). COL1A2 is one of the genes repressed by CIITA (8, 60) along with interleukin-4 (61, 62), cathepsin E (63), and Fas ligand (64). This paper demonstrates that CIITA coordinately represses transcription of both type I collagen genes.
We and others have demonstrated that CIITA is dramatically induced in human lung fibroblasts by IFN-γ as judged by mRNA and protein levels (16, 65-67). When CIITA is co-transfected with either collagen type I promoter, promoter activity is greatly reduced when RFX5 complex is active (16). Most important, when shRNA is used to block the CIITA expression, IFN-γ mediated repression of collagen type I is coordinately attenuated.
In conclusion, both collagen type I genes are coordinately regulated by RFX family members through a binding site close to the transcription start site (model Fig. 8). Both collagen genes are methylated in several human cancer cells and the degree of methylation is inversely correlated with collagen type I expression. RFX1–RFX3 may be involved in this process because they tend to bind to methylated genes with higher affinities, underscoring a potential role for RFX1 in collagen gene down-regulation during carcinogenesis. On the other hand, RFX5 and CIITA may be important proteins in IFN-γ-mediated repression of both collagen type I genes. In the human lung fibroblasts, increased levels of RFX5 and CIITA also activate MHC II. Therefore, RFX5/CIITA proteins may be essential for initiating inflammatory response and delaying tissue repair.
Fig. 8.
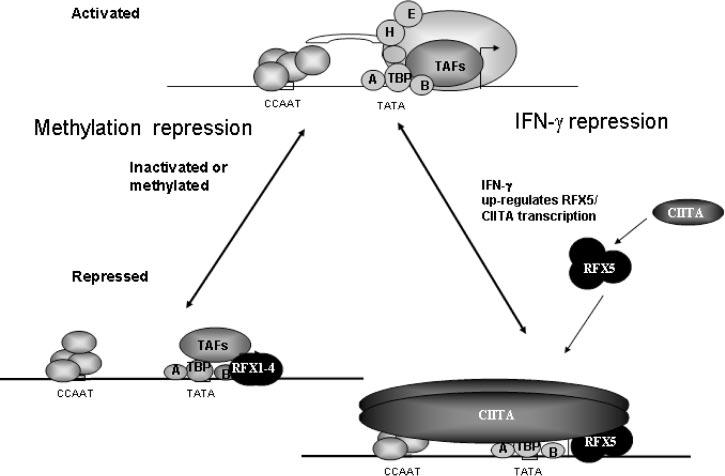
Model of collagen repression. A schematic representation showing repression of collagen gene expression by methylation and IFN-γ through the RFX family.
Footnotes
The costs of publication of this article were defrayed in part by the payment of page charges. This article must therefore be hereby marked “advertisement” in accordance with 18 U.S.C. Section 1734 solely to indicate this fact.
The abbreviations used are: IFN-γ, interferon-γ; CTIIA, class II transactivator; MS-SNuPE, methylation-sensitive single nucleotide primer extension; MHC, major histocompatability class; RNAi, RNA interference; DMEM, Dulbecco's modified Eagle's medium; FBS, fetal bovine serum; aza-dC, 5-aza-2′-deoxycytidine; shRNA, short hairpin RNA; RT, reverse transcriptase.
P. K. Sengupta, unpublished data.
REFERENCES
- 1.Hirtenlehne K, Pec M, Kubista E, Singer CF. Eur. Cytokine Netw. 2002;13:234–240. [PubMed] [Google Scholar]
- 2.Adams SL, Sobel ME, Howard BH, Olden K, Yamada KM, de Crombrugghe B, Pastan I. Proc. Natl. Acad. Sci. U. S. A. 1977;74:3399–3403. doi: 10.1073/pnas.74.8.3399. [DOI] [PMC free article] [PubMed] [Google Scholar]
- 3.Rowe DW, Moen RC, Davidson JM, Byers PH, Bornstein P, Palmiter RD. Biochemistry. 1978;17:1581–1590. doi: 10.1021/bi00602a001. [DOI] [PubMed] [Google Scholar]
- 4.Sandmeyer S, Smith R, Kiehn D, Bornstein P. Cancer Res. 1981;41:830–838. [PubMed] [Google Scholar]
- 5.Smith BD, Niles R. Biochemistry. 1980;19:1820–1825. doi: 10.1021/bi00550a014. [DOI] [PubMed] [Google Scholar]
- 6.Smith BD, Marsilio E. Biochem. J. 1988;253:269–273. doi: 10.1042/bj2530269. [DOI] [PMC free article] [PubMed] [Google Scholar]
- 7.Sengupta PK, Smith BD. Biochim. Biophys. Acta. 1998;1443:75–89. doi: 10.1016/s0167-4781(98)00188-2. [DOI] [PubMed] [Google Scholar]
- 8.Sengupta PK, Fargo J, Smith BD. J. Biol. Chem. 2002;277:24926–24937. doi: 10.1074/jbc.M111712200. [DOI] [PubMed] [Google Scholar]
- 9.Sengupta PK, Erhlich M, Smith BD. J. Biol. Chem. 1999;274:36649–36655. doi: 10.1074/jbc.274.51.36649. [DOI] [PubMed] [Google Scholar]
- 10.Emery P, Durand B, Mach B, Reith W. Nucleic Acids Res. 1996;24:803–807. doi: 10.1093/nar/24.5.803. [DOI] [PMC free article] [PubMed] [Google Scholar]
- 11.Reith W, Ucla C, Barras E, Gaud A, Durand B, Herrero-Sanchez C, Kobr M, Mach B. Mol. Cell. Biol. 1994;14:1230–1244. doi: 10.1128/mcb.14.2.1230. [DOI] [PMC free article] [PubMed] [Google Scholar]
- 12.Huang LH, Wang R, Gama-Sosa MA, Shenoy S, Ehrlich M. Nature. 1984;308:293–295. doi: 10.1038/308293a0. [DOI] [PubMed] [Google Scholar]
- 13.Zhang XY, Jabrane-Ferrat N, Asiedu CK, Samac S, Peterlin BM, Ehrlich M. Mol. Cell. Biol. 1993;13:6810–6818. doi: 10.1128/mcb.13.11.6810. [DOI] [PMC free article] [PubMed] [Google Scholar]
- 14.Zhang XY, Asiedu CK, Supakar PC, Khan R, Ehrlich KC, Ehrlich M. Nucleic Acids Res. 1990;18:6253–6260. doi: 10.1093/nar/18.21.6253. [DOI] [PMC free article] [PubMed] [Google Scholar]
- 15.Xu Y, Wang L, Buttice G, Sengupta PK, Smith BD. J. Biol. Chem. 2003;278:49134–49144. doi: 10.1074/jbc.M309003200. [DOI] [PubMed] [Google Scholar]
- 16.Xu Y, Wang L, Buttice G, Sengupta PK, Smith BD. J. Biol. Chem. 2004;279:41319–41332. doi: 10.1074/jbc.M404174200. [DOI] [PubMed] [Google Scholar]
- 17.Villard J, Masternak K, Lisowska-Grospierre B, Fischer A, Reith W. Medicine (Baltimore) 2001;80:405–418. doi: 10.1097/00005792-200111000-00006. [DOI] [PubMed] [Google Scholar]
- 18.Reith W, Mach B. Annu. Rev. Immunol. 2001;19:331–373. doi: 10.1146/annurev.immunol.19.1.331. [DOI] [PubMed] [Google Scholar]
- 19.Widom RL, Lee JY, Joseph C, Gordon-Froome I, Korn JH. Matrix Biol. 2001;20:451–462. doi: 10.1016/s0945-053x(01)00167-6. [DOI] [PubMed] [Google Scholar]
- 20.Dignam JD, Martin PL, Shastry BS, Roeder RG. Methods Enzymol. 1983;101:582–598. doi: 10.1016/0076-6879(83)01039-3. [DOI] [PubMed] [Google Scholar]
- 21.Sengupta S, Smith EM, Kim K, Murnane MJ, Smith BD. Cancer Res. 2003;63:1789–1797. [PubMed] [Google Scholar]
- 22.Gonzalgo ML, Jones PA. Nucleic Acids Res. 1997;25:2529–2531. doi: 10.1093/nar/25.12.2529. [DOI] [PMC free article] [PubMed] [Google Scholar]
- 23.DeSandro AM, Nagarajan UM, Boss JM. Mol. Cell. Biol. 2000;20:6587–6599. doi: 10.1128/mcb.20.17.6587-6599.2000. [DOI] [PMC free article] [PubMed] [Google Scholar]
- 24.Smith BD. Ann. N. Y. Acad. Sci. 1990;580:459–461. [Google Scholar]
- 25.Guenette DK, Ritzenthaler JD, Foley J, Jackson JD, Smith BD. Biochem. J. 1992;283:699–703. doi: 10.1042/bj2830699. [DOI] [PMC free article] [PubMed] [Google Scholar]
- 26.Livak KJ, Schmittgen TD. Methods. 2001;25:402–408. doi: 10.1006/meth.2001.1262. [DOI] [PubMed] [Google Scholar]
- 27.Yuan W, Yufit T, Li L, Mori Y, Chen SJ, Varga J. J. Cell. Physiol. 1999;179:97–108. doi: 10.1002/(SICI)1097-4652(199904)179:1<97::AID-JCP12>3.0.CO;2-E. [DOI] [PubMed] [Google Scholar]
- 28.Naldini L, Blomer U, Gallay P, Ory D, Mulligan R, Gage FH, Verma IM, Trono D. Science. 1996;272:263–267. doi: 10.1126/science.272.5259.263. [DOI] [PubMed] [Google Scholar]
- 29.Chen M, Li W, Fan J, Kasahara N, Woodley D. Clin. Exp. Dermatol. 2003;28:193–199. doi: 10.1046/j.1365-2230.2003.01191.x. [DOI] [PubMed] [Google Scholar]
- 30.Ravot E, Comolli G, Lori F, Lisziewicz J. J. Gene Med. 2002;4:161–169. doi: 10.1002/jgm.256. [DOI] [PubMed] [Google Scholar]
- 31.Dishart KL, Denby L, George SJ, Nicklin SA, Yendluri S, Tuerk MJ, Kelley MP, Donahue BA, Newby AC, Harding T, Baker AH. J. Mol. Cell Cardiol. 2003;35:739–748. doi: 10.1016/s0022-2828(03)00136-6. [DOI] [PubMed] [Google Scholar]
- 32.Gerolami R, Uch R, Jordier F, Chapel S, Bagnis C, Brechot C, Mannoni P. Cancer Gene Ther. 2000;7:1286–1292. doi: 10.1038/sj.cgt.7700225. [DOI] [PubMed] [Google Scholar]
- 33.Stathopulos PB. Biotechnol. Adv. 2003;21:513–526. doi: 10.1016/s0734-9750(03)00102-2. [DOI] [PubMed] [Google Scholar]
- 34.Chen M, Kasahara N, Keene DR, Chan L, Hoeffler WK, Finlay D, Barcova M, Cannon PM, Mazurek C, Woodley DT. Nat. Genet. 2002;32:670–675. doi: 10.1038/ng1041. [DOI] [PubMed] [Google Scholar]
- 35.Gouze E, Pawliuk R, Gouze JN, Pilapil C, Fleet C, Palmer GD, Evans CH, Leboulch P, Ghivizzani SC. Mol. Ther. 2003;7:460–466. doi: 10.1016/s1525-0016(03)00024-8. [DOI] [PubMed] [Google Scholar]
- 36.Villani GR, Follenzi A, Vanacore B, Di Domenico C, Naldini L, Di Natale P. Biochem. J. 2002;364:747–753. doi: 10.1042/BJ20011872. [DOI] [PMC free article] [PubMed] [Google Scholar]
- 37.Di Natale P, Di Domenico C, Villani GR, Lombardo A, Follenzi A, Naldini L. Eur. J. Biochem. 2002;269:2764–2771. doi: 10.1046/j.1432-1033.2002.02951.x. [DOI] [PubMed] [Google Scholar]
- 38.Durand B, Kobr M, Reith W, Mach B. Mol. Cell. Biol. 1994;14:6839–6847. doi: 10.1128/mcb.14.10.6839. [DOI] [PMC free article] [PubMed] [Google Scholar]
- 39.Yamane K, Suzuki H, Ihn H, Kato M, Yoshikawa H, Tamaki K. J. Cell. Physiol. 2005;202:822–830. doi: 10.1002/jcp.20205. [DOI] [PubMed] [Google Scholar]
- 40.Takatsu M, Uyeno S, Komura J, Watanabe M, Ono T. Mech. Ageing Dev. 1999;110:37–48. doi: 10.1016/s0047-6374(99)00041-x. [DOI] [PubMed] [Google Scholar]
- 41.Rhodes K, Rippe RA, Umezawa A, Nehls M, Brenner DA, Breindl M. Mol. Cell. Biol. 1994;14:5950–5960. doi: 10.1128/mcb.14.9.5950. [DOI] [PMC free article] [PubMed] [Google Scholar]
- 42.Thompson JP, Simkevich CP, Holness MA, Kang AH, Raghow R. J. Biol. Chem. 1991;266:2549–2556. [PubMed] [Google Scholar]
- 43.Esteller M. Adv. Exp. Med. Biol. 2003;532:39–49. doi: 10.1007/978-1-4615-0081-0_5. [DOI] [PubMed] [Google Scholar]
- 44.Jones PA, Baylin SB. Nat. Rev. Genet. 2002;3:415–428. doi: 10.1038/nrg816. [DOI] [PubMed] [Google Scholar]
- 45.El-Osta A. Cancer Biol. Ther. 2004;3:816–818. doi: 10.4161/cbt.3.9.1100. [DOI] [PubMed] [Google Scholar]
- 46.Jorgensen HF, Bird A. Ment. Retard. Dev. Disabil. Res. Rev. 2002;8:87–93. doi: 10.1002/mrdd.10021. [DOI] [PubMed] [Google Scholar]
- 47.Robertson KD, Ait-Si-Ali S, Yokochi T, Wade PA, Jones PL, Wolffe AP. Nat. Genet. 2000;25:338–342. doi: 10.1038/77124. [DOI] [PubMed] [Google Scholar]
- 48.Hake SB, Xiao A, Allis CD. Br. J. Cancer. 2004;90:761–769. doi: 10.1038/sj.bjc.6601575. [DOI] [PMC free article] [PubMed] [Google Scholar]
- 49.Jaenisch R, Bird A. Nat. Genet. 2003;33(suppl):245–254. doi: 10.1038/ng1089. [DOI] [PubMed] [Google Scholar]
- 50.Chan H, Hartung S, Breindl M. Mol. Cell. Biol. 1991;11:47–54. doi: 10.1128/mcb.11.1.47. [DOI] [PMC free article] [PubMed] [Google Scholar]
- 51.Barker DD, Wu H, Hartung S, Breindl M, Jaenisch R. Mol. Cell. Biol. 1991;11:5154–5163. doi: 10.1128/mcb.11.10.5154. [DOI] [PMC free article] [PubMed] [Google Scholar]
- 52.Hartung S, Jaenisch R, Breindl M. Nature. 1986;320:365–367. doi: 10.1038/320365a0. [DOI] [PubMed] [Google Scholar]
- 53.Rhodes K, Breindl M. Gene Expr. 1992;2:59–69. [PMC free article] [PubMed] [Google Scholar]
- 54.Nekrep N, Jabrane-Ferrat N, Peterlin BM. Mol. Cell. Biol. 2000;20:4455–4461. doi: 10.1128/mcb.20.12.4455-4461.2000. [DOI] [PMC free article] [PubMed] [Google Scholar]
- 55.Steimle V, Otten LA, Zufferey M, Mach B. Cell. 1993;75:135–146. [PubMed] [Google Scholar]
- 56.Silacci P, Mottet A, Steimle V, Reith W, Mach B. J. Exp. Med. 1994;180:1329–1336. doi: 10.1084/jem.180.4.1329. [DOI] [PMC free article] [PubMed] [Google Scholar]
- 57.Taxman DJ, Cressman DE, Ting JP. J. Immunol. 2000;165:1410–1416. doi: 10.4049/jimmunol.165.3.1410. [DOI] [PubMed] [Google Scholar]
- 58.Westerheide SD, Louis-Plence P, Ping D, He XF, Boss JM. J. Immunol. 1997;158:4812–4821. [PubMed] [Google Scholar]
- 59.Nagarajan UM, Bushey A, Boss JM. J. Immunol. 2002;169:5078–5088. doi: 10.4049/jimmunol.169.9.5078. [DOI] [PubMed] [Google Scholar]
- 60.Zhu XS, Ting JP. Mol. Cell. Biol. 2001;21:7078–7088. doi: 10.1128/MCB.21.20.7078-7088.2001. [DOI] [PMC free article] [PubMed] [Google Scholar]
- 61.Gourley T, Roys S, Lukacs NW, Kunkel SL, Flavell RA, Chang CH. Immunity. 1999;10:377–386. doi: 10.1016/s1074-7613(00)80037-0. [DOI] [PubMed] [Google Scholar]
- 62.Sisk TJ, Gourley T, Roys S, Chang CH. J. Immunol. 2000;165:2511–2517. doi: 10.4049/jimmunol.165.5.2511. [DOI] [PubMed] [Google Scholar]
- 63.Yee CS, Yao Y, Li P, Klemsz MJ, Blum JS, Chang CH. J. Immunol. 2004;172:5528–5534. doi: 10.4049/jimmunol.172.9.5528. [DOI] [PubMed] [Google Scholar]
- 64.Gourley TS, Chang CH. J. Immunol. 2001;166:2917–2921. doi: 10.4049/jimmunol.166.5.2917. [DOI] [PubMed] [Google Scholar]
- 65.Steimle V, Siegrist CA, Mottet A, Lisowska-Grospierre B, Mach B. Science. 1994;265:106–109. doi: 10.1126/science.8016643. [DOI] [PubMed] [Google Scholar]
- 66.Moreno CS, Rogers EM, Brown JA, Boss JM. J. Immunol. 1997;158:5841–5848. [PubMed] [Google Scholar]
- 67.Navarrete Santos A, Riemann D, Thiele K, Kehlen A, Langner J. Immunol. Lett. 1997;58:53–58. doi: 10.1016/s0165-2478(97)02712-0. [DOI] [PubMed] [Google Scholar]
- 68.Winer J, Jung CK, Shackel I, Williams PM. Anal. Biochem. 1999;270:41–49. doi: 10.1006/abio.1999.4085. [DOI] [PubMed] [Google Scholar]
- 69.Katan-Khaykovich Y, Shaul Y. J. Biol. Chem. 1998;273:24504–24512. doi: 10.1074/jbc.273.38.24504. [DOI] [PubMed] [Google Scholar]