Abstract
Synaptic transmission from cones is faster than transmission from rods. Using paired simultaneous recordings from photoreceptors and second-order neurones in the salamander retina, we studied the contributions of rod–cone differences in glutamate receptor properties and synaptic release rates to shaping postsynaptic responses. Depolarizing steps evoked sustained calcium currents in rods and cones that in turn produced transient excitatory postsynaptic currents (EPSCs) in horizontal and OFF bipolar cells. Cone-driven EPSCs rose and decayed faster than rod-driven EPSCs, even when comparing inputs from a rod and cone onto the same postsynaptic neurone. Thus, rod–cone differences in EPSCs reflect properties of individual rod and cone synapses. Experiments with selective AMPA and KA agonists and antagonists showed that rods and cones both contact pharmacologically similar AMPA receptors. Spontaneous miniature EPSCs (mEPSCs) exhibited unimodal distributions of amplitude and half-amplitude time width and there were no rod–cone differences in mEPSC properties. To examine how release kinetics shape the EPSC, we convolved mEPSC waveforms with empirically determined release rate functions for rods and cones. The predicted EPSC waveform closely matched the actual EPSC evoked by cones, supporting a quantal release model at the photoreceptor synapse. Convolution with the rod release function also produced a good match in rod-driven cells, although the actual EPSC was often somewhat slower than the predicted EPSC, a discrepancy partly explained by rod–rod coupling. Rod–cone differences in the rates of exocytosis are thus a major factor in producing faster cone-driven responses in second-order retinal neurones.
Light responses of cones and cone-driven second-order neurones in the retina are much faster than the responses of rods and rod-driven neurones (Baylor & Hodgkin, 1973; Pasino & Marchiafava, 1976; Schnapf & Copenhagen, 1982; Witkovsky & Stone, 1983; Copenhagen et al. 1983). Faster synaptic transmission in the cone pathway (Baylor & Fettiplace, 1977; Schnapf & Copenhagen, 1982; Copenhagen et al. 1983) supports the faster light responses of cones. For example, the impulse response at the cone-horizontal cell synapse is 8–10 times faster than the impulse response at the rod synapse, roughly matched to differences in the kinetics of rod and cone light responses (Schnapf & Copenhagen, 1982). Using paired simultaneous whole-cell recordings from photoreceptors and second-order neurones, we found that, consistent with faster synaptic transmission in the cone pathway, cone-driven EPSCs rise and decay much more rapidly than rod-driven EPSCs. Rabl et al. (2005) suggested that rod–cone differences in synaptic kinetics derive, at least in part, from differences in the kinetics of vesicular release at rod and cone terminals: cones exhibit an initial rapid component of exocytosis that is more than tenfold faster than the initial component of exocytosis from rods. However, it has also been proposed that rods and cones may contact different types of glutamate receptors (Kim & Miller, 1991) with different kinetic properties (Maple et al. 1999). The present study analysed the contributions of rod–cone differences in postsynaptic glutamate receptor properties and presynaptic release kinetics to the faster EPSCs at cone synapses.
OFF bipolar and horizontal cells in amphibian and mammalian retina possess only non-NMDA ionotropic glutamate receptors (reviewed by Thoreson & Witkovsky, 1999). There are striking kinetic differences between KA- and AMPA-type non-NMDA receptors: AMPA receptors desensitize nearly tenfold faster than KA receptors (Dingledine et al. 1999) and native KA receptors exhibit even slower kinetics than expressed KA receptors (Kidd & Isaac, 2001). The cell-specific expression of different AMPA and KA receptors with different desensitization properties have been shown to shape the postsynaptic currents in different classes of cone-driven OFF bipolar cells from the ground squirrel retina (DeVries, 2000). We hypothesized that there may be similar differences at rod and cone synapses, but using selective pharmacological agents we found that glutamate receptors at both rod and cone synapses in the salamander retina are largely of the AMPA type. We also found no appreciable differences in the properties of spontaneous mEPSCs derived from rods and cones in any individual OFF bipolar or horizontal cell, although there were differences between cells. These results suggest that glutamate receptor properties do not contribute significantly to promoting faster transmission in the cone pathway.
To predict the impact of rod–cone differences in release kinetics, we need an appropriate model relating presynaptic release kinetics to the postsynaptic response. We hypothesized that the photoreceptor synapse adheres to the quantal hypothesis of exocytosis developed by del Castillo & Katz, 1954). According to this hypothesis, the EPSC derives from a linear superposition of unitary postsynaptic current events (mEPSCs) in a single-compartment (isopotential), voltage-clamped postsynaptic neurone. Although the quantal hypothesis can adequately account for postsynaptic responses at many CNS synapses (Redman, 1990; Sakaba et al. 2002), the graded response properties of photoreceptors, their ability to release glutamate for an indefinite period of time, the structure of the presynaptic ribbon with its numerous tethered vesicles, and the finding that pre- and postsynaptic processes are not in intimate association as in typical CNS synapses have prompted the suggestion that release from photoreceptor synapses may differ from that at conventional CNS synapses. Thus, it has been proposed that rather than being determined by the statistically independent actions of individual vesicles, the postsynaptic responses of second-order retinal neurones may instead reflect changes in the spatially integrated level of glutamate in the cleft determined by a balance between the release and re-uptake of glutamate (Gaal et al. 1998; Roska et al. 1998). To establish whether use of a quantal release model was appropriate, we analysed whether mEPSCs in OFF bipolar and horizontal cells exhibit statistical properties consistent with individual, independently released quanta. We then tested whether it was possible to reconstruct the EPSC by convolving the mEPSC waveform with the synaptic transmitter release rate function. The results show that convolution of the waveforms of spontaneously occurring mEPSCs with the empirically determined synaptic transmitter release rate function closely matched the EPSC waveforms evoked by depolarizing steps applied to cones. Convolution of mEPSCs with rod release functions also produced a good match to the EPSCs in some rod-driven neurones but the actual EPSCs were slower than those predicted by the convolution in a number of other rod-driven cells. We present evidence that this difference is partly explained by rod–rod coupling. The ability of the convolution to reproduce EPSC waveforms supports the quantal hypothesis at the photoreceptor synapse. Results of convolution experiments also indicate that rod–cone differences in synaptic release kinetics are a primary factor in shaping rod–cone differences in EPSC waveforms and are thus also likely to be a major factor in producing the faster cone synaptic impulse response.
Methods
Retinal slice preparation
Aquatic tiger salamanders (Ambystoma tigrinum) 15–25 cm in length were handled humanely according to protocols approved by the Institutional Animal Care and Use Committee at the University of Nebraska Medical Center. The salamander was decapitated with heavy shears and the brain and spinal cord were rapidly pithed. After enucleation, the anterior segment of the eye was removed. The resulting eyecup was cut into thirds and a section was placed vitreal side down on a piece of filter paper (2 mm × 5 mm, Type AAWP, 0.8 μm pores, Millipore). After the retina adhered to the filter paper, the retina was isolated under chilled amphibian superfusate (for composition, see below). The retina and filter paper were cut into 125 μm slices using a razor blade (no. 121-6, Ted Pella Inc., Redding, CA, USA) tissue chopper (Stoelting, Wood Dale, IL, USA). Retinal slices were rotated 90 deg to permit viewing of the retinal layers when placed under a water immersion objective (40 ×, 0.7 NA) and viewed on an upright fixed stage microscope (Olympus BHWI). For experiments examining possible rod–cone differences in mEPSC characteristics, dissection and viewing of slices was performed under infrared illumination using infrared-sensitive cameras (Watec 502H, Rock House Products, New York, NY, USA) mounted on the dissecting and recording microscopes. To produce cone-dominated conditions, rods were desensitized by a steady 480 nm background light of ∼1.0 × 10³ photons s−1μm−2.
Solutions were applied by a single-pass, gravity-feed perfusion system, which delivered superfusate to the slice chamber at a rate of ∼1 ml min−1. The normal amphibian superfusate contained (mm): 111 NaCl, 2.5 KCl, 2 CaCl2, 0.5 MgCl2, 10 Hepes and 5 glucose (pH 7.8). Use of Hepes as a pH buffer limited effects of proton feedback (DeVries, 2001; Hosoi et al. 2005). The solution also contained 1 μm strychnine and 100 μm picrotoxin to block glycine and GABAA/C receptors, respectively. The osmolarity was measured with a vapour pressure osmometer (Wescor, Logan, UT, USA) and adjusted, if necessary, to 242 ± 5 mosmol l−1. Solutions were bubbled continuously with 100% O2.
Electrophysiology
Patch pipettes were pulled on a PP-830 vertical puller (Narishige USA, East Meadow, NY, USA) from borosilicate glass pipettes (1.2 mm O.D., 0.9 mm I.D., with internal filament, World Precision Instruments, Sarasota, FL, USA) and had tips of ∼1 μm O.D. with resistance values of 10–15 MΩ. Pipettes were filled with a solution containing (mm): 48 caesium gluconate, 42 CsCl, 9.4 TEACl, 1.9 MgCl2, 9.4 MgATP, 0.5 GTP, 5 EGTA and 32.9 Hepes (pH 7.2). The osmolarity was adjusted, if necessary, to 242 ± 5 mosmol l−1.
For paired recordings, rods or cones were voltage clamped simultaneously with adjacent postsynaptic neurones using a Multiclamp patch-clamp amplifier (Axon Instruments Inc.). Both recording pipettes were positioned with Huxley-Wall micromanipulators (Sutter Instruments, Novato, CA, USA) and visualized with a video camera (Watec 502H) mounted on the microscope (Olympus BHWI). Currents were acquired using a Digidata 1322 interface and pCLAMP 8.1 software (Axon Instruments). Acceptable access resistances for voltage clamp recordings were < 50 MΩ. Photoreceptors were voltage clamped at −70 mV, bipolar cells at −50 mV, and horizontal cells at −40 mV. In most cases, we stimulated the photoreceptor with a step from −70 to −10 mV to maximally stimulate calcium currents (ICa) and thereby evoke large and reproducible EPSCs. Stable recordings from synaptically coupled pairs of cells of > 15 min were needed for full washout and recovery from drug effects. Paired recordings were maintained for as long as 3 h.
Rods and cones were identified by their characteristic outer segments. Horizontal and OFF bipolar cells were identified by their response characteristics (Thoreson et al. 1997) and appearance after staining with Lucifer Yellow (2 mg ml−1) or AlexaFluor 568 (Molecular Probes; 0.2 mg ml−1). Rod input resistance averaged 320 ± 14 MΩ and charging curves were fitted by single exponentials averaging 1.1 ± 0.1 ms (n = 13). Cone input resistance averaged 208 ± 11 MΩ and charging curves were fitted by single exponentials averaging 2.6 ± 0.2 ms (n = 22). Input resistance of OFF bipolar cells averaged 1.5 ± 0.4 GΩ and the charging curves could typically be fitted by single exponentials averaging 0.9 ± 0.1 ms (n = 21). Input resistance of horizontal cells averaged 747 ± 364 MΩ and the charging curves could typically be fitted by single exponentials averaging 1.7 ± 0.4 ms (n = 13). The high input resistance and good fit by single exponential charging curves suggests that the horizontal cells were largely uncoupled from their neighbours in the retinal slice preparations used for these studies.
Chemicals were dissolved in amphibian superfusate except for GYKI 52466 and cyclothiazide, which were prepared in 10 000 × stock solutions of DMSO. Solvent control experiments with 1 : 1000 dilution of DMSO showed no effect on EPSCs. SYM 2081, NS 102, GYKI52466 and NBQX were obtained from Tocris Cookson (Ellisville, MO, USA). Unless otherwise stated, all other chemicals were obtained from Sigma-Aldrich.
Analysis
The mEPSC averaged from a series of individual mEPSCs was fitted by the best-fitting scale factor times the function: y=e(−t/τ1)+be(−t/τ2)− (1 +b)e(−t/τ3). For each set of time constants and coefficient b, the best-fitting scale factor is given by the dot product of the vector of experimental response values measured at discrete times and the function y evaluated at the same times and normalized to have unit length. The ‘best-fit’ values of the free parameters (b, τ1, τ2 and τ3) were determined by minimizing the sum of the square differences using Matlab (Mathworks) programs. The resulting fitted function for the mEPSC waveform was then convolved with empirically derived synaptic transmitter release rate functions. Release kinetics were obtained in a previous study by measuring exocytotic capacitance changes evoked by test pulses of varying duration (Rabl et al. 2005). For that study, capacitance (C)–duration plots were fitted with a dual exponential function: ΔC=A1(1 − exp(−t/τ1)) +A2(1 − exp(−t/τ2)). The parameters that provided the best fits to the capacitance–duration relations were: for cones, τ1= 2.7 ms, Amplitude1 (A1) = 306 fF, τ2= 1.4 s, Amplitude2 (A2) = 474 fF; and for isolated rods, τ1= 87 ms, A1= 132 fF, τ2= 14 s, A2= 1170 fF (Rabl et al. 2005). In our model, the rate of release was taken to be proportional to the derivative of the capacitance–duration function.
The criterion for statistical significance in Student's t tests (GraphPad Prism 4.0) was chosen to be P < 0.05. Variability is reported as ± s.e.m.
Results
Kinetic properties of EPSCs
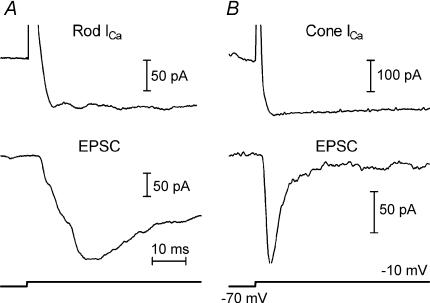
Application of depolarizing steps (−70 to −10 mV) to a presynaptic cone or rod evoked sustained inward ICa that activated with a similar time course in both cell types, consistent with results of Rabl et al. (2005). Despite the sustained nature of ICa in rods and cones, the EPSCs recorded simultaneously in postsynaptic OFF bipolar or horizontal cells were transient (Fig. 1). The ability of a sustained ICa to produce transient EPSCs is similar to results at the rod bipolar to AII amacrine cell synapse (Singer & Diamond, 2003).
Figure 1. Depolarizing steps evoked sustained ICa in rods and cones which in turn stimulated transient EPSCs in two horizontal cells.
A, top: ICa evoked by a depolarizing step from −70 to −10 mV applied to a rod. Bottom: EPSC recorded simultaneously in a horizontal cell (Vh=−40 mV). B, top: ICa evoked by a depolarizing step from −70 to −10 mV applied to a cone. Bottom: EPSC recorded simultaneously in a horizontal cell (Vh=−40 mV).
Consistent with faster synaptic transmission from cones than rods, EPSCs evoked by stimulation of cones showed a more rapid onset and decline than rod-driven EPSCs. The slower rise of the EPSC in the rod-driven neurone compared with the cone-driven neurone in Fig. 1 cannot be explained by differences in the activation of ICa which attains its peak well before the peak of the rod-driven EPSC. In both rod- and cone-driven neurones, the decline of the EPSC was more rapid and pronounced than the decline of the ICa in the simultaneously recorded photoreceptor (Fig. 1).
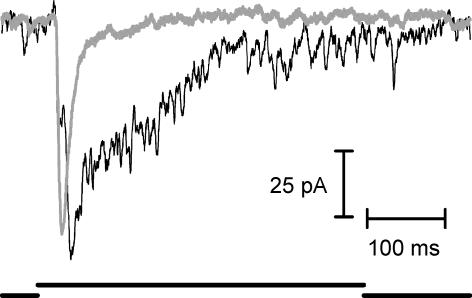
By evoking EPSCs in a single second-order neurone with presynaptic stimulation of first a cone and then a rod (or vice versa), we tested whether rod–cone differences in EPSC kinetics involved a general property of the postsynaptic neurone or a specific property of rod and cone synapses. In every case where we successfully recorded from both a rod and a cone while maintaining the postsynaptic recording from an OFF bipolar or horizontal cell (n = 11), the EPSC evoked by presynaptic stimulation (200 ms step, −70 to −10 mV) of the cone was much more transient than the EPSC evoked in the same postsynaptic neurone by stimulation of the rod (Fig. 2). Overlaying the EPSCs evoked by a rod (black trace) and cone (grey trace) in the same OFF bipolar cell also reveals that rod-evoked EPSCs attain their peak later than cone-evoked EPSCs (Fig. 2) although the latency to the beginning of the EPSC was the same for both rod- and cone-evoked EPSCs. The kinetic differences between the EPSCs evoked by depolarizing steps applied to rods versus cones are thus due to properties of the individual synapses made by rods and cones onto postsynaptic cells.
Figure 2. Cone inputs produce EPSCs that are faster and more transient than rod inputs into the same cell.
Traces illustrate EPSCs evoked by 200 ms steps from −70 to −10 mV during simultaneous paired recording from a cone and OFF bipolar cell (grey trace) as well as a rod and the same OFF bipolar cell (black trace). Unless otherwise stated, the same stimulation protocol was used for EPSCs shown in other figures.
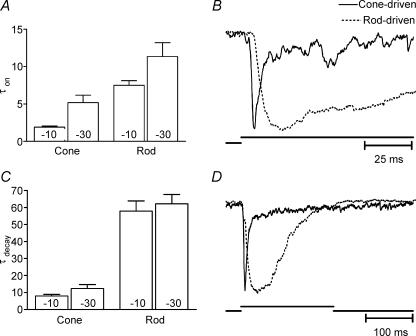
Rod and cone differences in EPSC kinetics were quantified by fitting the rising and falling phases of EPSCs evoked by 200 ms steps from −70 to −10 mV with single exponential functions. We had previously reported kinetic differences in EPSCs from rod- and cone-driven cells recorded in the presence of cyclothiazide (Rabl et al. 2005); the present analysis was conducted without cyclothiazide. Responses that could not be fitted adequately with a single exponential were excluded from this analysis. As depicted in the bar graph of Fig. 3A, cone-driven EPSCs in OFF bipolar and horizontal cells (τon= 1.91 ± 0.15 ms, n = 58) exhibited a significantly faster rise time than rod-driven EPSCs (τon= 7.51 ± 0.62 ms, n = 38). To illustrate this difference, rod- and cone-driven EPSCs with rise times near the average are overlaid in Fig. 3B. Time constants for the decay of the EPSC were also significantly faster in cone-driven cells (7.97 ± 0.97 ms, n = 52) than rod-driven cells (57.88 ± 5.94 ms, n = 32; Fig. 3C). Representative rod- and cone-driven EPSCs with decay times near the average are overlaid in Fig. 3D. Limiting analysis to the 52 cone-driven cells and 29 rod-driven cells in which onset and decay could both be fitted with single exponentials yielded time constants for onset (cones, 1.70 ± 0.13 ms, P = 0.29; rods, 6.84 ± 1.18 ms, P = 0.37) and decay (cones, 6.84 ± 1.05 ms, P = 0.73; rods, 46.4 ± 4.64 ms, P = 0.14) that were not significantly different from the larger sample shown in Fig. 3A.
Figure 3. Onset and decay kinetics of cone-driven EPSCs are faster than those of rod-driven EPSCs.
A, time constants for onset of EPSCs evoked by 200 ms steps to −10 or −30 mV in either rods or cones. B, overlay of cone-driven and rod-driven EPSCs from two different OFF bipolar cells illustrating typical rod–cone differences in rise time kinetics. C, time constants for decay of EPSCs evoked by 200 ms steps to −10 or −30 mV in either rods or cones. D, overlay of cone-driven and rod-driven EPSCs from two different horizontal cells illustrating typical rod–cone differences in decay kinetics. Cone-driven cells, steps to −10 mV, τon= 1.91 ± 0.15 ms, n = 58, τdecay= 7.97 ± 0.97 ms, n = 52. Rod-driven cells, steps to −10 mV, τon= 7.51 ± 0.62 ms, n = 38, τdecay= 57.88 ± 5.94 ms, n = 32. Cone-driven cells, steps to −30 mV, τon= 5.19 ± 1.00 ms, n = 19, τdecay= 12.28 ± 2.46 ms, n = 14. Rod-driven cells, steps to −30 mV, τon= 11.37 ± 1.85 ms, n = 15, τdecay= 62.15 ± 5.52 ms, n = 13. Rod–cone difference in τon and τdecay for steps to −10 mV: P < 0.0001. Rod–cone difference in τon for steps to −30 mV: P = 0.004. Rod–cone difference in τdecay for steps to −30 mV: P < 0.0001. Comparison of EPSC kinetics with steps to −10 and −30 mV: cones: difference in τon, P < 0.0001, difference in τdecay,P = 0.061; rods: difference in τon, P = 0.014, difference in τdecay,P = 0.67.
EPSCs in OFF bipolar cells and horizontal cells were generally similar. The onset and decay of rod-driven EPSCs exhibited similar time constants in both horizontal and OFF bipolar cells. The decay time constants for cone-driven OFF bipolar and horizontal cell EPSCs were also similar to one another but cone-driven OFF bipolar cells exhibited slightly faster onset kinetics than cone-driven horizontal cells (1.52 ± 0.15 ms, n = 20, versus 2.19 ± 0.20 ms, n = 16; P = 0.008).
In most experiments, large depolarizing test steps from −70 to −10 mV were used to evoke large, reproducible EPSCs. Weaker depolarizing steps to −30 mV, near the normal photoreceptor dark resting potential, evoked slower EPSCs than were evoked by steps to −10 mV (Fig. 3). Nevertheless, cone-driven EPSCs evoked by steps to −30 mV continued to show faster onset (5.19 ± 1.00 ms, n = 19) and decay (12.28 ± 2.46 ms, n = 14) kinetics than rod-driven EPSCs (τon= 11.37 ± 1.85 ms, n = 15, τdecay= 62.15 ± 5.52 ms, n = 13) evoked by the same step (Fig. 3).
Effects of cyclothiazide
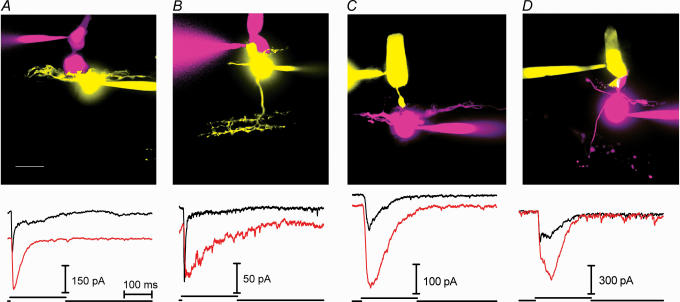
OFF bipolar and horizontal cells of amphibian retina possess non-NMDA ionotropic glutamate receptors (reviewed by Thoreson & Witkovsky, 1999). The major subtypes of non-NMDA receptors desensitize at very different rates with AMPA receptors desensitizing nearly 10 times faster than KA receptors (Dingledine et al. 1999). We therefore examined the effects of drugs that act selectively on KA or AMPA receptors. To test the pharmacology of rod and cone contacts, we obtained data from rods or cones synaptically connected to either horizontal cells or OFF bipolar cells. Cells were filled with a fluorescent dye to permit anatomical characterization at the end of the recording. Confocal stacks of fluorescently stained pairs of cells are shown in Fig. 4. We grouped the data into four sets for analysis: (1) cone-driven horizontal cells (e.g. Fig. 4A); (2) cone-driven OFF bipolar cells (e.g. Fig. 4B); (3) rod-driven horizontal cells (e.g. Fig. 4C); and (4) rod-driven OFF bipolar cells (e.g. Fig. 4D).
Figure 4. Cyclothiazide (100 μM) slowed the decay of EPSCs evoked in horizontal and OFF bipolar cells by stimulation of rods or cones.
A, cone–horizontal cell pairs. Top: merged confocal images of a cone stained with AlexaFluor 568 and horizontal cell stained with Lucifer Yellow. Bottom: overlay of EPSCs evoked in a horizontal cell by depolarizing pulses (−70 to −10 mV) applied to a cone before (black trace) and during application of cyclothiazide (red trace). The downward offset of the cyclothiazide-treated EPSC is due to an increase in inward holding current produced by cyclothiazide in this cell (as well as those in B and C). B, cone–OFF bipolar cell pairs. Top: cone stained with AlexaFluor 568 and OFF bipolar cell stained with Lucifer Yellow. Bottom: overlay of EPSCs evoked in control conditions (black trace) and in the presence of cyclothiazide (red trace). C, rod–horizontal cell pairs. Top: rod stained with Oregon Green 6F and horizontal cell stained with AlexaFluor 568. Bottom: overlay of EPSCs evoked in control conditions (black trace) and in the presence of cyclothiazide (red trace). D, rod–OFF bipolar cell pairs. Top: rod stained with Oregon Green 6F and OFF bipolar cell stained with AlexaFluor 568. Bottom: overlay of EPSCs evoked in control conditions (black trace) and in the presence of cyclothiazide (red trace). Scale bar, 10 μm.
Cyclothiazide (CTZ) is a benzothiadiazine that modulates AMPA receptors by reducing agonist-evoked desensitization and increasing AMPA receptor affinity (Yamada & Tang, 1993; Partin et al. 1993, 1994). The actions of CTZ are highly selective for AMPA receptors over KA receptors (Partin et al. 1993). As illustrated in Fig. 4, CTZ (100 μm) slowed decay of the EPSC in both rod- (n = 29) and cone-driven (n = 21) OFF bipolar and horizontal cells. In addition to slowing the decay of the EPSC, CTZ often increased the amplitude of the EPSC suggesting that desensitization is sufficiently rapid to reduce the peak of the EPSC. As illustrated by the baseline shifts in the lower panels of Fig. 4A–C, 77% of cells also showed an inward shift in the holding current consistent with the tonic presence of glutamate, probably due to release from neighbouring photoreceptors that are not voltage clamped. Concanavalin A (30 μm), a lectin that strongly attenuates desensitization of KA receptors (Partin et al. 1993), had no effect on the EPSC in two rod-driven OFF bipolar cells that were tested. The finding that CTZ slowed EPSC decay in rod- and cone-driven horizontal and OFF bipolar cells is consistent with the presence of AMPA receptors at both rod and cone synapses in these cells.
Agonist/antagonist pharmacology
The results with CTZ suggest a significant contribution from AMPA receptors in rod- and cone-driven horizontal and OFF bipolar cells but do not preclude the simultaneous presence of KA receptors. Furthermore, although we found that CTZ did not affect photoreceptor ICa (not shown), we could not exclude the possibility that CTZ may act presynaptically (Diamond & Jahr, 1995; Bellingham & Walmsley, 1999). We therefore used AMPA- and KA-selective agonists and antagonists to further test the possibility that AMPA receptors play a dominant role in both rod- and cone-driven EPSCs.
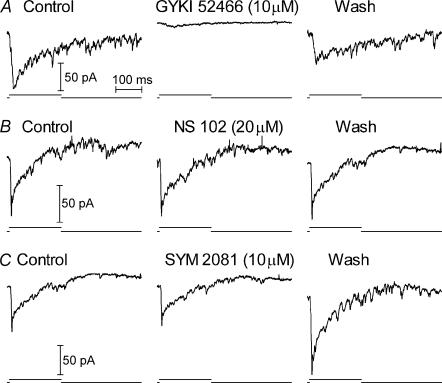
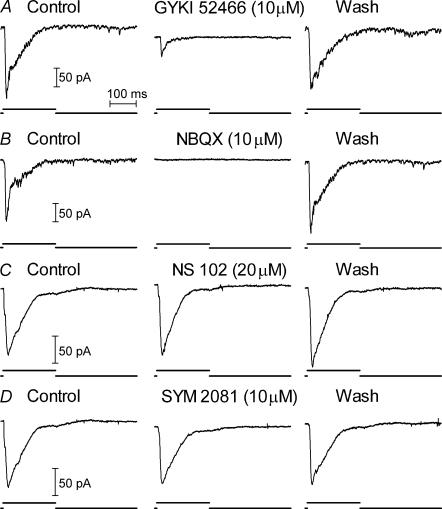
EPSCs in rod-driven OFF bipolar cells (n = 7, Fig. 5A) and rod-driven horizontal cells (n = 7, Fig. 6A) were strongly reduced or completely blocked by the selective AMPA antagonist GYKI 52466 (3–10 μm). In the examples shown in the figures, washout was begun before GYKI 52466 had exerted its full blocking effect. Full block was consistently obtained when GYKI 52466 application was maintained for a longer time but full recovery of the EPSC during the recording was not obtained in these cases. EPSCs in rod-driven horizontal cells were also inhibited by the competitive AMPA antagonist NBQX (3–10 μm, n = 9, Fig. 6B).
Figure 5. Rod-driven EPSCs in OFF bipolar cells were inhibited by the AMPA antagonist GYKI 52466 (10 μM) but not the KA antagonist, NS 102 (20 μM), or the KA agonist, SYM 2081 (10 μM).
Recordings in B and C are from the same cell.
Figure 6. Rod-driven EPSCs in horizontal cells were inhibited by the AMPA antagonists GYKI 52466 (10 μM) and NBQX (10 μM) but not the KA antagonist, NS 102 (20 μM), or the KA agonist, SYM 2081 (10 μM).
Recordings in A and B were from the same cell; recordings in C and D were from a different cell.
By contrast with the effects of AMPA receptor antagonists, the KA receptor antagonist NS 102 (20 μm) failed to inhibit EPSCs in rod-driven OFF bipolar cells (n = 7, Fig. 5B) and 5 of 6 rod-driven horizontal cells (Fig. 6C). NS 102 suppressed the EPSC in one rod-driven horizontal cell suggesting the presence of KA receptors in this cell (not shown). The highly selective KA agonist SYM 2081 (10–30 μm; Donevan et al. 1998) failed to inhibit EPSCs in all of the rod-driven OFF bipolar cells (n = 3, Fig. 5C) or horizontal cells (n = 5, Fig. 6D) that were tested.
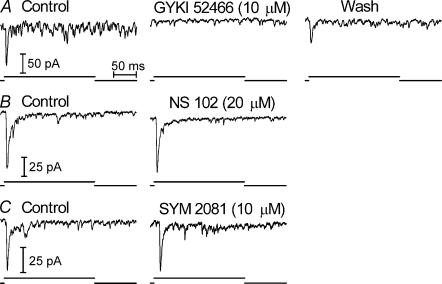
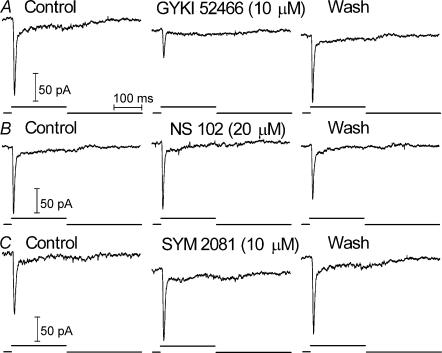
Consistent with results from rod-driven cells, the selective AMPA antagonist GYKI 52466 (3–10 μm) strongly inhibited EPSCs in 7 of 8 cone-driven OFF bipolar cells (Fig. 7A) and 4 of 4 cone-driven horizontal cells (Fig. 8A). The failure of GYKI 52466 to suppress EPSCs in one cone-driven OFF bipolar cell suggests the possible presence of KA receptors but the recording was lost before KA-selective drugs could be tested. SYM 2081 (10–30 μm) and NS 102 (20 μm) had no effect on EPSCs in cone-driven OFF bipolar cells (Fig. 7; SYM 2081, n = 3; NS 102, n = 4) or cone-driven horizontal cells (Fig. 8; SYM 2081, n = 4; NS 102, n = 7). Although it did not affect EPSC amplitude, SYM 2081 produced a small inward current in the horizontal cell shown in Fig. 8 suggesting the possibility of some KA receptors located elsewhere on the cell. Taken together, the experiments described above indicate that in most OFF bipolar and horizontal cells, rods and cones both contact pharmacologically similar AMPA-type glutamate receptors.
Figure 7. Cone-driven EPSCs in OFF bipolar cells were inhibited by the AMPA antagonist GYKI 52466 (10 μM) but not the KA antagonist, NS 102 (20 μM), or the KA agonist, SYM 2081 (10 μM).
Cells were lost before washout was achieved after application of NS 102 or SYM 2081. Recordings illustrated in the figure were from three different cells.
Figure 8. Cone-driven EPSCs in a horizontal cell were inhibited by the AMPA antagonist GYKI 52466 (10 μM) but not the KA antagonist, NS 102 (20 μM), or the KA agonist, SYM 2081 (10 μM).
All recordings were from the same cell.
Spontaneously occurring mEPSCs
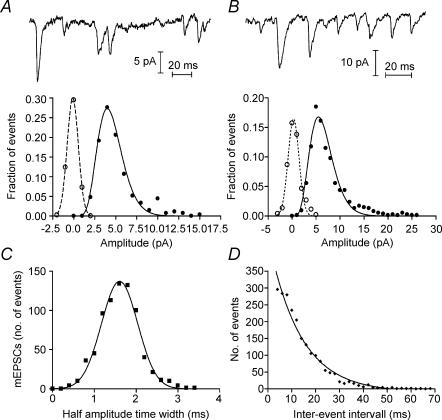
We examined the properties of spontaneously occurring mEPSCs in OFF bipolar and horizontal cells in order to determine whether they represent independent, unitary events appropriate for convolution with the release function. Spontaneous mEPSCs were consistently observed while recording from OFF bipolar cells; these results are in agreement with earlier studies (Maple et al. 1994; Kawai, 1999; Wu et al. 2000). Horizontal cells were often uncoupled in the slice as evidenced by their high input resistance and, consistent with other studies (Hirasawa et al. 2001), uncoupled horizontal cells also exhibited mEPSCs. Examples of mEPSCs recorded from OFF bipolar cells at holding potentials of −50 and −90 mV are shown in Fig. 9A and B, respectively. These spontaneous synaptic currents were considered to be mEPSCs since they were recorded in the presence of picrotoxin (100 μm) and strychnine (1 μm) used to block GABAA/C receptors and glycine receptors, respectively. Furthermore, spontaneous synaptic currents recorded under these conditions were blocked by NBQX and GYKI 52466 (e.g. Figs 5, 6, 7) and reversed near 0 mV (not shown) indicating that they were glutamatergic.
Figure 9. Properties of spontaneous mEPSCs are consistent with quantal release.
A, spontaneous mEPSCs from an OFF bipolar cell (Vh=−50 mV) and amplitude histogram of mEPSC amplitudes from the same cell (•, 272 events). The normalized mEPSC amplitude histogram was fitted with a gamma distribution (f(x) =x(α−1)e(−x/β)/βαΓ(α) where α= 8.61 and β= 0.52). A gamma distribution matches the skewed amplitude distribution better than a Gaussian function. The baseline noise histogram (○) was normalized to the amplitude of the event histogram and fitted with a single Gaussian curve (s.d.= 0.66 pA). B, spontaneous mEPSCs and amplitude histogram (•, 757 events) from a different OFF bipolar cell when Vh=−90 mV. The normalized mEPSC amplitude histogram was fitted with a gamma distribution (α= 6.51, β= 1.00) and baseline noise histogram (○) was fitted with a single Gaussian curve (s.d.= 1.13 pA). C, half-amplitude time width histogram of mEPSCs from the cell in B fitted with a single Gaussian curve. Mean ±s.d. = 1.61 ± 0.43 ms. D, inter-event interval histogram was fitted with a single exponential (τ= 13.5 ms), consistent with a Poisson release process.
Amplitude distributions of mEPSCs were broad, with a coefficient of variation of 0.65, and skewed, with individual mEPSCs as much as fivefold larger than the mean (Fig. 9A and B). The amplitude distributions of mEPSCs in other CNS and retinal neurones are similarly broad and skewed (Taylor et al. 1995; Matsui et al. 1998; Gao & Wu, 1999; Auger & Marty, 2000; Miller et al. 2001). One possible explanation for a large coefficient of variation can be electrotonic attenuation of events arising from distant synaptic inputs (Rall, 1969). However, if smaller mEPSCs reflect input from electrotonically distant synaptic inputs, then they should be slower and broader, but we found no correlation between amplitudes and half-amplitude time widths of the mEPSC (not shown). The skewed distribution does not appear to be due to an under-sampling of small events since amplitude distributions remained similarly skewed whether the postsynaptic neurone was clamped at −50 mV (Fig. 9A) or −90 mV (Fig. 9B). We focused our analysis on records with a holding potential of −90 mV because the increased driving force improved resolution of individual events.
Most OFF bipolar and horizontal cells in the salamander retina receive inputs from both rods and cones (Hensley et al. 1993; Thoreson et al. 2003). Thus, spontaneous mEPSCs in these cells can arise from vesicles released by both types of photoreceptor cells. Maple et al. (1999) reported that the single channel conductance of AMPA receptors in cone-driven OFF bipolar cells was less than half that of AMPA receptors in rod-driven OFF bipolar cells. Assuming that vesicles in rod and cone terminals activate the same number of glutamate receptors, then similar differences between glutamate receptors at rod and cone synapses in individual neurones should result in a bimodal distribution in the amplitude of mEPSCs. However, although slightly skewed as described above, amplitude distributions of mEPSCs were largely unimodal (Fig. 9A and B). The mean amplitude of mEPSCs recorded at a holding potential of −90 mV averaged 6.5 ± 1.6 pA (n = 10), ranging from 3.7 to 8.8 pA. The wide range of mEPSC amplitudes between cells suggests that although amplitude distributions within individual cells were unimodal, different cells (e.g. rod- versus cone-driven OFF bipolar cells) may possess AMPA receptors with differing properties.
Like amplitude histograms, half-amplitude time width distributions were consistently unimodal. They were well fitted by a single Gaussian function (Fig. 9C) suggesting little kinetic difference between mEPSCs arising from rod and cone inputs. Inter-event interval histograms were fitted by single exponential functions consistent with a Poisson release process involving the random release of vesicles from a large releasable pool (Fig. 9D; n = 5).
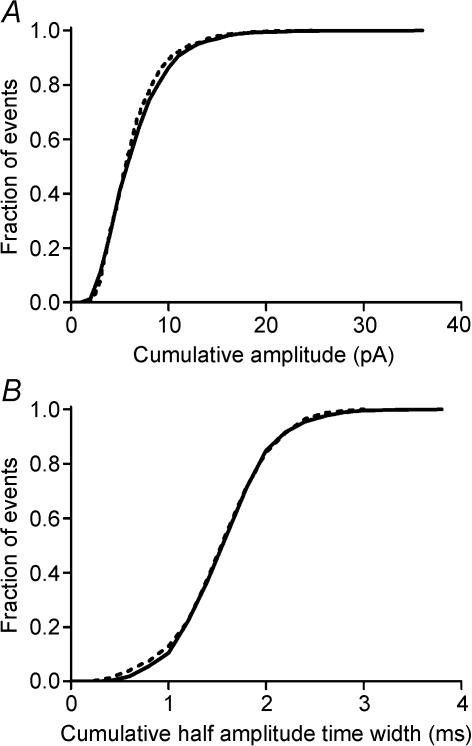
As a more direct test for possible differences between mEPSCs arising from rods and cones, we recorded spontaneous mEPSCs from dark-adapted OFF bipolar and horizontal cells and then reduced rod output by applying a 480 nm adapting light. Dark-adapted responses of second-order neurones from slices prepared under infrared light are rod dominated (Thoreson et al. 2003). Application of a 480 nm background light (1 × 10⁶ photons s−1μm−2) strongly hyperpolarizes rods and blocks their light responses but only slightly diminishes cone responses (Thoreson et al. 2003). Thus, use of a 480 nm background light should preferentially reduce the spontaneous release of vesicles from rods. Consistent with reduced synaptic output, the frequency of spontaneous mEPSCs was reduced from 83.9 ± 11.1 to 60.6 ± 10.6 mEPSC s−1 by the adapting light (P < 0.0001, paired t test, n = 6). As illustrated by the cumulative histograms in Fig. 10, reducing rod output with the adapting light altered neither the amplitude nor half-amplitude time width of mEPSCs. Similar results were observed in all nine cells that were tested. The amplitude and half-amplitude time width of mEPSCs were also unaltered by using a background light that was 2.8 log units more intense. These results indicate that mEPSCs arising from rods and cones are similar suggesting that vesicles derived from both cell types release similar quantities of glutamate and act on postsynaptic glutamate receptors with similar properties.
Figure 10. Amplitude and kinetic properties of mEPSCs are not altered by shifting from rod-dominated (scotopic) to cone-dominated (photopic) conditions.
A, normalized cumulative amplitude histograms of mEPSCs obtained from a horizontal cell in scotopic conditions (continuous line, 1983 events) and in the presence of an adapting background light (dashed line, 824 events) that suppresses output from rods (480 nm, 1.0 × 10³ photons s−1μm−2; Thoreson et al. 2003). B, normalized cumulative histograms of mEPSC half-amplitude time widths in dark-adapted conditions (continuous line) and in the presence of the background light (dashed line).
Convolution of mEPSCs with release function
Cones exhibit an initial component of exocytosis that is more than tenfold faster than the initial component of exocytosis from rods (Rabl et al. 2005). The quantal hypothesis predicts that the EPSC can be constructed from a linear superposition of unitary postsynaptic current events (mEPSCs) in a single-compartment (isopotential), voltage-clamped postsynaptic neurone, as long as the glutamate receptors are not saturated. To test the quantal hypothesis and assess the impact of rod–cone differences in release, we computed theoretical EPSCs by convolving the mEPSC waveform with the synaptic transmitter release rate functions for rods and cones.
Experiments described above indicated that mEPSCs in OFF bipolar and horizontal cells are unitary quantal events released in a statistically independent manner. Furthermore, the properties of mEPSCs in a given cell exhibited a single unimodal distribution and there was no evidence for differences in mEPSCs derived from rods and cones. For these reasons, we concluded that mEPSCs derived from any individual synaptic input are similar to the overall population of spontaneously occurring mEPSCs in a given cell. We therefore created an mEPSC waveform for each cell by averaging together a number of individual mEPSCs (insets in Fig. 11). To produce a smooth function describing the mEPSC waveform, the average mEPSC was fitted with a three-exponential function as described in Methods.
Figure 11. Convolutions of mEPSCs with photoreceptor release functions.
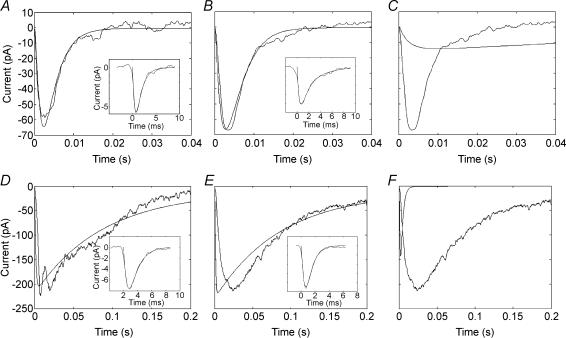
A, EPSC in an OFF bipolar cell evoked by stimulation of a cone (noisy trace) is overlaid on the waveform predicted by convolution of the mEPSC with the cone release function (smooth trace). The mEPSC (inset) was averaged from 40 individual mEPSCs aligned at the half-maximal points of their rising phases and fitted with a three exponential function as described in Methods. B, average cone-driven EPSC (noisy trace) is overlaid on the waveform predicted by convolutiof the average mEPSC with the cone release function (smooth trace). The EPSC and mEPSC were both averaged from 7 cell pairs (4 cone–OFF bipolar cell pairs, 3 cone–horizontal cell pairs). To average EPSCs and mEPSCs from multiple cells, the EPSCs and average mEPSCs from each cell were normalized to 100% before the final averaging. C, for comparison purposes, the average cone-driven EPSC is overlaid on the waveform predicted by convolution of the average mEPSC with the rod release function (smooth trace). D, EPSC in a horizontal cell evoked by stimulation of a rod (noisy trace) is overlaid on the waveform predicted by convolution of the mEPSC with the rod release function (smooth trace). The mEPSC (inset) was averaged from 15 individual mEPSCs aligned at the half-maximal points of their rising phases and fitted with a three exponential function. Note the fivefold slower time base in panels D–F compared with panels A–C. E, average rod-driven EPSC (noisy trace) is overlaid on the waveform predicted by convolution of the average mEPSC with the rod release function (smooth trace). The EPSC and mEPSC were averaged from 9 cell pairs (4 rod–OFF bipolar cell pairs, 5 rod–horizontal cell pairs). F, for comparison purposes, the average rod-driven EPSC is overlaid on the waveform predicted by convolution of the average mEPSC with the cone release function (smooth trace).
Figure 11A shows the EPSC evoked in an OFF bipolar cell by a depolarizing step (−70 to −10 mV, 50 ms) applied to a presynaptic cone. To test the influence of the release function on the shape of the EPSC, the best fit curve to the average mEPSC from that cell was convolved with a dual exponential function describing the rate of exocyotosis from cones as a function of time (τ1= 3 ms, τ2= 1.4 s; Rabl et al. 2005). The cumulative release function, from which the release rate function was derived, was measured previously using capacitance measurement techniques (Rabl et al. 2005). Despite the fact that the release function was measured in a different sample of cells using different techniques, the EPSC waveform predicted by the convolution provided a remarkably good match to the observed EPSC (Fig. 11A). Good matches were obtained for all seven cone-driven pairs of cells that were analysed (4 cone–OFF bipolar cell pair, 3 cone–horizontal cell pairs). To illustrate the overall fit to this sample of cells, we convolved the mEPSC averaged among these seven postsynaptic neurones (after normalizing mEPSC amplitude between cells). As shown in Fig. 11B, convolution of the average mEPSC produced a waveform that closely predicted the actual EPSC waveform averaged from this same sample of cone-driven neurones. The average EPSC waveform exhibited onset and decay time constants (τon= 1.55 ms, τdecay= 6.11 ms) similar to the much larger group of cells analysed for Fig. 3 suggesting that this sample was representative of the overall population. By contrast with convolution using the cone release function, convolving the average mEPSC from these cone-driven cells with the rod release function produced a substantially slower waveform (Fig. 11C). The ability of linear convolution to predict the EPSC waveform in this sample of cells provides support for the quantal hypothesis.
We used the same approach to analyse rod-driven EPSCs. Figure 11D shows the EPSC and average mEPSC (inset) obtained from a horizontal cell while simultaneously recording from a presynaptic rod. For the rod-driven cells, we used an exponential release function with time constants of 87 ms and 14 s to convolve the mEPSC waveform (Rabl et al. 2005). Note the fivefold slower timescale of the rod-driven responses in Fig. 11D–F compared with the cone-driven responses in Fig. 11A–C. In the example shown in Fig. 11D, the convolution produced a good match to the overall envelope of the EPSC waveform although it did not reproduce the small reduction in current that immediately followed the initial peak. Prominent secondary peaks similar to Fig. 11D were observed in other rod-driven EPSCs (e.g. Figures 4D and 12B); experiments described in the following section (Fig. 12) suggest that this delayed secondary component to the EPSC involves synaptic output from coupled rods. The failure of the convolution to capture the detailed structure of the EPSC was not unexpected, since the release function was obtained from capacitance measurements made at a handful of discrete time points using a large sample of cells which would obscure detailed differences in release kinetics among individual cells.
Figure 12. Rod–rod coupling contributes preferentially to later components of the EPSC.
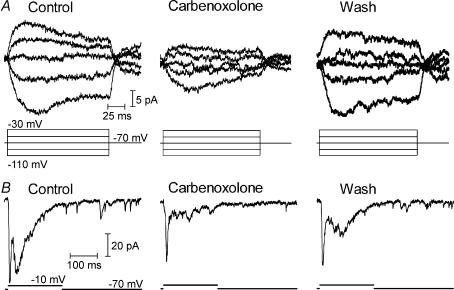
A, carbenoxolone (0.2 mm) reversibly reduced the junctional conductance between neighbouring rods. Traces at the top show currents produced in one rod by a series of voltage steps (−110 to −30 mV) applied to the other rod. B, carbenoxolone (0.2 mm) inhibited the EPSC evoked in an OFF bipolar cell by a depolarizing step from −70 to −10 mV applied to a presynaptic rod. Note the particular reduction in the delayed component of the EPSC and partial recovery of this component after 30 min washout.
Not all rod-driven EPSCs were matched as closely by convolution of mEPSC waveforms as the example in Fig. 11D. To illustrate the overall match to rod-driven cells, Fig. 11E shows the convolution obtained using the average mEPSC from nine rod-driven cell pairs (4 rod—OFF bipolar, 5 rod–horizontal cells) overlaid on the actual EPSC averaged from the same nine pairs. The average EPSC waveform from these nine cells exhibited onset and decay time constants (τon= 5.8 ms, τdecay= 66.7 ms) similar to the much larger group of cells analysed for Fig. 3 suggesting that this sample is representative of the larger population. The peak and the rise time of the average EPSC were somewhat slower than the waveform predicted by the convolution. Nonetheless, convolution of the mEPSC with the rod release function produced a far better match to the rod-driven EPSC (Fig. 11E) than to the cone-driven EPSC (Fig. 11C). Conversely, convolution with the cone release function produced a much better match to the cone-driven EPSC (Fig. 11B) than to the rod-driven EPSC (Fig. 11F). These results suggest that the slower kinetics of release from rod terminals contribute significantly to producing the slower rod-driven EPSCs.
Impact of rod–rod coupling
The presence of strong rod–rod coupling in the amphibian retina (Attwell et al. 1984; Zhang & Wu, 2005) raises the possibility that rod-driven EPSCs may include a component of exocytosis arising from the stimulation of adjacent rods by current spread through gap junctions. We therefore tested effects of gap junction blockers (Rozental et al. 2001) on the EPSC. Using paired rod–rod recordings, we established that carbenoxolone (0.2 mm) reversibly inhibited the gap junctional conductance between rods (Fig. 12A, n = 7). Using paired pre- and postsynaptic recordings, we then found that carbenoxolone reversibly inhibited later portions of the rod-driven EPSC in horizontal and OFF bipolar cells (Fig. 12B, n = 5). Photoreceptor Ca2+ channels can be inhibited by carbenoxolone (Vessey et al. 2004) and this would contribute to a reduction in the EPSC. However, in an experiment in which we interleaved measurements of ICa with ramp voltage protocols between tests of the EPSC with depolarizing steps, we found that the reduction in the late component of the EPSC preceded any significant change in ICa. As a control for non-specific effects on synaptic transmission, we tested the effects of carbenoxolone on synaptic transmission from cones to horizontal cells. The onset and decay kinetics of cone-driven EPSCs in horizontal cells were not significantly altered by application of carbenoxolone (0.2 mm; n = 4 pairs; τon, P = 0.57; τdecay, P = 0.24). We also tested a second, structurally dissimilar gap junction blocker, heptanol (2 mm; Rozental et al. 2001), and found that it inhibited the gap junctional conductance between rods and produced a similar preferential reduction in the late component of the EPSC (n = 2, not shown). These experiments suggest that gap junctional coupling between rods leads to a delayed component in the EPSC, consistent with the low-pass filtering expected from rod–rod coupling (Zhang & Wu, 2005).
Discussion
One goal of the present study was to determine whether there were differences in the glutamate receptors at rod and cone synapses that might contribute to faster synaptic transmission in the cone pathway. However, pharmacological studies (Figs 4, 5, 6, 7, 8) and the absence of detectable differences in the properties of mEPSCs derived from rods and cones (Figs 9 and 10) indicate that rods and cones contact similar AMPA-type receptors in almost all horizontal and OFF bipolar cells. Evidence for KA receptors was found in one cone-driven horizontal cell and one rod-driven OFF bipolar cell (out of a total of more than 50 cells tested) suggesting a small number of cells possess significant numbers of KA receptors. The predominance of AMPA receptors in mediating synaptic responses of horizontal and OFF bipolar cells of the salamander retina is consistent with previous studies (Yang et al. 1998; Maple et al. 1999) but Maple et al. (1999) also found that AMPA receptors in cone-dominated OFF bipolar cells desensitized more rapidly than AMPA receptors in rod-dominated OFF bipolar cells. However, even the most rapid desensitization of glutamate-gated currents that they found in cone-dominated cells required ∼100 ms to achieve half-maximal desensitization suggesting that desensitization has little impact on the decay of depolarization-evoked EPSCs at cone- or rod-driven synapses, which exhibited decay time constants of ∼8 ms and ∼60 ms, respectively. Maple et al. (1999) also reported that the single channel conductance of AMPA receptors in cone-dominated cells was 43% of that in rod-dominated cells. Assuming that vesicles released by rods and cones activate the same number of glutamate receptors, the presence of a similar difference in conductance at the synapses made by rods and cones on individual cells should produce a bimodal mEPSC amplitude histogram. However, we found that amplitude distributions were unimodal within any individual cell and there was no evidence for rod–cone differences in the amplitude of mEPSCs. Although we found a large variation in the mean amplitude of mEPSCs from cell to cell (with the smallest amplitude mEPSC being 42% of the largest) that is consistent with the possibility of differences in glutamate receptors between different cells (e.g. between rod- and cone-dominated cells), our results suggest there are no significant differences in the properties of glutamate receptors clustered at rod and cone synapses within any individual cell.
Kim & Miller (1991, 1993) found that concentrations of 0.5–1 mm kynurenic acid were required to block EPSCs in horizontal and OFF bipolar cells evoked by depolarizing steps applied to presynaptic cones whereas ≥ 5 mm kynurenic acid was needed to block EPSCs in rod-driven horizontal and OFF bipolar cells. They proposed that these differences may reflect differences in glutamate receptors at rod and cone synapses, but subsequent studies showed that the effective concentration of the low affinity glutamate receptor antagonist, kynurenic acid, can be interpreted as reflecting the peak concentration of glutamate attained at the synapse (Clements, 1996). This interpretation takes advantage of the fact that the ratio between the binding rates of glutamate and the more rapidly dissociating antagonist is similar to the ratio between their concentrations (Clements, 1996). Thus, rather than implying pharmacologically distinct receptors, differences in the concentrations of kynurenic acid needed to block EPSCs evoked by strong depolarization of rods versus cones may instead suggest that postsynaptic glutamate receptors adjacent to cones are exposed to glutamate concentrations in excess of 0.5 mm and those adjacent to rods are exposed to concentrations exceeding 5 mm. Synaptic vesicles in rods and cones contain similar amounts of glutamate (Fig. 10), synaptic ribbons appear to tether the releasable pool of vesicles (von Gersdorff et al. 1996; Thoreson et al. 2004), and rods and cones have similar size ribbons (Pierantoni & McCann, 1981; Thoreson et al. 2004). Although cones exhibit a larger exocytotic capacitance response than rods (Rabl et al. 2005), it thus appears likely that rods and cones release a similar amount of glutamate at each ribbon; the larger total release from cones is probably due to a greater number of ribbons. Cones can also release glutamate more rapidly than rods (Rabl et al. 2005) but the amount reaching postsynaptic receptors depends on diffusional distance from the release site and efficiency of glutamate uptake, which may differ at rod and cone synapses. One cannot therefore readily predict the concentration of glutamate in the synaptic cleft of rod and cone photoreceptors in the amphibian retina. However, it is worth noting that these concentration values are consistent with results at other CNS synapses where the release of a vesicle causes a spatially restricted elevation of glutamate levels to concentrations of 1–5 mm (Clements, 1996).
Depolarization evokes a tenfold faster initial burst of exocytosis from cones than rods (Rabl et al. 2005). A major goal of the present study was to determine how these differences in release rate shape the postsynaptic responses of OFF bipolar and horizontal cells. To model the impact of release rates on the postsynaptic response, we assumed that the photoreceptor synapse adheres to the quantal hypothesis of exocytosis (del Castillo & Katz, 1954) and that the EPSC derives from a linear superposition of unitary postsynaptic current events (mEPSCs) in a single compartment (isopotential) postsynaptic neurone. The assumption of isopotentiality is supported by the finding that OFF bipolar cells exhibited single exponential charging curves consistent with single compartment structures. Horizontal cells in which mEPSCs were detected – and were thus presumably uncoupled from their neighbours – also exhibited single exponential charging curves. The assumption that mEPSCs represent unitary quantal events is supported by the unimodal distributions of amplitudes and half-amplitude time widths. Spontaneous mEPSCs detected in a postsynaptic neurone can derive from any one of a number of presynaptic photoreceptors. However, the unimodal nature of mEPSC distributions and the absence of any rod–cone differences in the properties of mEPSCs or glutamate receptor pharmacology suggests that in any given second-order neurone, the properties of the overall population of spontaneously occurring mEPSCs are representative of mEPSCs derived from any individual photoreceptor. To obtain the mEPSC waveform we therefore averaged a number of spontaneously occurring mEPSCs. The average mEPSC was fitted with a three exponential function to produce a smooth waveform. There was a slight deviation between the fitted waveform and the actual mEPSC during the initial rising phase. This deviation may contribute to deviation between the rising phase of the EPSC predicted from convolution and the actual EPSC. Nevertheless, convolution of the mEPSC waveform fit with the cone release function produced a remarkably good match to the actual cone-driven EPSCs. The ability to reconstruct the EPSC by linear convolution of individual mEPSCs supports the hypothesis that postsynaptic responses of OFF bipolar and horizontal cells arise from a linear summation of individual quantal release events. The success of the convolution implies that even at the highest release rates achieved at the peak of the EPSC there is little spatial or temporal overlap in the effects of individual quanta. These data argue against the alternative hypothesis that postsynaptic responses of second-order retinal neurones are not quantal in nature but instead reflect changes in the spatially integrated level of glutamate in the cleft (Gaal et al. 1998; Roska et al. 1998).
Convolution of mEPSCs with the rod release function also produced a good match in some rod-driven neurones, but the actual EPSC was slightly slower than the predicted EPSC in many cells. As described above for cone-driven EPSCs, deviations between the actual mEPSC and the fitted waveform may have contributed to the faster rise time of the predicted EPSC compared with the actual EPSC. Nevertheless, convolution with the rod release function produced a far better match to rod-driven EPSCs than convolution of the same mEPSC waveform with the cone release function, consistent with the hypothesis that presynaptic differences in the rates of release are a major factor in producing the dramatic kinetic differences between rod- and cone-driven EPSCs.
The presence of strong rod–rod coupling in the amphibian retina (Attwell et al. 1984; Zhang & Wu, 2005) also contributes to the slower decay of rod- versus cone-driven EPSCs. Inhibition of rod–rod coupling with carbenoxolone or heptanol preferentially reduced a delayed component to the EPSC in rod-driven cells consistent with the suggestion that the spread of depolarizing current through gap junctions stimulates glutamate release from neighbouring rods. It should be noted that the release function was measured in uncoupled cells (Rabl et al. 2005) and thus any contribution from coupling to the rod-driven EPSC would not be predicted by convolution with the release function.
In summary, the present results indicate that rod–cone differences in release kinetics play a major role in shaping the postsynaptic currents evoked by depolarizing steps applied to presynaptic photoreceptors. Faster cone-driven EPSCs (Fig. 3) and faster release kinetics (Rabl et al. 2005) are observed at membrane potentials near the dark resting potential suggesting that rod–cone differences in release kinetics are present under physiological conditions and thus may play a role in shaping postsynaptic responses to light. Schnapf & Copenhagen (1982) computed the synaptic impulse responses of rods and cones by measuring photoreceptor and horizontal cell responses to brief light flashes and found the cone synaptic impulse response to be 8–10 times faster than the synaptic impulse response of rods. These differences in synaptic kinetics roughly match differences in the kinetics of the light response of rods and cones (Baylor & Hodgkin, 1973; Pasino & Marchiafava, 1976; Schnapf & Copenhagen, 1982; Copenhagen et al. 1983). Horizontal and bipolar cells respond linearly to modulations of light intensity of low to intermediate contrast around a background light level (Tranchina et al. 1981; Burkhardt et al. 2004). In the linear regime of stimulus contrast, responses to incremental and decremental steps of light are mirror images of one another. This suggests that in the presence of a background light level, the processes responsible for a rapid increase in exocytosis from cones at light offset may also support rapid changes in synaptic output at light onset. Thus, in addition to promoting differences in the kinetics of depolarization-evoked EPSCs, rod–cone differences in release kinetics are also likely to be an important factor in producing the faster synaptic impulse response of cones.
Acknowledgments
This study was supported by NEI (EY-10542), Gifford Foundation, Lion's Clubs, and Research to Prevent Blindness. The authors thank Eric Bryson and Katalin Rabl for their insights and technical assistance and Dr Jeffrey Diamond for helpful comments on the manuscript.
References
- Attwell D, Wilson M, Wu SM. A quantitative analysis of interactions between photoreceptors in the salamander (Ambystoma) retina. J Physiol. 1984;352:703–737. doi: 10.1113/jphysiol.1984.sp015318. [DOI] [PMC free article] [PubMed] [Google Scholar]
- Auger C, Marty A. Quantal currents at single-site central synapses. J Physiol. 2000;526:3–11. doi: 10.1111/j.1469-7793.2000.t01-3-00003.x. [DOI] [PMC free article] [PubMed] [Google Scholar]
- Baylor DA, Fettiplace R. Transmission from photoreceptors to ganglion cells in turtle retina. J Physiol. 1977;271:391–448. doi: 10.1113/jphysiol.1977.sp012006. [DOI] [PMC free article] [PubMed] [Google Scholar]
- Baylor DA, Hodgkin AL. Detection and resolution of visual stimuli by turtle photoreceptors. J Physiol. 1973;234:163–198. doi: 10.1113/jphysiol.1973.sp010340. [DOI] [PMC free article] [PubMed] [Google Scholar]
- Bellingham MC, Walmsley B. A novel presynaptic inhibitory mechanism underlies paired pulse depression at a fast central synapse. Neuron. 1999;23:159–170. doi: 10.1016/s0896-6273(00)80762-x. [DOI] [PubMed] [Google Scholar]
- Burkhardt DA, Fahey PK, Sikora MA. Retinal bipolar cells: contrast encoding for sinusoidal modulation and steps of luminance contrast. Vis Neurosci. 2004;21:883–893. doi: 10.1017/S095252380421608X. [DOI] [PubMed] [Google Scholar]
- Clements JD. Transmitter timecourse in the synaptic cleft: its role in central synaptic function. Trends Neurosci. 1996;19:163–171. doi: 10.1016/s0166-2236(96)10024-2. [DOI] [PubMed] [Google Scholar]
- Copenhagen DR, Ashmore JF, Schnapf JK. Kinetics of synaptic transmission from photoreceptors to horizontal and bipolar cells in turtle retina. Vision Res. 1983;23:363–369. doi: 10.1016/0042-6989(83)90083-4. [DOI] [PubMed] [Google Scholar]
- del Castillo J, Katz B. Statistical factors involved in neuromuscular facilitation and depression. J Physiol. 1954;124:574–585. doi: 10.1113/jphysiol.1954.sp005130. [DOI] [PMC free article] [PubMed] [Google Scholar]
- DeVries SH. Bipolar cells use kainate and AMPA receptors to filter visual information into separate channels. Neuron. 2000;28:847–856. doi: 10.1016/s0896-6273(00)00158-6. [DOI] [PubMed] [Google Scholar]
- DeVries SH. Exocytosed protons feedback to suppress the Ca2+ current in mammalian cone photoreceptors. Neuron. 2001;32:1107–1117. doi: 10.1016/s0896-6273(01)00535-9. [DOI] [PubMed] [Google Scholar]
- Diamond JS, Jahr CE. Asynchronous release of synaptic vesicles determines the time course of the AMPA receptor-mediated EPSC. Neuron. 1995;15:1097–1107. doi: 10.1016/0896-6273(95)90098-5. [DOI] [PubMed] [Google Scholar]
- Dingledine R, Borges K, Bowie D, Traynelis SF. The glutamate receptor ion channels. Pharmacol Rev. 1999;51:7–61. [PubMed] [Google Scholar]
- Donevan SD, Beg A, Gunther JM, Twyman RE. The methylglutamate, SYM 2081, is a potent and highly selective agonist at kainate receptors. J Pharmacol Exp Ther. 1998;285:539–545. [PubMed] [Google Scholar]
- Gaal L, Roska B, Picaud SA, Wu SM, Marc R, Werblin F. Postsynaptic response kinetics are controlled by a glutamate transporter at cone photoreceptors. J Neurophysiol. 1998;79:190–196. doi: 10.1152/jn.1998.79.1.190. [DOI] [PubMed] [Google Scholar]
- Gao F, Wu SM. Multiple types of spontaneous excitatory synaptic currents in salamander retinal ganglion cells. Brain Res. 1999;821:487–502. doi: 10.1016/s0006-8993(99)01067-7. [DOI] [PubMed] [Google Scholar]
- Hensley SH, Yang XL, Wu SM. Relative contribution of rod and cone inputs to bipolar cells and ganglion cells in the tiger salamander retina. J Neurophysiol. 1993;69:2086–2098. doi: 10.1152/jn.1993.69.6.2086. [DOI] [PubMed] [Google Scholar]
- Hirasawa H, Shiells R, Yamada M. Analysis of spontaneous EPSCs in retinal horizontal cells of the carp. Neurosci Res. 2001;40:75–86. doi: 10.1016/s0168-0102(01)00212-7. [DOI] [PubMed] [Google Scholar]
- Hosoi N, Arai I, Tachibana M. Group III metabotropic glutamate receptors and exocytosed protons inhibit L-type calcium currents in cones but not in rods. J Neurosci. 2005;25:4062–4072. doi: 10.1523/JNEUROSCI.2735-04.2005. [DOI] [PMC free article] [PubMed] [Google Scholar]
- Kawai F. Characterization of spontaneous excitatory synaptic currents in newt retinal bipolar cells. Neurosci Lett. 1999;271:49–52. doi: 10.1016/s0304-3940(99)00511-x. [DOI] [PubMed] [Google Scholar]
- Kidd FL, Isaac JT. Kinetics and activation of postsynaptic kainate receptors at thalamocortical synapses: role of glutamate clearance. J Neurophysiol. 2001;86:1139–1148. doi: 10.1152/jn.2001.86.3.1139. [DOI] [PubMed] [Google Scholar]
- Kim HG, Miller RF. Rods and cones activate different excitatory amino acid receptors on the mudpuppy retinal horizontal cell. Brain Res. 1991;538:141–146. doi: 10.1016/0006-8993(91)90388-c. [DOI] [PubMed] [Google Scholar]
- Kim HG, Miller RF. Properties of synaptic transmission from photoreceptors to bipolar cells in the mudpuppy retina. J Neurophysiol. 1993;69:352–360. doi: 10.1152/jn.1993.69.2.352. [DOI] [PubMed] [Google Scholar]
- Maple BR, Gao F, Wu SM. Glutamate receptors differ in rod- and cone-dominated off-center bipolar cells. Neuroreport. 1999;10:3605–3610. doi: 10.1097/00001756-199911260-00026. [DOI] [PubMed] [Google Scholar]
- Maple BR, Werblin FS, Wu SM. Miniature excitatory postsynaptic currents in bipolar cells of the tiger salamander retina. Vision Res. 1994;34:2357–2362. doi: 10.1016/0042-6989(94)90281-x. [DOI] [PubMed] [Google Scholar]
- Matsui K, Hosoi N, Tachibana M. Excitatory synaptic transmission in the inner retina: paired recordings of bipolar cells and neurons of the ganglion cell layer. J Neurosci. 1998;18:4500–4510. doi: 10.1523/JNEUROSCI.18-12-04500.1998. [DOI] [PMC free article] [PubMed] [Google Scholar]
- Miller RF, Gottesman J, Henderson D, Sikora M, Kolb H. Pre- and postsynaptic mechanisms of spontaneous, excitatory postsynaptic currents in the salamander retina. Prog Brain Res. 2001;131:241–253. doi: 10.1016/s0079-6123(01)31020-8. [DOI] [PubMed] [Google Scholar]
- Partin KM, Patneau DK, Mayer ML. Cyclothiazide differentially modulates desensitization of alpha-amino-3-hydroxy-5-methyl-4-isoxazolepropionic acid receptor splice variants. Mol Pharmacol. 1994;46:129–138. [PubMed] [Google Scholar]
- Partin KM, Patneau DK, Winters CA, Mayer ML, Buonanno A. Selective modulation of desensitization at AMPA versus kainate receptors by cyclothiazide and concanavalin A. Neuron. 1993;11:1069–1082. doi: 10.1016/0896-6273(93)90220-l. [DOI] [PubMed] [Google Scholar]
- Pasino E, Marchiafava PL. Transfer properties of rod and cone cells in the retina of the tiger salamander. Vision Res. 1976;16:381–386. doi: 10.1016/0042-6989(76)90200-5. [DOI] [PubMed] [Google Scholar]
- Pierantoni RL, McCann GD. A quantitative study on synaptic ribbons in the photoreceptors of turtle and frog. In: Borsellino A, Cervetto L, editors. Photoreceptors. New York: Plenum Press; 1981. pp. 255–283. [Google Scholar]
- Rabl K, Cadetti L, Thoreson WB. Kinetics of exocytosis is faster in cones than rods. J Neurosci. 2005;25:4633–4640. doi: 10.1523/JNEUROSCI.4298-04.2005. [DOI] [PMC free article] [PubMed] [Google Scholar]
- Rall W. Time constants and electrotonic length of membrane cylinders and neurons. Biophys J. 1969;9:1483–1508. doi: 10.1016/S0006-3495(69)86467-2. [DOI] [PMC free article] [PubMed] [Google Scholar]
- Redman S. Quantal analysis of synaptic potentials in neurons of the central nervous system. Physiol Rev. 1990;70:165–198. doi: 10.1152/physrev.1990.70.1.165. [DOI] [PubMed] [Google Scholar]
- Roska B, Gaal L, Werblin FS. Voltage-dependent uptake is a major determinant of glutamate concentration at the cone synapse: an analytical study. J Neurophysiol. 1998;80:1951–1960. doi: 10.1152/jn.1998.80.4.1951. [DOI] [PubMed] [Google Scholar]
- Rozental R, Srinivas M, Spray DC. How to close a gap junction channel. Efficacies and potencies of uncoupling agents. Meth Mol Biol. 2001;154:447–476. doi: 10.1385/1-59259-043-8:447. [DOI] [PubMed] [Google Scholar]
- Sakaba T, Schneggenburger R, Neher E. Estimation of quantal parameters at the calyx of Held synapse. Neurosci Res. 2002;44:343–356. doi: 10.1016/s0168-0102(02)00174-8. [DOI] [PubMed] [Google Scholar]
- Schnapf JL, Copenhagen DR. Differences in the kinetics of rod and cone synaptic transmission. Nature. 1982;296:862–864. doi: 10.1038/296862a0. [DOI] [PubMed] [Google Scholar]
- Singer JH, Diamond JS. Sustained Ca2+ entry elicits transient postsynaptic currents at a retinal ribbon synapse. J Neurosci. 2003;23:10923–10933. doi: 10.1523/JNEUROSCI.23-34-10923.2003. [DOI] [PMC free article] [PubMed] [Google Scholar]
- Taylor WR, Chen E, Copenhagen DR. Characterization of spontaneous excitatory synaptic currents in salamander retinal ganglion cells. J Physiol. 1995;486:207–221. doi: 10.1113/jphysiol.1995.sp020803. [DOI] [PMC free article] [PubMed] [Google Scholar]
- Thoreson WB, Nitzan R, Miller RF. Reducing extracellular chloride suppresses dihydropyridine-sensitive calcium currents and synaptic transmission in amphibian photoreceptors. J Neurophysiol. 1997;77:2175–2190. doi: 10.1152/jn.1997.77.4.2175. [DOI] [PubMed] [Google Scholar]
- Thoreson WB, Rabl K, Townes-Anderson E, Heidelberger R. A highly Ca2+-sensitive pool of vesicles contributes to linearity at the rod photoreceptor ribbon synapse. Neuron. 2004;42:595–605. doi: 10.1016/s0896-6273(04)00254-5. [DOI] [PMC free article] [PubMed] [Google Scholar]
- Thoreson WB, Tranchina D, Witkovsky P. Kinetics of synaptic transfer from rods and cones to horizontal cells in the salamander retina. Neurosci. 2003;122:785–798. doi: 10.1016/j.neuroscience.2003.08.012. [DOI] [PubMed] [Google Scholar]
- Thoreson WB, Witkovsky P. Glutamate receptors and circuits in the vertebrate retina. Prog Retin Eye Res. 1999;18:765–810. doi: 10.1016/s1350-9462(98)00031-7. [DOI] [PubMed] [Google Scholar]
- Tranchina D, Gordon J, Shapley R, Toyoda J. Linear information processing in the retina: a study of horizontal cell responses. Proc Natl Acad Sci U S A. 1981;78:6540–6542. doi: 10.1073/pnas.78.10.6540. [DOI] [PMC free article] [PubMed] [Google Scholar]
- Vessey JP, Lalonde MR, Mizan HA, Welch NC, Kelly ME, Barnes S. Carbenoxolone inhibition of voltage-gated Ca channels and synaptic transmission in the retina. J Neurophysiol. 2004;92:1252–1256. doi: 10.1152/jn.00148.2004. [DOI] [PubMed] [Google Scholar]
- von Gersdorff H, Vardi E, Matthews G, Sterling P. Evidence that vesicles on the synaptic ribbon of retinal bipolar neurons can be rapidly released. Neuron. 1996;16:1221–1227. doi: 10.1016/s0896-6273(00)80148-8. [DOI] [PubMed] [Google Scholar]
- Witkovsky P, Stone S. Rod and cone inputs to bipolar and horizontal cells of the Xenopus retina. Vision Res. 1983;23:1251–1258. doi: 10.1016/0042-6989(83)90100-1. [DOI] [PubMed] [Google Scholar]
- Wu SM, Gao F, Maple BR. Functional architecture of synapses in the inner retina: segregation of visual signals by stratification of bipolar cell axon terminals. J Neurosci. 2000;20:4462–4470. doi: 10.1523/JNEUROSCI.20-12-04462.2000. [DOI] [PMC free article] [PubMed] [Google Scholar]
- Yamada KA, Tang CM. Benzothiadiazides inhibit rapid glutamate receptor desensitization and enhance glutamatergic synaptic currents. J Neurosci. 1993;13:3904–3915. doi: 10.1523/JNEUROSCI.13-09-03904.1993. [DOI] [PMC free article] [PubMed] [Google Scholar]
- Yang JH, Maple B, Gao F, Maguire G, Wu SM. Postsynaptic responses of horizontal cells in the tiger salamander retina are mediated by AMPA-preferring receptors. Brain Res. 1998;797:125–134. doi: 10.1016/s0006-8993(98)00373-4. [DOI] [PubMed] [Google Scholar]
- Zhang J, Wu SM. Physiological properties of rod photoreceptor electrical coupling in the tiger salamander retina. J Physiol. 2005;564:849–862. doi: 10.1113/jphysiol.2005.082859. [DOI] [PMC free article] [PubMed] [Google Scholar]


