SUMMARY
The human hCLCA1 and murine mCLCA3 (chloride channels, calcium-activated) have recently been identified as promising therapeutic targets in asthma. Recurrent airway obstruction in horses is an important animal model of human asthma. Here, we have cloned and characterized the first equine CLCA family member, eCLCA1. The 913 amino acids eCLCA1 polypeptide forms a 120-kDa transmembrane glycoprotein that is processed to an 80-kDa protein in vivo. Three single nucleotide polymorphisms were detected in the eCLCA1 coding region in 14 horses, resulting in two amino acid changes (485H/R and 490V/L). However, no functional differences were recorded between the channel properties of the two variants in transfected HEK293 cells. The eCLCA1 protein was detected immunohistochemically in mucin-producing cells in the respiratory and intestinal tracts, cutaneous sweat glands, and renal mucous glands. Strong overexpression of eCLCA1 was observed in the airways of horses with recurrent airway obstruction using Northern blot hybridization, Western blotting, immunohistochemistry, and real-time quantitative RT-PCR. The results suggest that spontaneous or experimental recurrent airway obstruction in horses may serve as a model to study the role of CLCA homologs in chronic airway disease with overproduction of mucins.
Keywords: asthma, chronic obstructive pulmonary disease, calcium-activated chloride channels, goblet cells, mucus overproduction
The CLCA gene family is a growing family of transmembrane proteins with a putative role in chloride conductivity across the outer cell membrane that is regulated by the intracellular concentration of calcium (Fuller et al. 2001). Select CLCA proteins are of high interest for respiratory disorders with chronic mucus overproduction, including asthma, chronic obstructive pulmonary disease (COPD), and cystic fibrosis. We have previously shown that the murine mCLCA3 (alias gob-5) protein is an integral transmembrane protein of goblet cell mucin granules, where it is thought to be involved in the synthesis, condensation, and secretion of mucins (Leverkoehne and Gruber 2002). hCLCA1 has become an attractive target for novel therapeutic approaches for chronic airway diseases with obstruction of small airways by overproduction of mucins, including asthma and COPD (Nakanishi et al. 2001). The rationale for this hypothesis is based on observations that: (a) hCLCA1 and its murine homolog, mCLCA3 (alias gob-5), are strongly upregulated in human asthma patients and murine asthma models, respectively (Zhou et al. 2001; Hoshino et al. 2002; Toda et al. 2002); (b) experimental overexpression of hCLCA1 and mCLCA3 results in goblet cell metaplasia, mucin overproduction, and exacerbation of the asthma phenotype (Nakanishi et al. 2001; Hoshino et al. 2002); (c) antisense-mediated repression of mCLCA3 expression reduces the asthma phenotype (Nakanishi et al. 2001); (d) functional blocking of the hCLCA1 and mCLCA3 chloride channel activity inhibits goblet cell metaplasia and mucin production and reduces airway inflammation (Zhou et al. 2002); and (e) single nucleotide polymorphisms (SNP) in the hCLCA1 gene affect the susceptibility to human asthma (Kamada et al. 2004).
Recurrent airway obstruction (RAO; COPD, heaves) in horses is the only common spontaneous disease in animals with high clinical, functional, and pathological similarities to human asthma and COPD (Snapper 1986; Bice et al. 2000). The key mechanism is thought to be based on allergen-induced hypersensitivity with Th2 cytokine–mediated chronic airway pathology including goblet cell metaplasia in small bronchioles with massive mucus overproduction (Leguillette 2003; Davis and Rush 2002). Importantly, equine RAO can be induced experimentally by environmental challenge under standardized conditions (Gerber et al. 2004). Thus equine RAO is regarded as a valuable model for human asthma and COPD (Snapper 1986; Bice et al. 2000).
In this study, we have identified, cloned, and characterized the first equine member of the CLCA gene family, here designated as eCLCA1. Specific antibodies directed against synthetic peptides were used to biochemically characterize the protein in vitro and in vivo and to systematically immunolocalize the protein in equine tissues. The eCLCA1 mRNA and protein are strongly upregulated in bronchioles of horses with RAO, extending the use of equine RAO as a model for human asthma and COPD.
Materials and Methods
Animals
Tissues from 20 adult, unrelated horses were used for this study (specific details are given in the following section). All tissues were obtained from horses that were submitted for routine necropsy to the Diagnostic Unit of the Department of Pathology, Hannover School of Veterinary Medicine, between 1985 and 2004. Horses with RAO were spontaneous cases and not induced experimentally.
Cloning of the eCLCA1 cDNA
Total RNA was extracted from the rectal mucosa of eight unrelated warm-blooded horses using the Trizol method (Invitrogen; Carlsbad, CA) and poly-A+ mRNA was purified using the Nucleotrap mRNA purification system (Macherey-Nagel; Duren, Germany). One μg of each poly (A)+ mRNA was reverse transcribed using Omniscript reverse transcriptase (Qiagen; Hilden, Germany) for 30 min at 37C in a 40-μl reaction volume using random hexamer priming (Random Primers; Promega, Madison, WI) in the presence of 100 units of RNase inhibitor (RNase OUT; Invitrogen). Sixteen different PCR primers were designed and synthesized from cDNA regions conserved between the human hCLCA1 and the murine mCLCA3 cDNA sequences (GenBank accession numbers NM001285 and NM017474, respectively). A pilot study was conducted to select a set of 2 primers from these 16 primers that yielded the best amplification results using the equine cDNA pool as template. The sequences of the primers ultimately used to generate a fragment of the homologous equine CLCA cDNA were 5′ -CACATAAAGGACATGGTGAC-3′ (upstream) and 5′-GTGACTCCTCCCAGAGCCC-3′ (downstream), generating a 1894 base-pairs product from both the murine and equine CLCA homologs. Taq polymerase (Promega) was used for PCR (0.5 units per 50 μl reaction), and PCR conditions were 35 cycles at 95C for 2 min, 55.5C for 40 sec, and 72C for 2 min with a time increment of 3 sec per cycle and a final extension at 72C for 10 min. The bulk amplification product was sequenced (SeqLab; Göttingen, Germany), and three internal PCR primer sequences chosen to perform 5′- and 3′- rapid amplification of cDNA ends (RACE; GeneRacer Kit, Invitrogen) to obtain the entire cDNA sequence. The PCR primer sequences used for RACE were 5′-CATCGTAGATGAGCCCATTCGTGG-3′ (downstream nested primer for 5′-RACE), 5′-CTTCCCTTGTGGTCCATATTCATCCAACC-3′ (downstream primer for 5′-RACE), and 5′-GATTCACCAAGGAGGCTTACCAATTCTCAGG-3′ (upstream primer for 3′-RACE). The open reading frame (ORF) comprising 2742 base pairs was selectively amplified using Pwo proof reading activity DNA polymerase (PeqLab Biotechnology; Erlangen, Germany) and NotI-linked primers flanking the ORF (upstream 5′-TAGCGGCCGCGATGGGGTCATTTAAGAGTTCTGT-3′ downstream 5′-TAGCGGCCGCCTCAGCCCAAGGCTACTGAC-3′ with NotI sites underlined). PCR conditions were 94.5C for 40 sec, 70C for 40 sec, and 72C for 2 min for 35 cycles with a final extension at 72C for 10 min. The bulk amplification product was sequenced, digested with NotI and cloned into the NotI site of the expression vector pcDNA3.1 (Invitrogen). Three individual clones were sequenced to exclude PCR-induced sequence errors. Single nucleotide polymorphisms were identified in 14 unrelated horses by sequencing three separate bulk RT-PCR products derived from each horse.
Sequence Analyses
Nucleic acid and protein sequence analyses were performed using the DNAStar software package version 5.0 (Lasergene; Madison, WI).
Northern Blot Hybridization
Poly (A)+ RNA from murine colon, equine colon, equine normal lung, and equine lung with recurrent airway obstruction was extracted as described previously, electrophoresed (~1 μg/lane) on a denaturing formaldehyde gel, blotted onto nitrocellulose, and hybridized with a (α-32P)dCTP nick-labeled (RTS RadPrime; Life Technologies, Gaithersburg, MD) cDNA probe corresponding to the ORF of mCLCA3 or a probe corresponding to the ORF of the newly cloned equine homolog. The same samples were also hybridized with a probe corresponding to the ORF of the housekeeping gene EF-1a (Schmidbauer et al. 2004) to control for RNA degradation and loading amounts. Two stringent washes were performed with 2× saline sodium citrate, 0.1% SDS at 55C for 20 min, followed by two washes with 0.1× saline sodium citrate, 0.1% SDS at 55C for 20 min. Autoradiographs were exposed to film using an intensifying screen at −70C.
Generation of Antibodies
Regions of predicted high immunogenicity were selected from the eCLCA1 polypeptide using computeraided antigenicity analysis. Two oligopeptides were synthesized (eCa, corresponding to amino acids 81–95: VPENWKTKPEYERPK, and eCb, corresponding to amino acids 278–292: DSEDFKKTTPMTAQP), conjugated to keyhole limpet hemocyanin and used for standard immunization of two rabbits each. Preimmune sera were collected before immunization and used as controls in the immunodetection experiments. The four antisera were designated α-eCa1, α-eCa2, α-eCb1, and α-eCb2. The immune sera were affinity immunopurified using the respective peptides coupled to an EAH-Sepharose column.
Native Tissue Sample Preparation and Immunoblotting
Fresh tissue samples from equine ileum and colon mucosa were lysed in 50 mM Tris pH 8.0, 150 mM NaCl, 0.5% Triton-X-100, and 0.5% sodium desoxycholate in the presence of protease inhibitors (1 mM phenylmethanesulfonyl fluoride, 1 μg/ml pepstatin, 5 μg/ml leupeptin, 5 μg/ml antipain, and 1 μg/ml aprotinin). SDS-PAGE (10%) was performed in the presence of 2 mM dithiothreitol following standard protocols. After electroblotting onto nitrocellulose membranes and blocking of the membranes with TBS containing 0.1% Tween 20 and 5% nonfat milk, membranes were probed at 4C overnight with the immunopurified antibodies or with the preimmune sera diluted in blocking buffer (dilutions ranging from 1:500 to 1:4,000). Membranes were then incubated with horseradish peroxidase–conjugated swine antirabbit immunoglobulins (0.4 μg/ml; Dako, Hamburg, Germany) and developed using enhanced chemiluminescence (Amersham).
In Vitro Translation
The eCLCA1 ORF cloned into pcDNA3.1 was transcribed and translated with the TNT T7 Coupled Reticulocyte Lysate System (Promega). Reactions of 25 μl were carried out at 30C for 90 min without or with (2μl) canine pancreatic microsomal membranes (Promega). Samples were analyzed by 10% SDS-PAGE and immunoblotting as described in the following section.
Electrophysiology
The eCLCA1/v1 or eCLCA1/v2 cDNAs were cotransfected with pEGFP-N1 into HEK293 cells plated on cover slips using GenePorter transfection reagent (Gene Therapy Systems, San Diego, CA). CLCA-expressing cells were identified by EGFP fluorescence 12–24 hr after transfection. Whole cell recordings were obtained using patch electrodes pulled from borosilicate pipettes (1.2 mm outer diameter, 0.95 mm inner diameter, with internal filament) using a Narishige PP-830 vertical puller. The recording pipettes had tips of ~1.5 μm outer diameter (R = 8–12 MΩ) and were filled with a solution containing (in mM): 98 KCH3SO4, 44 KCl, 3 NaCl, 5 HEPES, 3 MgCl2, 1 CaCl2, 3 EGTA, 2 glucose, 1 Mg-ATP, 1 GTP, and 1 reduced glutathione (pH 7.8). Free [Ca2+] in this solution was estimated to be 57 nM using MaxChelator. Cells were voltage clamped at −50 mV using an Axopatch 200B amplifier (Axon Instruments; Foster City, CA). Test pulses were applied and currents acquired using PClamp 8.2 with a Digidata 1322 interface (Axon Instruments). During recording, cells were perfused at room temperature using a singlepass, gravity-feed perfusion system (1 ml/min) with an oxygenated medium containing (in mM): 140 NaCl, 5 KCl, 2 CaCl2, 1 MgCl2, 10 HEPES, and 10 glucose (pH 7.4). Ionomycin (10 μM) and niflumic acid (100 μM) were diluted 1:10,000 into this solution from stock solutions prepared in DMSO. Experiments were conducted at room temperature. All chemicals were obtained from Sigma Chemicals (St Louis, MO) except KCH3SO4, which was obtained from Pfaltz and Bauer (Waterbury, CT).
Immunohistochemistry
Fresh tissue samples from three adult healthy horses and three adult horses with RAO were fixed in 4% neutral-buffered formaldehyde and routinely embedded in paraffin. The following organs and tissues were processed: lung (four different locations: cranial right lobe and cranial, middle, and caudal region of right main lobe), nasal cavity, trachea, liver, spleen, kidneys, renal pelvis, urinary bladder, heart, adrenal glands, thyroid glands, ovaries, oviducts, uterus, cervix, vagina, mammary glands, testes, epididymides, pancreas, parotid salivary glands, esophagus, stomach, duodenum, jejunum, ileum, cecum, ascending colon, descending colon, rectum, lymph nodes, brain (cortex, cerebellum, stem, medulla), eyes, skin, adipose tissue, skeletal muscle, bone, and aorta. Paraffin-embedded tissues were cut at 3 μm and mounted on SuperfrostPlus adhesive glass slides (Menzel-Gläser; Braunschweig, Germany). In addition to the immunohistochemical analyses, consecutive tissue sections were routinely stained with hematoxylin and eosin for histological examination and with periodic acid–Schiff (PAS) reaction to stain the mucins. The avidin-biotin-peroxidase complex (ABC) method was applied for immunohistochemical staining. After dewaxing the mounted tissue sections in xylene and rehydration in isopropanol and graded ethanol, the following antigen retrieval methods were tested: (a) 15 min microwave heating (700 W) in 10 mM citric acid pH 6.0 or (b) 20 min treatment with 0.05% pronase E (Merck) in PBS at 37C. Because of superior results of the pronase E-pretreatment, method (b) was used for the systematic tissue analyses. Endogenous peroxidase activity was inhibited by incubating the slides with 85% ethanol containing 0.5% H2O2, followed by washes in PBS containing 0.05% Tween 20 (PBS/Tween 20) and blocking in PBS/Tween 20 containing 20% heat-inactivated normal goat serum. After repeated washes, the sections were incubated with the purified antibodies or the respective preimmune sera in PBS/Tween 20 containing 1% BSA (dilutions ranging from 1:500 to 1:10,000) in a humid chamber at 4C overnight. Sections were washed in PBS/Tween 20 and incubated at room temperature for 30 min with biotinylated goat anti-rabbit immunoglobulins (5 μg/ml; Vector Laboratories) diluted in PBS/Tween 20, followed by repeated washes in PBS/Tween. Color was developed for 30 min using freshly prepared ABC solution (Vectastain Elite ABC Kit; Vector Laboratories) diluted in PBS, followed by repeated washes in PBS and rinsing in tap water. Diaminobenzidine was used as substrate for color development. The slides were counterstained with hematoxylin, dehydrated through graded ethanol, cleared in xylene, and cover slipped.
Quantitative Real-time RT-PCR
Total RNA was extracted (Trizol method; Invitrogen) from equine tissues, digested with RQ1 RNase free DNase (Promega), purified using a silica gel–based membrane (RNeasy Mini; Qiagen), and reverse transcribed as described previously. All primers and probes used for RT quantitative PCR were designed using the Beacon Designer 2 software (Premier Biosoft International; Palo Alto, CA) and purchased from PE Biosystems (Weiterstadt, Germany). Primer sequences were 5′-AAACACTCATTCAACAAATAAAGGA-3′ (upstream) and 5′-TTGGTCTCTCATACTCAGGTTT-3′ (downstream). The corresponding Taqman probe sequence was 5′-FAM-CCCAGGCATCTCCATATCTCTTTGAAGCTAMRA-3′. To correct for variations of RNA amounts and cDNA synthesis efficacy in subsequent quantitative PCR assays, primers and a probe for the detection of a fragment of the equine housekeeping gene elongation factor-1a (EF-1a; Schmidbauer et al. 2004) were generated (upstream 5′ CAAAAACGACCCACCAATGG-3′, downstream 5′-GGCCTGGATGGTTCAGGATA-3′ probe 5′-FAMAGCAGCTGGCTTCACTGCTCAGGTGTAMRA-3′) and used in parallel in all experiments. Calculated melting temperatures of all primers and probes ranged between 55.0C and 61.2C (eCLCA1) and between 60.0C and 62.4C (EF-1a), respectively. Amplicon sizes were 145 bp (eCLCA1) and 98 bp (EF-1a). Real-time RT quantitative PCR and data analysis were performed using the Mx4000 Multiplex Quantitative PCR System (Stratagene; La Jolla, CA). The reactions were carried out in MicroAmp Optical 96-well plates covered with MicroAmp Optical caps (Stratagene). In addition to the cDNA samples, 10-fold serial dilutions of cloned eCLCA1 cDNA samples (open reading frame cloned into pcDNA3.1) ranging from 108 to 102 copies per sample were used as templates to generate standard curves for estimation of copy numbers on each plate. Standard curves for EF-1a cDNA copy numbers were generated as described earlier (Schmidbauer et al. 2004). The plates contained triplicates of each cDNA sample, duplicates of serially diluted control samples for the standard curves, and a duplicate no-template control. During initial optimization runs, the exact composition of the PCR reaction mix (Brilliant QPCR Core Reagent Kit; Stratagene) and the PCR time and temperature conditions were determined using the serially diluted cloned cDNA templates and random tissue cDNA templates. Optimized 25-μl reactions contained template corresponding to 12.5 ng of total RNA, 1× core PCR buffer, 200 μM of each dNTP, 5.6 mM MgCl2, 300 nM of the respective primers, 200 nM of the respective probe, 80 nM Rox as reference dye, and 0.625 U AmpliTaq Gold polymerase (PE Biosystems). Optimized thermal cycling conditions were 10 min at 95C, followed by 42 cycles of 15 sec at 95C and 1 min at 55C. Results were quantified using the analysis software of the Mx4000 Multiplex Quantitative PCR System applying the adaptive baseline and moving average algorithm enhancements. For each sample, the cycle threshold value (Ct value) was calculated based on the normalized baseline corrected fluorescence (ΔRn).
Quantitation of Target Gene Expression
For each sample analyzed, the mean Ct value based on the results of all experiments was given together with the corresponding standard deviation (SD). cDNA copy numbers (means and SD) were calculated on the basis of the results of the standard curve of the same run (correlation coefficients were always higher than 0.95). The eCLCA1 cDNA copy numbers (means and SD) were then normalized using the calculated EF-1a cDNA copy number of the same sample. This number was obtained by applying the respective Ct value for EF-1a in the standard EF-1a dilution curve (EF-1a copy number = 10(Ct EF-1a 37.578)/− 3.2454); correlation coefficient = 0.99). The curve was generated by plotting the average EF-1a Ct values from three different experiments, each run with duplicate samples and separate serial dilutions of EF-1a DNA.
Statistical Analyses
For each cDNA sample analyzed, arithmetic mean, SD, and coefficient of variation of the results of three different experiments were calculated.
Results
Cloning of eCLCA1
Previous studies have clearly shown that the human hCLCA1 and the murine mCLCA3 are strongly expressed in goblet cells (Gruber et al. 1998; Leverkoehne and Gruber 2002). We hypothesized that if their equine homolog were expressed with a similar tissue distribution pattern, it would be present at only minimal levels in normal lung, but prominently expressed in the colon mucosa. We therefore hybridized RNA isolated from equine colon mucosa with a probe derived from the mCLCA3 ORF and obtained a clear signal from an mRNA of ~3.0 kb in length, similar to the size of the mCLCA3 mRNA in murine colon mucosa (not shown). The full-length eCLCA1 sequence (2929 bases; GenBank accession no. AY524856) was cloned from colon mucosa using primers selected based on sequence homologies between hCLCA1 and mCLCA3. The 913 amino acids eCLCA1 polypeptide (Figure 1) is most closely related to hCLCA1 (sequence identities of 82.4% on the polypeptide level and 81.8% on the mRNA level) and mCLCA3 (sequence identities of 73.5% on the polypeptide level and 71.8% on the mRNA level). Construction of a phylogenetic tree with all CLCA family members known indicated that eCLCA1 was part of a distinct cluster also containing the human hCLCA1, the murine mCLCA3, and the porcine pCLCA1 (Figure 2).
Figure 1.
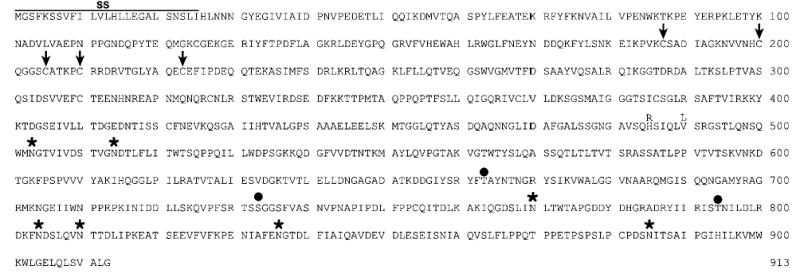
Amino acid sequence of the primary eCLCA1 translation product (GenBank accession no. AY524856). SS, hydrophobic signal sequence. Conserved cysteine residues are marked with arrows. Asterisks indicate potential sites for N-linked glycosylation; solid circles indicate consensus phosphorylation sites for calcium/calmodulin protein kinase II. Amino acid changes at positions 485 (His/Arg) and 490 (Val/Leu) from single nucleotide polymorphisms are indicated by two letters at the respective positions.
Figure 2.
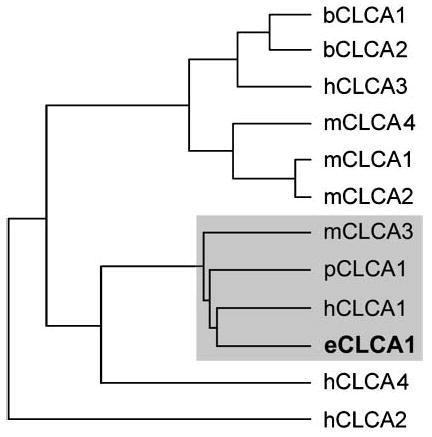
Phylogenetic tree of CLCA family members, including the first equine homolog, eCLCA1. The eCLCA1 polypeptide sequence is part of a cluster (gray box) also containing its direct orthologs, the human hCLCA1, the murine mCLCA3 (alias gob-5), and the porcine pCLCA1. The scale bar represents 5% polypeptide sequence diversity. The tree was constructed using a Clustal W alignment in the DNAStar sequence analysis software.
Analysis of the deduced eCLCA1 protein sequence revealed several features previously observed for other CLCA proteins. The 913 amino acids polypeptide with a predicted molecular weight of 100.1 kDa has a pattern of cysteine residues between amino acids 187 and 223 that is highly conserved throughout the family (C-X12-C-X4-C-X4-C-X12-C) and that is thought to contribute to protein folding and stability or ligand binding (Gruber et al. 2002). There are seven potential sites for N-linked glycosylation and three conserved consensus motifs for phosphorylation by calcium/calmodulin kinase II (Figure 1).
Single Nucleotide Polymorphisms
Sequencing cDNA clones derived from 14 different, unrelated horses revealed three SNPs at nucleotide positions 1518 (G/A), 1533 (C/G), and 1837 (G/C), respectively. Seven horses were heterozygous at all three positions (Figure 3B), and seven horses were homozygous at all three positions (three and four horses for each genotype, respectively, Figures 3A and 3C), suggesting the existence of two distinct eCLCA1 alleles, namely 1518G/1533C/1837G (designated eCLCA1/v1) and 1518A/1533G/1837C (designated eCLCA1/v2). The SNPs 1518 (G/A) and 1533 (C/G) result in amino acid changes (485 H/R and 490 V/L, respectively) whereas the SNP 1837 (G/C) is silent (587 T), with no alteration of the amino acid sequence. Both amino acid changes result in only minor size differences of the amino acid residues, but no alteration of charge properties with histidine and arginine both possessing basic side chains and valine and leucine both possessing nonpolar side chains.
Figure 3.
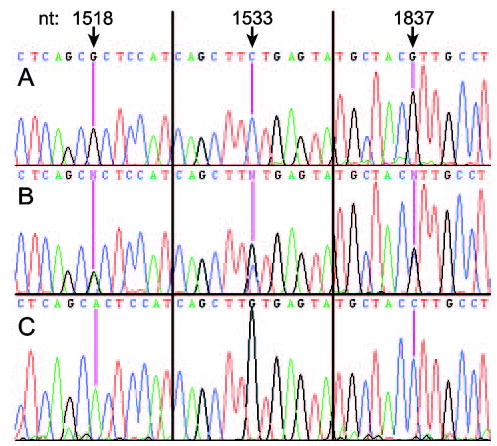
Single nucleotide polymorphisms (SNPs) within the eCLCA1 open reading frame. Three SNPs were detected in the eCLCA1 mRNA at nucleotides (nt) 1518, 1533, and 1837 in fourteen different horses. Three horses were homozygous for genotype A (eCLCA1/v1), seven horses were heterozygous (genotype B), and four horses were homozygous for genotype C (eCLCA1/v2). The SNPs were verified by sequencing of at least three different cDNA clones.
Protein Biochemistry
In vitro translation of the cloned eCLCA1 cDNA sequence generated a protein of ~100 kDa that increased in size to ~120 kDa after glycosylation by microsomal membranes (Figure 4A). Rabbit antibodies generated against synthetic peptides selected from regions with high predicted antigenicity successfully detected the in vitro translated protein of ~100kDa (Figure 4B). However, two smaller eCLCA1 proteins of ~70 kDa and 80 kDa were detected in lysates from equine colon mucosa (Figure 4B), consistent with posttranslational protein processing and cleavage of the C terminus in vivo that has been observed in other CLCA proteins previously (Gruber et al. 1999,2002).
Figure 4.
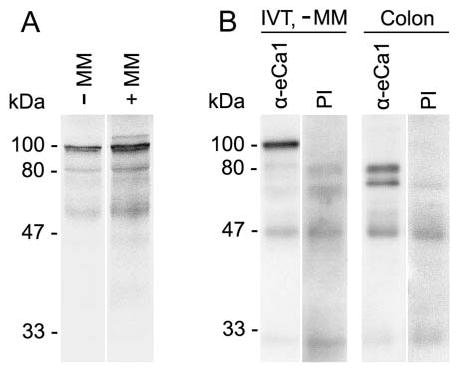
Characterization of the eCLCA1 protein in vitro and in vivo. The eCLCA1 protein was detected by (A) autoradiography after in vitro translation in the presence of 35S-methionine and (B) Western blotting using specific anti-eCLCA1 antibody α-eCa1. (A) A primary translation product of ~100 kDa was translated in vitro in the absence of microsomal membranes (−MM), which was glycosylated in the presence of microsomal membranes (+MM) to form an ~120 kDa glycoprotein. (B) The in vitro translated (IVT) primary translation product of 100 kDa (−MM) was identified by antibody α-eCa1, but not by the preimmune serum (PI) in a Western blot after SDS-PAGE. In contrast, two smaller proteins of α70 and 80 kDa were identified in protein lysates from equine colon mucosa, suggesting posttranslational cleavage of the primary translation product in vivo, similar to other CLCA proteins (Gruber et al. 2002).
Functional Characterization
Whole-cell recordings were obtained from eCLCA1-transfected cells identified by EGFP fluorescence. A calcium ionophore, ionomycin, was superfused to stimulate an increase in intracellular Ca2+. Application of ionomycin for 2 min evoked inward currents in cells expressing both eCLCA1/v1 and eCLCA1/v2 (Figure 5A). Voltage-dependent currents were assessed by applying a series of voltage steps (150 ms, −70 to +70 mV) from a holding potential of −50 mV. To obtain the current/voltage (I/V) relationship for the inward current stimulated by ionomycin, control currents were subtracted from those obtained in the presence of ionomycin (Figure 5A). The positive slopes to the I/V relationships in Figures 5B and 5C indicate that ionomycin-evoked inward currents resulted from a conductance increase. The I/V relationships for both alleles were similar, showing a modest outward rectification and reversing around −24.9 ± 2.3 mV for eCLCA1/v1 and −25.0 ± 3.7 mV for eCLCA1/v2 near the predicted Cl− equilibrium potential (ECl) of −24 mV. In control cells transfected with EGFP alone, ionomycin evoked an inward current that developed more slowly than currents observed in transfected cells and reversed at a significantly (p<0.0001) more positive value of +5.7 ± 2.1 mV (n=6). Inward currents evoked by ionomycin in CLCA-expressing but not mock-transfected control cells (n=6) were blocked by the calcium-activated chloride channel blocker, niflumic acid (0.1 mM; eCLCA1/v1: n=8 eCLCA1/v2: n=4) (Figure 5A). As with the ionomycin-evoked current, the current component blocked by niflumic acid reversed around −25.5 ± 2.4 mV (n) for eCLCA1/v1 and −23.8 ± 4.0 mV (n=4) for eCLCA/v2, near the predicted value for ECl.
Figure 5.
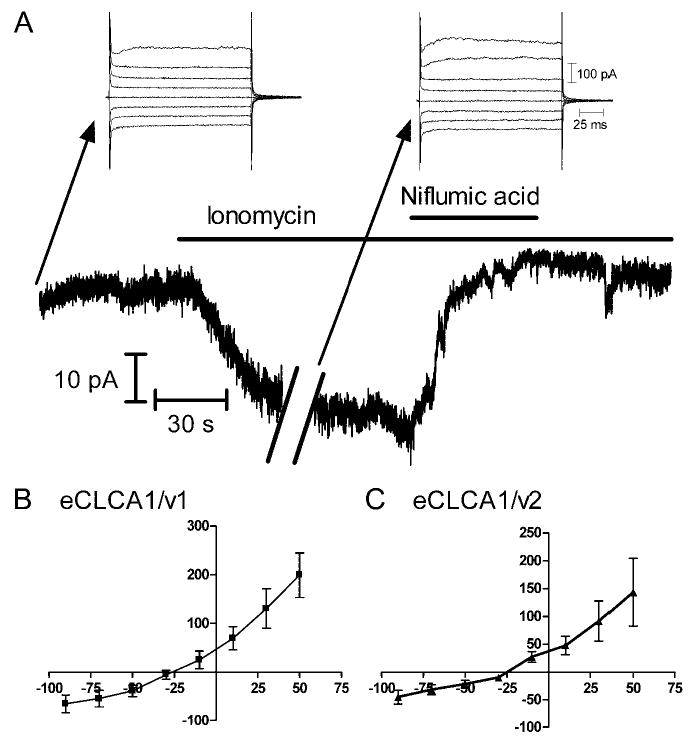
Cl− currents were evoked in eCLCA1-expressing cells by ionomycin-stimulated calcium influx. (A) Slow time-base record shows that ionomycin evoked an inward current in this eCLCA1/v1-expressing cell that was blocked by niflumic acid. The holding potential was −50 mV. Arrows indicate currents evoked in this cell by a series of voltage steps (20 mV steps, 150 msec) applied in control medium (left) and after application of ionomycin (right). There was a break in the slow time base record while the current/voltage relationship was assessed. The record terminates when the recording was abruptly lost. (B) Mean current/voltage relationship for the steady state difference current in cells expressing eCLCA1/v1 (n=13). Difference currents were obtained by subtracting step-evoked currents obtained before application of ionomycin from the currents obtained after ionomycin application. X-axis, current (pA); Y-axis, voltage (mV). (C) Mean current/voltage relationship for the steady state difference current in cells expressing eCLCA1/v2 (n=8).
Upregulation of eCLCA1 in Horses with RAO
When the eCLCA1 mRNA and protein were probed in normal equine lungs and equine lung tissue with spontaneous RAO, eCLCA1 mRNA was detected by Northern blot hybridization only in the RAO lung (Figure 6A). Similarly, although the eCLCA1 protein was weakly detectable in normal equine lung by Western blotting, it was strongly upregulated in the RAO lung (Figure 6B).
Figure 6.
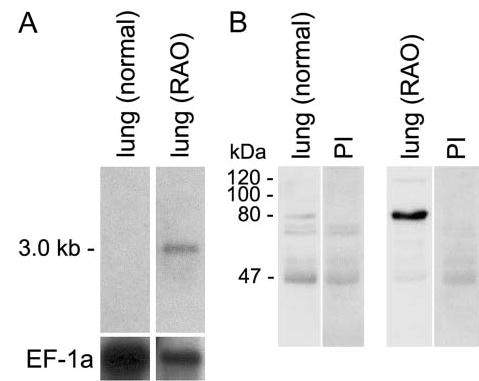
Upregulation of the eCLCA1 mRNA (A) 35S-exposure of a Northern blot) and protein (B) Western blot probed with antibody α-eCa1 or preimmune serum (PI) in equine lung tissue with recurrent airway obstruction (RAO). (A) The eCLCA1 mRNA was undetectable in the normal equine lung whereas a strong signal was obtained from a lung with RAO. (B) Likewise, the processed eCLCA1 protein of ~80 kDa was only weakly detectable in the lung of a healthy horse, whereas a strong 80-kDa signal and a weaker 120-kDa signal were detected in the lung of a horse with RAO. EF-1a, housekeeping mRNA elongation factor-1a.
Tissue Distribution Pattern
The eCLCA1 protein was systematically immunolocalized in tissues from three healthy adult horses and three adult horses with RAO. The four antibodies (α-eCa1, α-eCa2, α-eCb1, and α-eCb2) that were generated in rabbits against two synthetic peptides corresponding to two separate regions of the eCLCA1 polypeptide gave identical staining results. The results were also independent of the respective allelic variations of the horses tested. Replacing these antibodies with the respective preimmune sera resulted in no staining (Figure 7A). The eCLCA1 protein was primarily detected in mucinous glands of the intestinal and respiratory tracts and in nonmucinous glands of the skin. In the respiratory tract, both intraepithelial goblet cells and submucosal glands were strongly stained throughout the nasal cavity, trachea, and bronchi (Figures 7B–7H). Staining of consecutive tissue sections with the PAS reaction demonstrated colocalization of the eCLCA1 staining with intraepithelial mucin-producing goblet cells (Figure 7G). Pulmonary bronchi with a diameter of down to ~1 mm had strongly eCLCA1-stained goblet cells whereas smaller airways including bronchioli of ~1 mm and less had no eCLCA1 staining, corresponding with the absence of mucous containing cells. Goblet cells were also strongly stained throughout the intestinal tract (Figures 7K and 7L). In addition, all cutaneous tubular glands surrounding hair follicles (Figure 7I) and patchy islands of epithelial cells in the renal papilla (Figure 7J) had strong eCLCA1 expression. In the skin and kidney, eCLCA1-positive cells also stained strongly for mucins with the PAS reaction in consecutive tissue sections (not shown). In contrast to the lungs of healthy horses where airways of ~1 mm and smaller did not express eCLCA1 (Figure 7M), strong expression was seen in these smaller bronchioli in the lungs from horses with RAO (Figure 7N) where the staining was associated with increased numbers of goblet cells, identified by colocalization with mucins using the PAS reaction (insets in Figure 7N). High-power resolution of eCLCA1 staining strongly suggested eCLCA1 localization in goblet cell mucin granules (Figure 7F; inset in Figure 7N), as previously reported for mCLCA3 (Leverkoehne and Gruber, 2002). In addition, large amounts of mucins in the lumen of the airways stained strongly for the eCLCA1 protein (Figure 7N, arrow).
Figure 7.
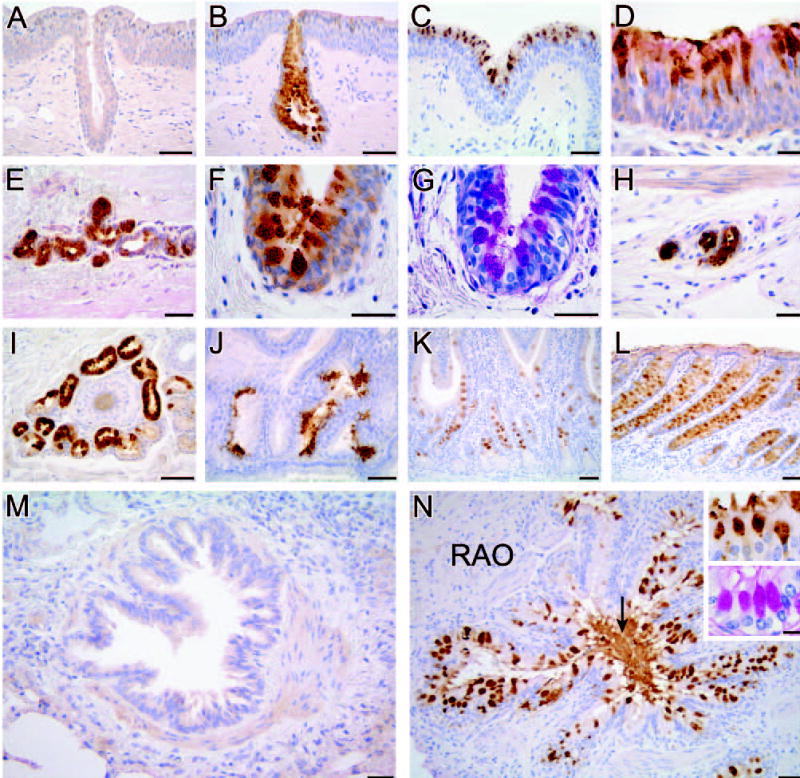
Tissue and cellular distribution pattern of the eCLCA1 protein. The protein was detected by immunohistochemistry (brown staining) on formalin-fixed, deparaffinized tissue sections from normal equine nasal mucosa (A,B). (A) Control stain with preimmune serum, nasal turbinate mucosa (C), tracheal mucosa (D), subtracheal glands (E), and mucosa of a large bronchus (F,G). (G) Stained with the periodic acid–Schiff (PAS) reaction to demonstrate colocalization with mucin producing goblet cells (here stained purple), submucosal bronchial glands (H), cutaneous tubular sweat glands surrounding a hair follicle (I), renal papilla (J), small intestine (K), and large intestine (L). When compared with a normal small bronchiolus that does not express eCLCA1 (M), bronchioli from all three horses with recurrent airway obstruction had severe goblet cell metaplasia with strong staining for eCLCA1 (N), including staining of the mucus in the lumen of the airways (arrow). The insets show colocalization of eCLCA1-positive cells (top inset) with mucin-producing goblet cells (bottom inset) that were stained with the PAS reaction. Tissue sections were incubated with antibody α-eCa1, (A–F,I–N) diluted at 1:500), or with preimmune serum (A) (diluted at 1:500), and counterstained with hematoxylin blue. Bars: A–C,E,I–N = 100 μm; D,F–H: 50μm. Inset bar: =20 μm.
To verify the tissue distribution pattern of eCLCA1 obtained by immunohistochemistry, a quantitative expression analysis of the eCLCA1 mRNA was performed from the same tissues using real time RT quantitative PCR. In principle, the results mirrored the immunohistochemical data. Strongest expression levels were detected in the gastrointestinal and respiratory tracts, with additional expression in the skin and renal papilla (Figure 8). Importantly, all tissues that were negative in the immunohistochemical analyses had virtually no detectable eCLCA1 mRNA. When the tracheal mucosa and three standardized locations from the right main lobe of the lung were compared between normal horses and RAO tissues, RAO tissues had significantly stronger eCLCA1 expression in all locations (Figure 8; trachea: 0.41 ± 0.08 versus 3.97 ± 0.09; cranial segment of the main lobe: 0.04 ± 0.01 versus 0.09 ± 0.12; middle segment of the main lobe: 0.00 ± 0.00 versus 0.23 ± 0.02; caudal segment of the main lobe: 0.00 ± 0.00 versus 0.13 ± 0.01; values are mean copy numbers of eCLCA1 per copy number of EF-1a ± SD).
Figure 8.
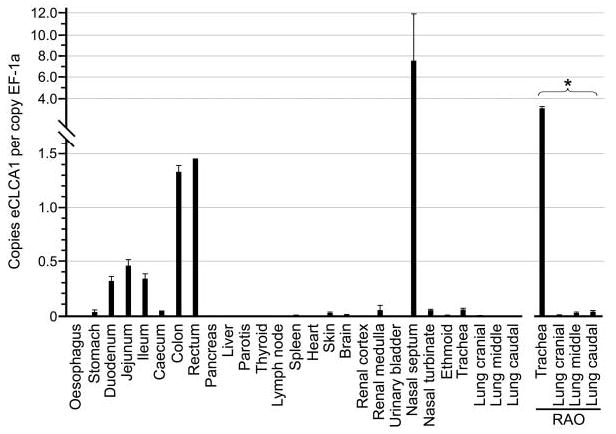
Quantitative mRNA expression analysis by real time RT-PCR of eCLCA1 in normal equine tissues and tissues from the equine respiratory tract with recurrent airway obstruction (RAO). Only a subset of all tissues investigated is shown (see text). Expression levels are given as copy numbers of eCLCA1 per copy number of the housekeeping gene elongation factor-1a (EF-1a). Columns represent mean values plus standard deviations. Asterisk indicates statistically significant difference between normal and RAO lung tissue (p<0.05).
Discussion
RAO (heaves) is the only common spontaneous disease in animals with high clinical, functional, and pathological similarities to human asthma and COPD (Snapper 1986; Leguillette 2003). hCLCA1 has become an attractive target for novel therapeutic approaches for chronic airway diseases with obstruction of small airways by overproduction of mucins, including asthma and COPD (Nakanishi et al. 2001; Zhou et al. 2002). Here, we have cloned and characterized eCLCA1, the equine ortholog of hCLCA1. Nucleotide and amino acid sequence comparisons between eCLCA1 and all other known CLCA family members have indicated closest sequence similarities between the equine eCLCA1, the human hCLCA1, the murine mCLCA3 (alias gob-5), and the porcine pCLCA1. Genomic sequence analyses and sequence data available from the fully sequenced human and murine genomes indicate that four CLCA genes exist in humans, whereas six have been identified in the mouse (Ritzka et al. 2003). Thus it seems unlikely that eCLCA1 is more closely related to any other yet-unidentified CLCA homolog in humans and mice. Importantly, the hCLCA1 and mCLCA3 chromosomal loci possess a highly conserved synteny between both species, unlike other CLCA genes in mice and humans (Ritzka et al. 2003), suggesting evolutionary conservation of this gene locus. Moreover, many features of the eCLCA1 protein structure and its tissue and cellular expression pattern closely resemble those of hCLCA1 (Gruber et al. 1998) and mCLCA3 (Leverkoehne and Gruber 2002), but not those of any other known CLCA homologs. These data strongly suggest that eCLCA1 is the true equine ortholog of hCLCA1 in humans and mCLCA3 in mice. Together with the porcine pCLCA1, these homologs seem to represent a unique cluster within the CLCA gene family, suggesting an important and unique biomedical significance.
As the first member among the CLCA family of genes, three SNPs were identified in the coding region of the eCLCA1 mRNA. Only two of these (485 His/Arg and 490 Val/Leu) result in amino acid changes. However, both changes result only in minor size differences of the amino acid residues, but no alteration of charge properties with histidine and arginine both possessing basic side chains and valine and leucine, both possessing nonpolar side chains. No differences were noted in the electrophysiological properties of the two variants after heterologous expression in this study. Nevertheless, whether the allelic variations are associated with altered protein structure or function in vivo cannot be predicted based on these experiments and will have to be addressed in future studies. Interestingly, the two nucleotide combinations, 1518G/1533C/1837G and 1518A/1533G/1837C, were invariably found in all 14 horses, suggesting the existence of only two distinct genomic alleles. This observation could be explained by the close chromosomal proximity of the SNPs compared with the hCLCA1 genomic structure (Gruber et al. 1998), making crossover events unlikely. The equal allelic distribution in 14 unrelated horses suggests that these SNPs could be useful as highly informative markers for genetic studies. We have recently shown that certain allelic variations in the human CLCA gene locus are significantly associated with the severity of the intestinal disease phenotype in cystic fibrosis patients (Ritzka et al. 2004), raising the question of whether a genetic analysis for different eCLCA SNPs or alleles may be of diagnostic or prognostic value for RAO in horses. Clearly, this issue has to be addressed in a larger population study in horses that may even be of comparative significance for asthma and COPD in humans.
The tissue and cellular expression patterns of the eCLCA1 protein are similar but not identical with the mCLCA3 protein in the mouse. Identical immunohistochemical staining patterns derived from antibodies against two distinct eCLCA1 synthetic peptides confirmed specificity of the results. Importantly, expression in respiratory goblet cells and glands and in intestinal goblet cells appears to be identical with the expression pattern of mCLCA3. However, detection of eCLCA1 in tubular sweat glands in the equine skin is at variance with observations in the mouse, in which mCLCA3 was not detected in the skin (Leverkoehne and Gruber 2002). This difference can clearly be ex plained by species-specific physiology and anatomy: tubular sweat glands in all parts of the skin and the ability to sweat via the entire skin surface are limited to humans and horses but not present in any other domestic or laboratory animal species (Talukdar et al. 1972; Banks 1993). Thus expression of eCLCA1 in the equine sweat glands may be of comparative importance for human skin. The eCLCA1 protein was also found in epithelial cells of the renal papilla, which does not express mCLCA3 in the mouse (Leverkoehne and Gruber 2002). Likewise, this discrepancy can be explained by anatomic species differences because the renal papilla contains mucous glands only in equids but not in mice or humans (Dellmann and Eurell 1998). Expression of eCLCA1 was without exception associated with PAS-positive, mucin-producing cells, strongly suggesting an essential role in mucin synthesis, condensation, or secretion. We have previously shown by immune electron microscopy that the mCLCA3 protein is located in the mucin granule membrane of goblet cells, where it may be involved in the acidification of the granule content, a critical process in the packing and secretion of mucins (Leverkoehne and Gruber 2002). The data obtained here for eCLCA1 would be consistent with a similar function in horses.
A detailed comparison with the cellular distribution pattern of the human hCLCA1 is impossible at this point because its expression pattern has not yet been systematically studied. However, based on the mRNA data available for hCLCA1, the cellular expression patterns for eCLCA1 and hCLCA1 seem to be identical in the respiratory and intestinal tracts (Gruber et al. 1998; Hoshino et al. 2002), particularly in the scenario of chronic inflammatory airway obstruction. No polymorphisms have been reported for the hCLCA1 protein so far. When the observed allelic amino acid polymorphisms of eCLCA1 are compared with the corresponding regions of the hCLCA1 protein, the first polymorphism of two basic side chains (485 His/Arg) correlates with a basic amino acid (485 Arg) in the hCLCA1 sequence (Gruber et al. 1998), suggesting strong conservation of charge. However, the second polymorphism in eCLCA1 of two nonpolar residues (490 Val/Leu) aligns with a glutamic acid residue in hCLCA1 (490 Glu) and in bCLCA1, mCLCA1, and mCLCA3 (Gruber et al. 1998), indicating some variance between the species. The functional significance of this variation remains to be determined in future studies.
Strong upregulation of the eCLCA1 mRNA and protein was observed by Northern blot hybridization, Western blotting, immunohistochemistry, and quantitative RT-PCR in the lungs of three horses with RAO, similar to the upregulation of hCLCA1 in human asthma patients and mCLCA3 in murine asthma models (Zhou et al. 2001; Hoshino et al. 2002; Toda et al. 2002). The immunohistochemical data clearly demonstrated eCLCA1 overexpression to be located in metaplastic goblet cells of small airways, primarily in bronchioli, which are responsible for mucus overexpression and airway plugging in equine RAO, human and murine asthma, and human COPD (Leguillette 2003; Rogers 2003). Thus horses with either spontaneous or experimentally induced RAO may serve as models for human COPD, including investigations on the pathophysiologic role of eCLCA1 and hCLCA1 and their suitability as therapeutic targets, both in horses and people.
Acknowledgments
We thank Julia Schirrmeier and Eric Bryson for their technical assistance. This work was supported by the German Research Council (Deutsche Forschungsgemeinschaft GR 1491/3), NEI (EY-10542), and Research to Prevent Blindness.
References
- Banks W (1993) Applied Veterinary Histology. 3rd ed. St Louis, Mosby Year Book
- Bice DE, Seagrave J, Green FH. Animal models of asthma: potential usefulness for studying health effects of inhaled particles. Inhal Toxicol. 2000;12:829–862. doi: 10.1080/08958370050123207. [DOI] [PubMed] [Google Scholar]
- Davis E, Rush BR. Equine recurrent airway obstruction: pathogenesis, diagnosis and patient management. Vet Clin North Am Equine Pract. 2002;18:453–467. doi: 10.1016/s0749-0739(02)00026-3. [DOI] [PubMed] [Google Scholar]
- Dellmann HD, Eurell J (1998) Textbook of Veterinary Histology. 5th ed. Philadelphia, Lippincott Williams & Wilkins
- Fuller CM, Ji HL, Tousson A, Elble RC, Pauli BU, Benos DJ. Ca(2+)-activated Cl(−) channels: a newly emerging anion transport family. Pflugers Arch. 2001;443(suppl 1):S107–110. doi: 10.1007/s004240100655. [DOI] [PubMed] [Google Scholar]
- Gerber V, Lindberg A, Berney C, Robinson NE. Airway mucus in recurrent airway obstruction—short-term response to environmental challenge. J Vet Intern Med. 2004;18:92–97. doi: 10.1892/0891-6640(2004)18<92:amirao>2.0.co;2. [DOI] [PubMed] [Google Scholar]
- Gruber AD, Elble RC, Ji HL, Schreur KD, Fuller CM, Pauli BU. Genomic cloning, molecular characterization and functional analysis of human CLCA1, the first human member of the family of Ca2+-activated Cl− channel proteins. Genomics. 1998;54:200–214. doi: 10.1006/geno.1998.5562. [DOI] [PubMed] [Google Scholar]
- Gruber AD, Schreur KD, Ji HL, Fuller CM, Pauli BU. Molecular cloning and transmembrane structure of hCLCA2 from human lung, trachea and mammary gland. Am J Physiol. 1999;276:C1261–1270. doi: 10.1152/ajpcell.1999.276.6.C1261. [DOI] [PubMed] [Google Scholar]
- Gruber AG, Elble RC, Pauli BU. Discovery and cloning of the CLCA gene family. Curr Top Membranes. 2002;53:367–387. [Google Scholar]
- Hoshino M, Morita S, Iwashita H, Sagiya Y, Nagi T, Nakanishi A, Ashida Y, et al. Increased expression of the human Ca2+-activated Cl− channel 1 (CaCC1) gene in the asthmatic airway. Am J Respir Crit Care Med. 2002;165:1132–1136. doi: 10.1164/ajrccm.165.8.2107068. [DOI] [PubMed] [Google Scholar]
- Kamada F, Suzuki Y, Shao C, Tamari M, Hasegawa K, Hirota T, Shimizu M, et al. Association of the hCLCA1 gene with childhood and adult asthma. Genes Immun. 2004;5:540–547. doi: 10.1038/sj.gene.6364124. [DOI] [PubMed] [Google Scholar]
- Leguillette R. Recurrent airway obstruction—heaves. Vet Clin North Am Equine Pract. 2003;19:63–86. doi: 10.1016/s0749-0739(02)00067-6. [DOI] [PubMed] [Google Scholar]
- Leverkoehne I, Gruber AD. The murine mCLCA3 (alias gob-5) protein is located in the mucin granule membranes of intestinal, respiratory and uterine goblet cells. J Histochem Cytochem. 2002;50:829–838. doi: 10.1177/002215540205000609. [DOI] [PubMed] [Google Scholar]
- Nakanishi A, Morita S, Iwashita H, Sagiya Y, Ashida Y, Shirafuji H, Fujisawa Y, et al. Role of gob-5 in mucus overproduction and airway hyperresponsiveness in asthma. Proc Natl Acad Sci USA. 2001;98:5175–5180. doi: 10.1073/pnas.081510898. [DOI] [PMC free article] [PubMed] [Google Scholar]
- Ritzka M, Weinel C, Stanke F, Tümmler B. Sequence comparison of the whole murine and human CLCA locus reveals conserved synteny between both species. Genome Lett. 2003;2:149–154. [Google Scholar]
- Ritzka M, Stanke F, Gruber AD, Pusch L, Woefle S, Veeze HJ, Halley DJ, et al. The CLCA gene locus as a modulator of the gastrointestinal basic defect in cystic fibrosis. Human Genet. 2004;115:483–491. doi: 10.1007/s00439-004-1190-y. [DOI] [PubMed] [Google Scholar]
- Snapper JR. Large animal models of asthma. Am Rev Respir Dis. 1986;133:351–352. doi: 10.1164/arrd.1986.133.3.351. [DOI] [PubMed] [Google Scholar]
- Rogers DF. The airway goblet cell. Int J Biochem Cell Biol. 2003;35:1–6. doi: 10.1016/s1357-2725(02)00083-3. [DOI] [PubMed] [Google Scholar]
- Schmidbauer SM, Venner M, von Samson-Himmelstjerna G, Drommer W, Gruber AD. Compensated overexpression of pro-collagens α1(I) and α1(III) following perilla mint ketone-induced acute pulmonary damage in horses. J Comp Pathol. 2004;131:186–198. doi: 10.1016/j.jcpa.2004.03.005. [DOI] [PubMed] [Google Scholar]
- Talukdar AH, Calhoun ML, Stinson AW. Microscopic anatomy of the skin of the horse. Am J Vet Res. 1972;33:2365–2390. [PubMed] [Google Scholar]
- Toda M, Tulic MK, Levitt RC, Hamid Q. A calcium-activated chloride channel (HCLCA1) is strongly related to IL-9 expression and mucus production in bronchial epithelium of patients with asthma. J Allergy Clin Immunol. 2002;109:246–250. doi: 10.1067/mai.2002.121555. [DOI] [PubMed] [Google Scholar]
- Zhou Y, Dong Q, Louahed J, Dragwa C, Savio D, Huang M, Weiss C, et al. Characterization of a calcium-activated chloride channel as a shared target of Th2 cytokine pathways and its potential involvement in asthma. Am J Respir Cell Mol Biol. 2001;25:486–491. doi: 10.1165/ajrcmb.25.4.4578. [DOI] [PubMed] [Google Scholar]
- Zhou Y, Shapiro M, Dong Q, Louahed J, Weiss C, Wan S, Chen Q, et al. A calcium-activated chloride channel blocker inhibits goblet cell metaplasia and mucus overproduction. Novartis Found Symp. 2002;248:150–165. discussion 165–170, 277–282. [PubMed] [Google Scholar]


