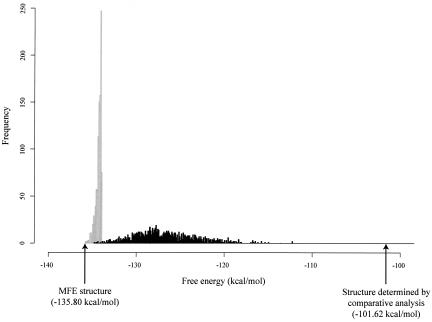
FIGURE 1.
The energy distribution of the 1000 lowest energy structures (gray bars, i.e., the partial density of states for free energy below −133.90 kcal/mol, 1.9 kcal/mol above the MFE) and the energy distribution of 1000 sampled structures (black bars, i.e., the density of states of the weighted ensemble) for Heliobacterium chlorum RNase P RNA of 342 nt in length (GenBank accession U64881). The structure determined by comparative analysis is from the RNase P database (Brown 1999) and does not contain pseudoknotted base pairs. For a comparison based on the same implementation of the thermodynamic rules, all other structures here and the free energies of all the structures were computed with the Vienna package (Hofacker 2003).

