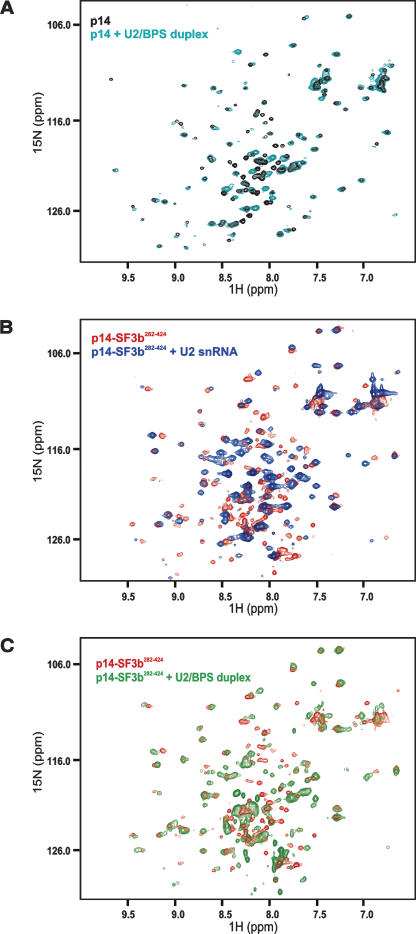
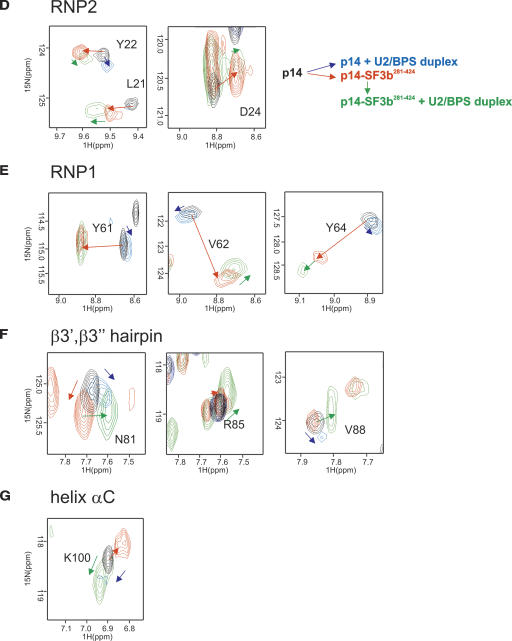
FIGURE 5.
NMR RNA titration experiments with p14 and p14–SF3b155. (A) 1H,15N correlation spectra of 15N-labeled p14 alone (black) and upon addition of the U2/BPS RNA duplex (cyan). (B) 1H,15N correlation spectra of the p14 (15N labeled)–SF3b155282–424 (unlabeled) complex (red) and upon addition of the single-stranded U2 RNA oligonucleotide (blue) (C) 1H,15N correlation spectrum of the p14 (15N labeled)–SF3b155282–424 (unlabeled) complex (red) alone and upon addition of the U2/BPS RNA duplex (green) (D–G) Enlarged views of the spectra shown in A–D for residues located in RNP2, RNP1, the β3′, β3” hairpin, and helix αC. Colored arrows show the extent of chemical-shift perturbations between free p14 and the binary and ternary complexes with SF3b155 and the U2/BPS RNA duplex as indicated.


