Abstract
Mitochondrial pseudogenes in the human nuclear genome have been previously described, mostly as a source of artifacts during the analysis of the mitochondrial genome. With the availability of the complete human genome sequence, we performed a comprehensive analysis of mtDNA insertions into the nucleus. We found 612 independent integrations that are evenly distributed among all chromosomes as well as within each individual chromosome. The identified pseudogenes account for a content of at least 0.016% of the human nuclear DNA. Up to 30% of a chromosome's mtDNA pseudogene content is composed of fragments that encompass two or more adjacent mitochondrial genes, and we found no correlation between the abundance of mitochondrial transcripts and the multiplicity of integrations. These observations indicate that the migrations of mitochondrial DNA sequences to the nucleus were predominantly DNA mediated. Phylogenetic analysis of the mtDNA pseudogenes and mtDNA sequences of primates indicate a continuous transfer into the nucleus. Because of the limited window of opportunity for mtDNA transfer to the germline, sperm mtDNA, which is released from degenerating mitochondria after fertilization, could be an important source of nuclear mtDNA pseudogenes.
[Online supplemental material available at http://www.genome.org]
The presence of DNA in the nucleus, which has a significant homology with mitochondrial DNA (mtDNA), has been known for decades. Examples can be found not only for mtDNA but also for chloroplast DNA. Moreover, these findings have been reported for a variety of species, including more than 60 animal species and plants (for a recent review, see Bensasson et al. 2001). The majority of those nuclear copies were identified, when nuclear DNA was accidentally amplified by PCR, using mtDNA-specific primers to detect mtDNA mutations. Nuclear insertions of mtDNA are also called pseudogenes because those fragments, despite their significant sequence homology, are not transcribed or translated into functional proteins. Part of this is because of the different genetic codes in mitochondrial DNA.
The process of integration of mitochondrial DNA fragments into the nucleus is a very old process that presumably started when the first endosymbionts were established as organelles (Margulis 1970). Ever since, at least in the lineage leading to animals, there has been a downsizing trend of mitochondrial DNA to relocate the genes coding for mitochondrial proteins into the nucleus. Unsuccessful establishment of a functional nuclear copy would manifest itself as a pseudogene. This concept is well illustrated by the findings that specific genes, commonly present in the mtDNA, are present and expressed in the nucleus of Chlamydomonad algae (Perez-Martinez et al. 2000, 2001).
With the availability of the human genome DNA sequence (Lander et al. 2001; Venter et al. 2001), it is now possible to obtain a more comprehensive insight into the extent of mtDNA transfer and to identify mechanisms of transfer.
RESULTS
A Map of Mitochondrial Pseudogenes in the Human Genome
Our analysis revealed the presence of 612 independent integrations of mtDNA fragments into the human genome. Only three entries, located at position 1 of chromosome 10, appeared to be duplicates of the same entry. Most of the fragments show an uninterrupted stretch of sequence, whereas some have acquired additional, non-mtDNA sequences of 100–1000 bp in length or even experienced a deletion of up to 6000 bp of DNA.
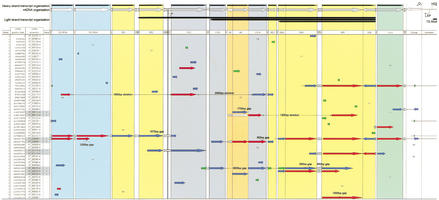
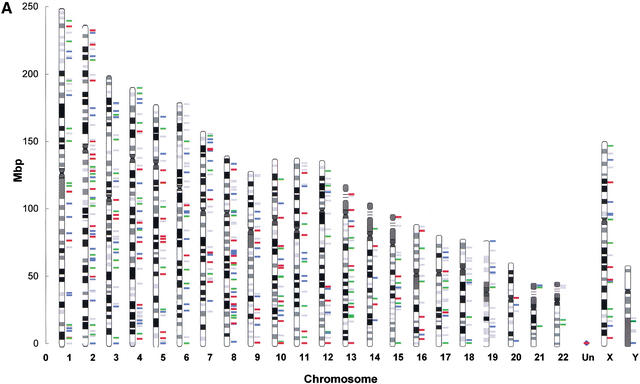
A first look at the complete map of mitochondrial pseudogenes in the human genome (see Fig. 1 for chromosome 2) reveals several important points. Pseudogenes can be found evenly distributed across all the human chromosomes. We have correlated the number of hits per chromosome and found that the expected number was closely related to the observed values (r = 0.89). For each individual chromosome, visual inspection showed that there was no apparent preference for certain loci of integration (Fig. 2a). A more detailed analysis, in which we examined a representative group (100 hits) of mitochondrial pseudogenes, showed that integrations are mostly (98%) outside annotated genes. The remaining 2% of integrations were detected in introns.
Figure 1.
MtDNA pseudogenes on chromosome 2 of the public draft of the human genome. The schematic shows the arrangement of mitochondrial pseudogenes on chromosome 2 of the human genome (public draft version from July 16, 2001). Pseudogenes (protein coding genes, rRNAs, and tRNAs) are represented as arrows, the length of which corresponds to the extent of alignment of a particular pseudogene with the mtDNA equivalent as shown on the top of the map. The representation is on scale. The arrows are shaded in four different colors depending on the degree of homology. As a measure for homology we used the BLASTN scores: >200 (red), 80–200 (blue), 50–79 (green), and <50 (gray). Isolated homologs with scores <50 are just listed as numbers. For ease of orientation, regions corresponding to genes that belong to the same subunit have the same background color, that is, rRNAs and Complex I, IV, and V. A map containing the complete chromosome set can be found in the supplementary information available at http://www.genome.org.
Figure 2.
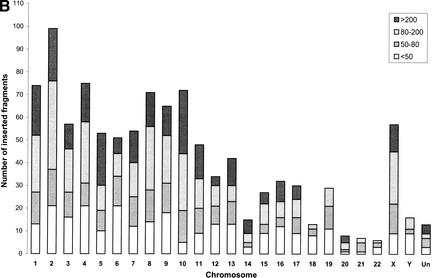
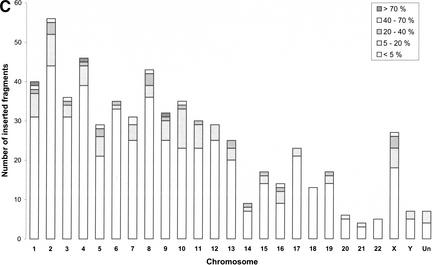
(A) Mitochondrial pseudogene locations and chromosome gene densities. The diagram compares the location of mitochondrial pseudogenes with the known gene densities for chromosomes 1–22, X, Y, and the yet unassigned contigs (Un) of the human genome. The colored bars to the right side of the chromosomes mark the presence of mtDNA fragments that were integrated into the genome. Each bar shows a single integration event and can represent the integration of a single gene or a larger piece of mtDNA. The color of the bar is determined by the best homology that can be found within this fragment and is graded by the BLASTN score: >200 (red), 80–200 (blue), 50–79 (green), and <50 (gray).(Figure 2 continued on following page.) (B) Number of mtDNA integrations into the nucleus in relation to the degree of homology. The number of mtDNA integrations into the nucleus was calculated for each chromosome. In addition to isolated pseudogenes, every single pseudogene being part of a larger piece of integrated mtDNA was regarded as one hit. Depending on the degree of homology, the numbers were split into four groups following the grading that was used before (see Fig. 1). The height of each bar represents the sum of all unique pseudogenes on one chromosome. (C) Frequency of integration of mtDNA as a function of fragment size. The extent to which an integrated fragment covered the full-length mtDNA was calculated in percentage for each contiguous fragment of the map in Figure 1. The number of fragments covering a certain range of percentages was calculated and shown as five groups that are plotted separately for each chromosome.
In addition, there is a significant number of fragments containing multiple mitochondrial gene homologs, and these fragments have a high homology with current mtDNA with up to 99% identity over the whole length. If analyzed for the number of integrations with a certain degree of homology, the chromosomes show a relatively even distribution of hits throughout all four chosen grades of homology (Fig. 2b). Most of the high homology hits are part of larger fragments, whereas the entities with lower homology often comprise only a single gene.
Although the number of integrations is representative of the frequency of independent transfer events, it does not reflect the extent of transfer in terms of fragment size. The data were therefore also analyzed in regard to the length of the fragments that were integrated with each event. Fragment lengths, spanning a contiguous region, were calculated in base pairs and expressed as percentages of mtDNA. Non-mtDNA insertions were not included. Pseudogene fragments were then placed in one of five groups depending on the percentage of coverage as shown in the legend of Figure 2c. The majority of fragments (70%–80%) covers less than 5% of mtDNA. There are only three instances with an integration of more than 70% of mtDNA: in the chromosomes 1, 4, and 9. Chromosomes 17 through 22 contain comparably low numbers of larger fragments. This is not surprising considering the overall smaller size of these chromosomes and the lower total number of hits, which would decrease the statistical chance of finding a larger fragment.
The sum of base pairs of fragments with a BLASTN score larger than 50 is close to 500,000 bp. With the total count of base pairs of the human genome being 3,084,793,808 bp (as of July 16, 2001), the contribution of mitochondrial pseudogenes to the human genome is at least 0.016%.
Integration of Mitochondrial Sequences into the Human Genome Occurred Primarily through DNA Transfer
Many mitochondrial pseudogenes in animals and other species have been identified and characterized during the last 15 years. In most cases a discussion followed concerning the mechanism by which these pseudogenes were generated. Examples for two major candidate mechanisms, transfer by DNA (Lopez et al. 1994) or by RNA intermediate (Nugent and Palmer 1991), have been described. Several findings in this report allow us to suggest that the major route of mtDNA sequence transfer into the human genome was by nonhomologous recombination of mtDNA fragments with chromosomal DNA.
Of all 615 contigs that contain pseudogenes, 17 have a fragment that covers the control region of mtDNA, the D-loop, and the promoter region. Although this number seems small, it is significant, because not all the contigs contain fragments that are in the proximity of this region to begin with. Because part of the D-loop and promoter region is a DNA-only entity (i.e., no RNA intermediate is derived from its sequence), the only plausible way of transfer of these sequences is via DNA.
For a number of fragments, we analyzed the surrounding sequence for each single pseudogene in detail. We found that those regions matched the corresponding regions in the mtDNA in sequence length and spacing. Mitochondrial mRNA from the primary heavy-strand transcript is spliced post-transcriptionally and polyadenylated (Hirsch and Penman 1974; Ojala and Attardi 1974; Ojala et al. 1981). We were not able to detect poly(A)-stretches in the intergenic space of adjacent pseudogenes within one fragment, indicating that the pseudogenes must have been derived from an unmodified piece of mtDNA.
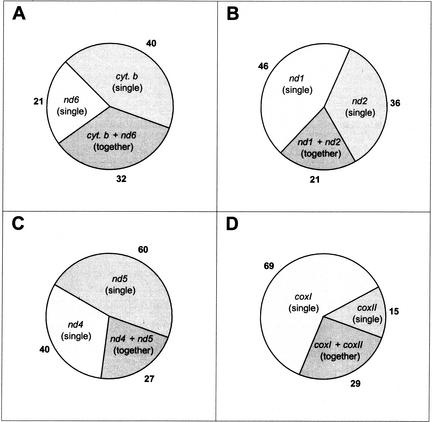
Although mtDNA transcription is polycistronic, the large transcripts are quickly processed, and the steady-state levels of the polycistronic precursors are extremely low (Attardi et al. 1990). Most genes are translated from a single, monocistronic mRNA, and 18 relatively stable transcripts have been identified (Ojala et al. 1981; Welle et al. 1999). In the case of an RNA-based transfer mechanism, it would be unlikely to see pseudogene assemblies in the human genome spanning more than one of the prevalent RNA species. The probability of two independent RNA molecules to integrate side-by-side in the human genome is less than 1/(size of genome), that is, ∼10−9. We therefore determined the number of integrations for four pairs of adjacent genes, counting the insertion events of the single genes, or of the two genes on one contiguous fragment. Figure 3A shows those numbers for the pair nd6 and cyt. b, two proteins whose genes are transcribed from opposite strands. The observed contribution of a combined transfer (34%) is comparable to the transfer of only a single gene (22% for nd6 and 43% for cyt. b). For the other pairs, nd1 and nd2, nd4 and nd5, coxI and coxII, the contributions are also significantly high, with 20%, 21%, and 25% for the respective combined entity. Because many integrations are smaller than a single gene, it is expected that most pseudogenes would not span the intersection of adjacent genes. Also, the space between the protein coding genes was consistent with the size of intervening tRNA genes (∼70–75 bp each). It is clear that in many cases the two genes were transferred as one piece into the human genome. This result is in favor of a predominantly DNA-mediated transfer.
Figure 3.
Numbers of loci containing adjacent pseudogenes or their respective isolated entities. Certain adjacent mtDNA genes are expressed from distinct mRNA species. This is the case for the four examples shown. Panel A shows the number of integrations of isolated nd6 and cyt. b pseudogenes in comparison with the integration of fragments that contain both genes in the same arrangement to each other as in mtDNA. Panels B–D show the results for the same type of analysis for the couples nd1 + nd2, nd4 + nd5, and coxI + coxII, respectively.
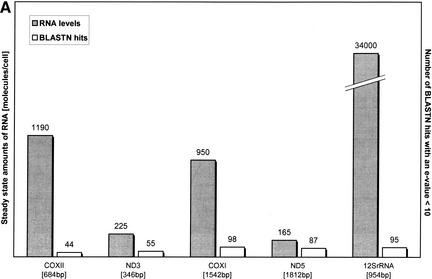
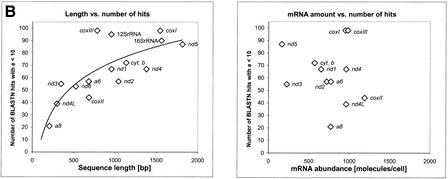
Early work has shown that the mitochondrial mRNA steady-state levels can differ by a factor of 10 between the mitochondrial genes (Attardi et al. 1990). In the case of an RNA-based transfer, the integration frequency of any given gene into the human genome would be expected to correlate with the mRNA steady-state levels for that particular gene. To test this, we compared the mRNA abundance of some genes with their respective number of BLAST hits (Fig. 4a). The diagram shows that those two entities do not correlate (correlation coefficient r = −0.18). To further support this finding, we compared the number of BLAST hits of 15 mtDNA species with either their sequence length (Fig. 4b, left) or their steady-state mRNA level in mitochondria (Fig. 4b, right). Although the number of hits did increase with sequence length (r = 0.74), as one would expect, there was no correlation between the number of hits and the mRNA abundance (r = −0.11).
Figure 4.
(A) Comparison of steady-state amounts of mitochondrial RNA and the occurrence of the corresponding pseudogene in the nuclear genome. Shown are the steady-state amounts of certain mitochondrial mRNA species and of 12S rRNA (Attardi et al. 1990) and the number of BLAST hits with an e-value <10 for that particular gene. The correlation coefficients are r = 0.87 (hits/sequence length), and r = −0.18 (hits/mRNA abundance). (B) Comparison of steady-state levels of mitochondrial mRNA and the occurrence of the corresponding pseudogene in the nuclear genome. The left chart illustrates the correlation between sequence length and the number of BLAST hits above a given threshold, with the correlation coefficient being r = 0.74. Each data point represents one of the 15 sequences of the mtDNA, including the rRNAs. On the right chart, the same number of BLAST hits as on the left chart is plotted against the steady-state levels of mitochondrial mRNA (mRNA data from Attardi et al. 1990); correlation coefficient is r = −0.11.
Comparison of Public and Private Genome Drafts
Although we did not intend to repeat the analysis as detailed as we already had for the public version, we wondered whether we would find similar results with the CELERA draft. Therefore we focused our attention on the overall pattern of mitochondrial pseudogenes derived from a6, coxI, coxII, and coxIII.
The frequencies of coxI integration into the nuclear DNA and the even distribution of hits throughout the complete genome (data not shown) are similar for both datasets, being 82 for the public and 77 for the private version. However, there are some significant differences in the exact loci positions, because not all pseudogene positions from one set are matched with the positions of the other set.
Phylogenetic Analysis of Mitochondrial Pseudogenes
Pseudogenes are like molecular fossils inside nuclear genomes and therefore might give insights into evolutionary relationships. To find out how mitochondrial pseudogene sequences compare in homology with each other and with the mtDNA sequences of several other species, we performed multiple alignments of those DNA sequences with ClustalW. The choice of the alignment algorithm was crucial because the sequences were of different length (sometimes covering only the first 30% of the complete gene and sometimes the last 20%). Still, we wanted an alignment that did not consider the length of a fragment for its placement in the tree but rather its homology as the main determinant. The resulting alignment file was then used to build the tree as described in the Methods section.
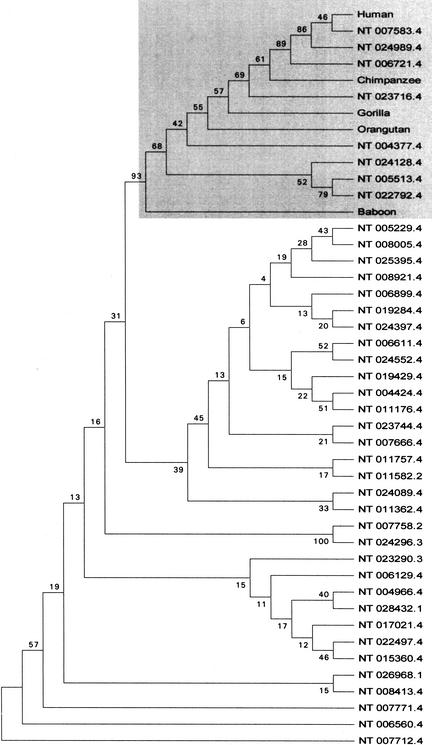
As shown in Figure 5 for coxII-derived pseudogenes, the primate branch has few pseudogenes. The majority of pseudogenes is located outside this branch. They form a series of sub-branches that indicate the presence of pseudogenes within a range of overlapping homologies, a fact that is reflected by the BLASTN scores of those pseudogenes (see above). The analysis of the genes a6 and coxIII and of 12SrRNA revealed basically the same pattern as for the aforementioned coxII gene (see online supplementary data at http://www.genome.org).
Figure 5.
Consensus tree of the phylogenetic analysis of mitochondrial gene coxII and coxII pseudogenes in the human genome. Pseudogene sequences were labeled with their contig number, which can also be found in Figure 1. The tree was constructed using maximum parsimony analysis and represents the consensus tree of equally parsimonious trees. Bootstrap values, calculated from 100 repetitions, are placed at each branchpoint. A gray box is highlighting the primate branch. The following sequences were taken from the GenBank: Human (Homo sapiens, J01415), Orangutan (Pongo pygmaeus, NC001646), Chimpanzee (Pan troglodytes, D38113), Gorilla (Gorilla gorilla, D38114), and Baboon (Papio hamadryas, Y18001).
DISCUSSION
Overview of Mitochondrial Pseudogenes in the Human Genome
There were 612 independent integrations of mtDNA sequences in the human nuclear genome. The number of identified pseudogene fragments together with the size of each fragment translates into a content of at least 0.016% of nonfunctional mitochondrial DNA inside the nuclear genome. The same calculations or estimates for other species have been performed before (Blanchard and Schmidt 1996; Bensasson et al. 2001), and it comes as no surprise that these numbers differ among species. First, it is likely that, depending on the species involved, different rates of DNA exchange throughout the cytoplasm will be observed, with the result of a more or less successful establishment of mtDNA copies inside the nuclear genome (Blanchard and Lynch 2000). Second, because pseudogenes are typically located in noncoding regions of nuclear DNA, gene densities might play an important role. The human genome, on the basis of today's knowledge, contains a large percentage of noncoding DNA. This could explain the comparably high content of mitochondrial pseudogenes in Homo sapiens as opposed to the content in species with more compact genomes, such as Drosophila melanogaster or Caenorhabditis elegans (Bensasson et al. 2001). One would have to subject other known genome datasets and future sequencing projects to exhaustive analyses to make definite conclusions regarding the differences in mitochondrial pseudogene contents.
The identified pseudogene sequences show a continuous range of homologies from almost identical to very poor but still identifiable as being derived from mtDNA. This even distribution indicates that these sequences are the result of a continuous transfer from the organelle to the nucleus, a process that is most likely still ongoing. This concept was proposed by Mourier and colleagues in a preliminary report that analyzed mtDNA pseudogenes in an early version of the human genome draft (Mourier et al. 2001). The abundance of medium and low homology sequences also makes it unlikely that these sequences are just sequencing errors because of current date mtDNA contaminations in the human genome draft. Most of the high homology hits are part of larger fragments. A potential explanation for this is that earlier integrations of mitochondrial DNA in the nucleus have accumulated more extensive modifications and deletions over time than recent transfer events. That would cause the homology score of those entities to decrease and be restricted to smaller regions.
Mechanisms of Mitochondrial Gene Transfer
Mitochondrial DNA may be transferred into the nuclear genome in a variety of ways that include DNA and RNA intermediates. None of these mechanisms are likely to be exclusive. However, given the influence of an organism's intracellular biochemistry on DNA and RNA stability and repair (Thorsness and Weber 1996; Shafer et al. 1999), preferences for the one or other mechanism to transfer organellar DNA might evolve differently for different species. The presence of larger size fragments that extend 2 or more genes indicates a predominantly DNA-mediated transfer of human mtDNA into the nucleus. These fragments account for up to 30% of a chromosome's pseudogene count.
An RNA-mediated transfer would also require that the RNA intermediates be stable enough to resist fragmentation before integration into the nuclear DNA. Therefore, it is statistically very unlikely to expect the considerable number of larger size fragments, which can be found in the genome, because they would have to be derived from the unprocessed primary transcript of either the H-strand or the L-strand (Ojala et al. 1981). These primary transcripts, however, are immediately processed into the monocistronic mRNAs, and even these RNAs have only a half-life in the range of 25 to 90 min (Attardi et al. 1990). Also, if the transfers were to occur via the RNA species, it would be reasonable to expect the number of integrations for each transcript to be proportional to the abundance of the respective transcript. Using previously reported studies on RNA stability (Gelfand and Attardi 1981; Attardi et al. 1990), we could not find support for such a correlation.
Although a full-length mitochondrial gene can be transferred to the nucleus, its product could not be functional because of the different genetic code. However, in certain cases, point mutations could revert the mitochondrial genetic code to the universal one. Moreover, the acquisition of a mitochondrial targeting sequence and an appropriate promoter could make the pseudogene functional. Such mechanisms probably took place in the evolution of some organisms (Perez-Martinez et al. 2000, 2001).
Comparison of Public and Private Human Genome Datasets
The most notable difference that we discovered between the two datasets is that some pseudogenes from one genome seem to be located at different loci in the other dataset. This appears to occur not only within one chromosome, but the pseudogene entry might be located on different chromosomes of the two genomes.
None of the datasets are 100% finished and annotated. There are still DNA sequences that contain unresolved nucleotides and/or are not yet allocated on a chromosome, and the absolute positions of contigs may change with the level of annotation. However, the conclusions from this report are unlikely to be affected by the expected refinements of both genome assemblies.
Phylogenetic Relationship among Pseudogenes Indicates Continuous Transfer of MtDNA into the Nucleus
Pseudogenes of any origin, not only mitochondrial, can be useful in the examination of evolutionary relationships. However, care has to be taken in the interpretation of distances between pseudogenes, which per definition have lost their function, and their respective active genes from which they were once derived. Nuclear mutation rates are much smaller than the rates for mtDNA (Brown et al. 1979; Brown 1981). Although pseudogenes can accumulate more mutations over time, because of the lack of pressure to stay functional, the absolute rate of mutation that mitochondrial pseudogenes will experience in the nucleus will be smaller than the rate as a part of the mtDNA (Fukuda et al. 1985; Arctander 1995).
We built cladograms from a set of pseudogenes together with the functional gene sequences of various primates. From Figure 5 it can be seen that most of the pseudogenes form their own small clusters of branches and mostly outside branches of contemporary primates' mtDNA. This could be the result of many independent integration events that occurred over a very long period of time and before the primates started forming separate groups.
Many branchpoints in the trees show a low bootstrap value, indicative of weak support for a particular branch. However, we believe this is related to the fact that even though most pseudogene sequences align entirely with the primate mtDNA, their variable size and staggered distribution result in no or only a partial overlap with each other. Therefore, the relationship between them has only weak significance, as indicated by the low bootstrap value.
Because mitochondrial pseudogene sequences in the nucleus change more slowly than their functional counterparts in the mitochondrial DNA, each pseudogene can be regarded as a snapshot of the mitochondrial DNA at the time of its transfer (Blanchard and Lynch 2000; Bensasson et al. 2001). It is reasonable to assume varying rates of transfer of mtDNA into the nucleus beginning as soon as mitochondria became part of the cell. DNA repair mechanisms and a cell's ability to cope with environmental stress and maintain organelle integrity are important determinants for that rate (Thorsness and Weber 1996; Shafer et al. 1999).
Mourier and colleagues (Mourier et al. 2001) found that branching emanated from different primate lineages, also suggesting a continuous transfer of mtDNA sequences to the nucleus. However, they did not consider that these comparisons could be skewed by different evolutionary rates.
With regard to the source of mitochondrial DNA, it is important to consider that single cell organisms may have several opportunities under which mtDNA can be made available for the transfer. Temporary breaches of the mitochondrial membrane during organelle division or its damage by toxins can lead to the escape of mtDNA into the cytoplasm and ultimately into the nucleus. However, for multicellular organisms, the only way to obtain pseudogenes and be able to pass them to the next generation is the acquisition of the mtDNA within the germline. Sperm mtDNA, which is released from degenerating mitochondria after fertilization, could be an important source of nuclear mtDNA pseudogenes.
The results in this report can only describe a snapshot of the human genome to the degree that it is known today. With more refined sequences and their analyses, better assignments can be made. Also, with the upcoming genome sequences of mouse and rat and possibly one or more primates, it will be exciting to determine whether common pseudogene loci can be identified among these species so evolutionary relationships can be confirmed or modified.
METHODS
Search for Homologs of mtDNA in the Human Genome
To identify mitochondrial pseudogenes in the human genome, we performed similarity searches with the BLAST tool (Altschul et al. 1990) on the public human genome database that is accessible through the web at http://www.ncbi.nlm.nih.gov/genome/seq/HsBlast.html. The search was performed separately for each single gene of the mitochondrial DNA. The ribosomal RNAs (12S and 16SrRNA) and the D-loop were screened for with BLASTN. For the 13 protein encoding genes, we used the tBLASTN program because it unveiled longer stretches of homology when compared with the BLASTN results. For an analysis of the private genome data from CELERA Genomics (http://public.celera.com) we were restricted to use BLASTN on all our queries. As a limiting parameter for all BLAST analyses, the maximum expectation value was set to e = 10, with all other parameters having the default value from the BLAST web site (http://www.ncbi.nlm.nih.gov/genome/seq/HsBlast.html). The sequences of the human genome that contained putative pseudogenes were retrieved from the database and are referred herein by their corresponding accession/contig numbers, that is, NT_xxxxxx.y, with y being the version number. Most of the contigs are at version number 4, which corresponds to the July 16, 2001, update of the human genome dataset at NCBI.
Mapping of Mitochondrial Pseudogenes in the Human Genome
To create a map of pseudogenes, the homologs, as identified by the BLAST search, were arranged according to their position on specific chromosome contigs. Homologs on the same contig (on the basis of their position numbers in the contig database entries) that reflect the gene arrangement in mtDNA were merged into larger fragments. The validity of this approach was verified by calculating the distance in nucleotides between those fragments on the contig and matching those values with the distance in the mtDNA. In the case that two “islands” of fragments were in proper distance from each other but the BLAST search did not return a hit for the intervening region, we connected those islands by a line indicating the integration of the whole region into the genome in one single event. If those distances did not match, but the fragments were still within a reasonable distance, we marked these regions as either having acquired an insertion (gap, distance is bigger than expected) or being deleted (deletion, distance is smaller than expected).
Phylogenetic Analysis
The multiple sequence alignments of mtDNA sequences and their respective pseudogenes were performed using the ClustalW algorithm (Thompson et al. 1994), which is included in the software package VectorNTI 6.0 (Informax, Inc.). After a visual inspection, the output of this basic alignment was used to build the phylogenetic trees by the methods of maximum parsimony (MP). The MP trees were constructed in MEGA2 (Kumar et al. 2001) using the close neighbor interchange (CNI) method with search level 2. The initial tree for the CNI search was created by random addition for 10 replications. The choice of these settings was a compromise because we were comparing up to 59 sequences, which made an exhaustive search by branch and bound or heuristic searches prohibitive. The number of informative sites for parsimony was 445/845 for a6, 449/775 for coxII, 523/1192 for coxIII, and 476/1168 for 12SrRNA, respectively. The tree for each of the four genes represents the bootstrap consensus tree from 151 (a6), 16 (coxII), 239 (coxIII), and 330 (12SrRNA) equally parsimonious trees, respectively. Each tree contains the bootstrap values as calculated by the software from 100 replicates.
WEB SITE REFERENCES
http://public.celera.com; CELERA Genomics.
http://www.ncbi.nlm.nih.gov/genome/seq/HsBlast.html; Human genome database.
Acknowledgments
We thank Kenneth E. Rudd and Jack W. Fell (University of Miami) for their expert suggestions. This work was supported by NIH grant GM55766.
The publication costs of this article were defrayed in part by payment of page charges. This article must therefore be hereby marked “advertisement” in accordance with 18 USC section 1734 solely to indicate this fact.
Footnotes
E-MAIL cmoraes@med.miami.edu; FAX (305) 243-3914.
Article and publication are at http://www.genome.org/cgi/doi/10.1101/gr.227202. Article published online before print in May 2002.
REFERENCES
- Altschul SF, Gish W, Miller W, Myers EW, Lipman DJ. Basic local alignment search tool. J Mol Biol. 1990;215:403–410. doi: 10.1016/S0022-2836(05)80360-2. [DOI] [PubMed] [Google Scholar]
- Arctander P. Comparison of a mitochondrial gene and a corresponding nuclear pseudogene. Proc R Soc Lond B Biol Sci. 1995;262:13–19. doi: 10.1098/rspb.1995.0170. [DOI] [PubMed] [Google Scholar]
- Attardi G, Chomyn A, King MP, Kruse B, Polosa PL, Murdter NN. Regulation of mitochondrial gene expression in mammalian cells. Biochem Soc Trans. 1990;18:509–513. doi: 10.1042/bst0180509. [DOI] [PubMed] [Google Scholar]
- Bensasson D, Zhang D, Hartl DL, Hewitt GM. Mitochondrial pseudogenes: Evolution's misplaced witnesses. Trends Ecol Evol. 2001;16:314–321. doi: 10.1016/s0169-5347(01)02151-6. [DOI] [PubMed] [Google Scholar]
- Blanchard JL, Lynch M. Organellar genes: Why do they end up in the nucleus? Trends Genet. 2000;16:315–320. doi: 10.1016/s0168-9525(00)02053-9. [DOI] [PubMed] [Google Scholar]
- Blanchard JL, Schmidt GW. Mitochondrial DNA migration events in yeast and humans: Integration by a common end-joining mechanism and alternative perspectives on nucleotide substitution patterns. Mol Biol Evol. 1996;13:893. doi: 10.1093/oxfordjournals.molbev.a025650. [DOI] [PubMed] [Google Scholar]
- Brown WM. Mechanisms of evolution in animal mitochondrial DNA. Ann NY Acad Sci. 1981;361:119–134. doi: 10.1111/j.1749-6632.1981.tb46515.x. [DOI] [PubMed] [Google Scholar]
- Brown WM, George M, Jr, Wilson AC. Rapid evolution of animal mitochondrial DNA. Proc Natl Acad Sci. 1979;76:1967–1971. doi: 10.1073/pnas.76.4.1967. [DOI] [PMC free article] [PubMed] [Google Scholar]
- Fukuda M, Wakasugi S, Tsuzuki T, Nomiyama H, Shimada K, Miyata T. Mitochondrial DNA-like sequences in the human nuclear genome. Characterization and implications in the evolution of mitochondrial DNA. J Mol Biol. 1985;186:257–266. doi: 10.1016/0022-2836(85)90102-0. [DOI] [PubMed] [Google Scholar]
- Gelfand R, Attardi G. Synthesis and turnover of mitochondrial ribonucleic acid in HeLa cells: The mature ribosomal and messenger ribonucleic acid species are metabolically unstable. Mol Cell Biol. 1981;1:497–511. doi: 10.1128/mcb.1.6.497. [DOI] [PMC free article] [PubMed] [Google Scholar]
- Hirsch M, Penman S. The messenger-like properties of the poly(A)plus RNA in mammalian mitochondria. Cell. 1974;3:335–339. doi: 10.1016/0092-8674(74)90047-6. [DOI] [PubMed] [Google Scholar]
- Kumar S, Tamura K, Jakobsen IB, Nei M. MEGA2: Molecular Evolutionary Genetics Analysis software. Tempe, Arizona, USA: Arizona State University; 2001. [DOI] [PubMed] [Google Scholar]
- Lander ES, Linton LM, Birren B, Nusbaum C, Zody MC, Baldwin J, Devon K, Dewar K, Doyle M, FitzHugh W, et al. Initial sequencing and analysis of the human genome. Nature. 2001;409:860–921. doi: 10.1038/35057062. [DOI] [PubMed] [Google Scholar]
- Lopez JV, Yuhki N, Masuda R, Modi W, O'Brien SJ. Numt, a recent transfer and tandem amplification of mitochondrial DNA to the nuclear genome of the domestic cat. J Mol Evol. 1994;39:174–190. doi: 10.1007/BF00163806. [DOI] [PubMed] [Google Scholar]
- Margulis L. Origin of eukaryotic cells. New Haven, CT: Yale University Press; 1970. [Google Scholar]
- Mourier T, Hansen AJ, Willerslev E, Arctander P. The Human Genome Project reveals a continuous transfer of large mitochondrial fragments to the nucleus. Mol Biol Evol. 2001;18:1833–1837. doi: 10.1093/oxfordjournals.molbev.a003971. [DOI] [PubMed] [Google Scholar]
- Nugent JM, Palmer JD. RNA-mediated transfer of the gene coxII from the mitochondrion to the nucleus during flowering plant evolution. Cell. 1991;66:473–481. doi: 10.1016/0092-8674(81)90011-8. [DOI] [PubMed] [Google Scholar]
- Ojala D, Attardi G. Expression of the mitochondrial genome in HeLa cells. XIX. Occurrence in mitochondria of polyadenylic acid sequences, “free” and covalently linked to mitochondrial DNA-coded RNA. J Mol Biol. 1974;82:151–174. doi: 10.1016/0022-2836(74)90338-6. [DOI] [PubMed] [Google Scholar]
- Ojala D, Montoya J, Attardi G. tRNA punctuation model of RNA processing in human mitochondria. Nature. 1981;290:470–474. doi: 10.1038/290470a0. [DOI] [PubMed] [Google Scholar]
- Perez-Martinez X, Vazquez-Acevedo M, Tolkunova E, Funes S, Claros MG, Davidson E, King MP, Gonzalez-Halphen D. Unusual location of a mitochondrial gene. Subunit III of cytochrome C oxidase is encoded in the nucleus of Chlamydomonad algae. J Biol Chem. 2000;275:30144–30152. doi: 10.1074/jbc.M003940200. [DOI] [PubMed] [Google Scholar]
- Perez-Martinez X, Antaramian A, Vazquez-Acevedo M, Funes S, Tolkunova E, d'Alayer J, Claros MG, Davidson E, King MP, Gonzalez-Halphen D. Subunit II of cytochrome c oxidase in Chlamydomonad algae is a heterodimer encoded by two independent nuclear genes. J Biol Chem. 2001;276:11302–11309. doi: 10.1074/jbc.M010244200. [DOI] [PubMed] [Google Scholar]
- Shafer KS, Hanekamp T, White KH, Thorsness PE. Mechanisms of mitochondrial DNA escape to the nucleus in the yeast Saccharomyces cerevisiae. Curr Genet. 1999;36:183–194. doi: 10.1007/s002940050489. [DOI] [PubMed] [Google Scholar]
- Thompson JD, Higgins DG, Gibson TJ. CLUSTAL W: Improving the sensitivity of progressive multiple sequence alignment through sequence weighting, position-specific gap penalties and weight matrix choice. Nucleic Acids Res. 1994;22:4673–4680. doi: 10.1093/nar/22.22.4673. [DOI] [PMC free article] [PubMed] [Google Scholar]
- Thorsness PE, Weber ER. Escape and migration of nucleic acids between chloroplasts, mitochondria, and the nucleus. Int Rev Cytol. 1996;165:207–234. doi: 10.1016/s0074-7696(08)62223-8. [DOI] [PubMed] [Google Scholar]
- Venter JC, Adams MD, Myers EW, Li PW, Mural RJ, Sutton GG, Smith HO, Yandell M, Evans CA, Holt RA, et al. The sequence of the human genome. Science. 2001;291:1304–1351. doi: 10.1126/science.1058040. [DOI] [PubMed] [Google Scholar]
- Welle S, Bhatt K, Thornton CA. Inventory of high-abundance mRNAs in skeletal muscle of normal men. Genome Res. 1999;9:506–513. [PMC free article] [PubMed] [Google Scholar]


