

Abstract
Background
Differentiation of the brain during development leads to sexually dimorphic adult reproductive behavior and other neural sex dimorphisms. Genetic mechanisms independent of steroid hormones produced by the gonads have recently been suggested to partly explain these dimorphisms.
Results
Using cDNA microarrays and real-time PCR we found gene expression differences between the male and female embryonic brain (or whole head) that may be independent of morphological differentiation of the gonads. Genes located on the sex chromosomes (ZZ in males and ZW in females) were common among the differentially expressed genes, several of which (WPKCI-8, HINT, MHM non-coding RNA) have previously been implicated in avian sex determination. A majority of the identified genes were more highly expressed in males. Three of these genes (CDK7, CCNH and BTF2-P44) encode subunits of the transcription factor IIH complex, indicating a role for this complex in neuronal differentiation.
Conclusion
In conclusion, this study provides novel insights into sexually dimorphic gene expression in the embryonic chicken brain and its possible involvement in sex differentiation of the nervous system in birds.
Background
Sexual differences that arise in the brain during embryonic development underlie sex-specific reproductive behavior in adults of vertebrate species. Better knowledge of the mechanisms behind sexual differentiation of the nervous system can contribute to the understanding of the brain's functions and its susceptibility to disease [1], and is critically needed in the context of developmental neurotoxicity and chemically induced disruption of the neuroendocrine system [2]. For a long time the idea prevailed that somatic tissues in the embryo are gender neutral until the gonads become hormonally active following their sex-specific differentiation, a process presumed to be governed by cell-autonomous programs genetically determined by the sex chromosomes [3-5]. However, several recent studies indicate that sex-specific neuronal characteristics may be influenced by genetic mechanisms preceding or occurring in parallel with the effects produced by the gonadal hormones [6]. That the genetic sex of neurons contributes to the process of sexual differentiation is illustrated by studies of the neural song circuit in a gynandromorphic zebra finch, where genetically male and female brain cells develop differently in the presence of the same levels of circulating gonadal hormones [7].
Birds, in which males are homogametic (ZZ) and females heterogametic (ZW), provide attractive models for the study of normal and disturbed sex-related neurobehavioral development [7,8]. The recent advent of chicken expressed sequence tag (EST) clone collections [9,10] and the release of the first draft sequence of the chicken genome [11] has paved the way for genome-wide studies of sexual differentiation in the chicken. In the chicken, the indifferent embryonic gonad rudiments differentiate morphologically around embryonic day (ed) 6.5 [12,13], whereas the expression of enzymes involved in steroidogenesis can be detected as early as ed2 [12], and estrogen receptor (ER) mRNA is detectable in the male and female urogenital system from ed4.5 [14]. The earliest signs of sexually dimorphic expression of genes related to gonadal hormones and steroidogenesis, however, have been detected at ed5 when mRNA for anti-Müllerian-hormone is more abundant in males [15], and aromatase [16] in females.
In the present study, we used cDNA microarrays to investigate if there are gene expression differences between the male and female embryonic brain (or whole head) that may be independent of morphological differentiation of the gonads. We report evidence for sex-related gene expression differences from ed4 (whole head) through ed10 (brain) for several genes located on sex chromosomes. We propose that intrinsic genetic mechanisms are involved in sexual differentiation of the chicken brain, and that sex-linked genes may play key roles.
Results
Identification of gene expression differences between male and female embryonic chicken brains
To study sex-specific gene expression in the developing brain of chicken embryos during stages around morphological differentiation of the gonads, total RNA extracted from male and female heads on ed4 and ed6, and brains on ed8 and ed10, was subjected to replicated microarray analysis using cDNA microarrays containing approximately 14,000 EST clones. For each sex, we generated a total of 12 biologically independent samples, comprising either individuals (ed10) or pools of four individuals (ed4, 6, 8 and 10). These 24 samples were analyzed on 20 array slides, with technical replication as shown in Figure 1. Using an empirical Bayes moderated t-test [17], and adjusted p-values according to Benjamini and Hochberg [18], we found 146 clones with significant differential expression (adjusted p-value < 0.0005, corresponding to a B score threshold of 3.413) across all investigated embryonic stages (Figure 2). For most of these clones, the log2 female/male ratios were relatively similar across the studied developmental stages (Figure 3, see Additional File 1). Importantly, for a majority of these clones the expression differences between males and females were present at the earliest embryonic stage (Figure 3, see Additional File 1), i.e. well before morphological gonadal differentiation.
Figure 1.
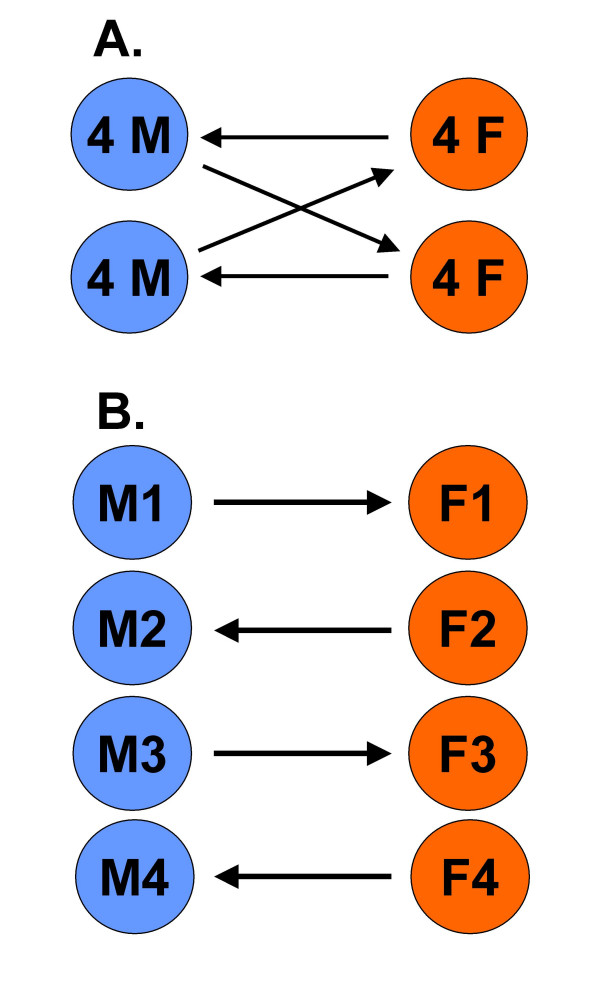
Experimental design. A total of 20 microarray hybridizations were performed, addressing biological variation through the use of 12 biologically independent samples for each sex, and technical variation through Cy3/Cy5 dye reversal as follows. (A) For each of the four embryonic stages (ed4, 6, 8 and 10), two samples per sex were generated by pooling equal amounts of total RNA from four individual male (M) or female (F) whole heads (ed4 and 6) or brains (ed8 and 10). Each RNA pool was converted to two cDNA samples, tagged with Cy3 and Cy5-capture sequence (Genisphere), respectively, and hybridized to two microarray slides, as illustrated by arrows. Arrowhead indicates Cy5-labeled sample. (B) For ed10, total RNA from four individual male (M) and female (F) brains were separately tagged with either Cy3 or Cy5-capture sequence during cDNA synthesis, and analyzed on four microarray hybridizations with dye-reversal as illustrated by arrows.
Figure 2.
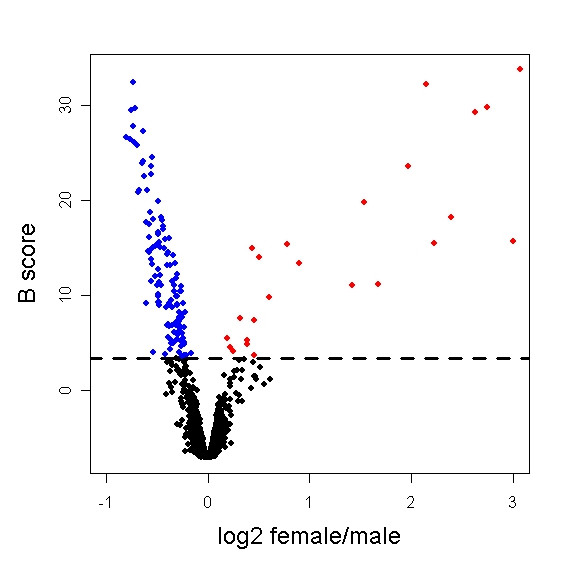
Microarray analysis of gene expression differences between female and male chicken embryos across four embryonic stages (ed4, 6, 8 and 10) in the whole head (ed4 and 6) and brain (ed8 and 10). The volcano plot shows the magnitude of differential expression (log2 female/male ratio) versus the posterior log odds of differential expression (B score) for each of 10,702 microarray clones (each represented by a dot) included in the analysis (see Methods). The horizontal line marks the threshold (B score > 3.413) for selecting a clone as significantly (adjusted p-value < 0.0005) more highly expressed in males (blue) or females (red).
Figure 3.
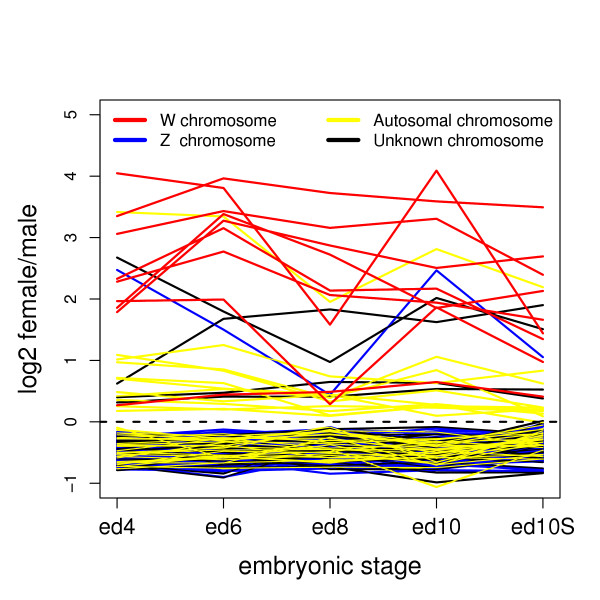
Expression difference between females and males of W-linked (red), Z-linked (blue), and autosomal (yellow) genes, and genes with unknown location (black), at ed4, 6, 8 and 10, respectively, for the 146 clones identified as significantly differentially expressed (adjusted p-value < 0.0005) in the microarray analysis. The log2 female/male ratios are averages between four replicate microarrays, using either the design illustrated in Figure 1A (ed4, ed6, ed8 and ed10), based on pools, or the design in Figure 1B (ed10S), based on separate individuals.
Characterization of differentially expressed genes
The 146 identified clones (see Additional File 2) were found to represent 133 genes, 19 of which were more highly expressed in females, and 114 in males (Table 1). Among the 'female genes', three are located on the female-specific W chromosome (Table 2), one on the Z chromosome (Table 2) and 11 on autosomes, whereas for four genes the location is unknown (Table 1). Among the 114 'male genes', 61 are located on the Z chromosome (Table 2) and 29 on autosomes, and for another 29 genes the location is unknown (Table 1). Hence, given the fraction of Z-linked clones present in the microarray (257 clones out of ~14,000), genes annotated as being located on the Z chromosome appeared overrepresented among the differentially expressed genes (Table 1). As the chicken W chromosome is still poorly characterized, with many gaps in the sequence, the same conclusion is less straightforward to draw about W-linked genes (for further details see the UCSC Genome Browser Gateway [19]).
Table 1.
Chromosomal distribution of differentially expressed clones and genes
| Differentially expressed clones and genes | ||||||
| 'Male'a | 'Female'a | 'Total' | ||||
| Chromosome | Clones | Genesb | Clones | Genesb | Clones/Genesb | Array clonesc |
| Chr W | 0 | 0 | 9 | 3 | 9/3 | 11 |
| Chr Z | 61 | 56 | 1 | 1 | 62/57 | 257 |
| Autosomal Chr | 29 | 29 | 11 | 11 | 40/40 | 10312 |
| Unknown | 31 | 29 | 4 | 4 | 35/33 | 3327 |
| Total | 121 | 114 | 25 | 19 | 146/133 | 13907 |
a 'Male' clones/genes are those more highly expressed in males and 'female' clones/genes are more highly or only expressed in females.
b The 146 clones correspond to 134 genes.
c The total chromosomal distribution of clones spotted onto the arrays as determined by a combination of manual and automated annotation.
Table 2.
Differentially expressed clones located to sex chromosomes
| Gene | Chra | More highly expressed in | Clone IDb | Log 2 female/male (min-max)c | Note |
| ABWT | W | Female | WLA084D05 | 1.79–3.3 | Confirmed (table 3) |
| SPINW | W | Female | RJA067D01 | 0.49–0.55 | Confirmed (table 3) |
| WPKCI-8 | W | Female | RJA012A11 | 3.35–3.96 | Confirmed (table 3) |
| WPKCI-8 | W | Female | RJA017G02 | 1.44–4.01 | |
| WPKCI-8 | W | Female | RJA066A02 | 0.30–1.99 | |
| WPKCI-8 | W | Female | RJA081B07 | 1.35–3.15 | |
| WPKCI-8 | W | Female | WLA034C12 | 1.66–2.77 | |
| WPKCI-8 | W | Female | WLA081D02 | 2.40–3.40 | |
| WPKCI-8 | W | Female | WLA096H02 | 1.85–3.38 | |
| 3010001K23RIK | Z | Male | ChEST386O13 | -(0.61–0.84) | |
| AGTPBP1 | Z | Male | WLB113E12 | -(0.17–0.51) | |
| AP3S1 | Z | Male | RJB097F02 | -(0.31–0.58) | |
| AP3S1 | Z | Male | WLB083F12 | -(0.34–0.59) | |
| APG12L | Z | Male | WLB057D05 | -(0.12–0.49) | |
| APTX | Z | Male | RJB091E05 | -(0.50–0.59) | |
| BRT1 | Z | Male | RJA090E06 | -(0.15–0.28) | |
| BTF2-P44 | Z | Male | WLB041B10 | -(0.32–0.52) | Confirmed (table 4) |
| CAG31437 | Z | Male | WLA074E07 | -(0.18–0.50) | |
| CBWD2 | Z | Male | RJA111F05 | -(0.12–0.55) | |
| CCDC2 | Z | Male | RJB037B08 | -(0.42–0.74) | |
| CCDC2 | Z | Male | WLB116D01 | -(0.12–0.55) | |
| CCNH | Z | Male | WLB057D11 | -(0.44–0.75) | Confirmed (table 4) |
| CLA | Z | Male | WLB050E07 | -(0.58–0.80) | Confirmed (table 4) |
| CLA | Z | Male | WLB040F04 | -(0.31–0.71) | Confirmed (table 4) |
| COX7C | Z | Male | RJB015D04 | -(0.65–0.79) | |
| DHFR | Z | Male | RJA087D10 | -(0.19–0.72) | Confirmed (table 4) |
| DNAJA1 | Z | Male | WLA058H10 | -(0.27–0.45) | |
| DNAJA1 | Z | Male | WLA019B09 | -(0.17–0.34) | |
| EDG2 | Z | Male | ChEST21M3 | -(0.19–0.37) | |
| EST unknown | Z | Male | RJA039B04 | -(0.39–0.65) | |
| EST unknown | Z | Male | RJA096G01 | -(0.37–0.41) | |
| EST unknown | Z | Male | RJA118E07 | -(0.24–0.50) | |
| EST unknown | Z | Male | RJB015F01 | -(0.19–0.44) | |
| EST unknown | Z | Male | RJB064G03 | -(0.37–0.55) | |
| EST unknown | Z | Male | WLA033F09 | -(0.63–0.76) | |
| EST unknown | Z | Male | WLA075A02 | -(0.31–0.42) | |
| EST unknown | Z | Male | WLB060B10 | -(0.38–0.50) | |
| EST unknown | Z | Male | WLB117F04 | -(0.13–0.40) | |
| FLJ21657 | Z | Male | WLB055E01 | -(0.27–0.44) | |
| FNTA | Z | Male | ChEST249K9 | -(0.13–0.43) | |
| GK004 | Z | Male | RJB071E12 | -(0.30–0.42) | |
| GNG10 | Z | Male | WLB054D11 | -(0.51–0.62) | |
| HMGCOA | Z | Male | ChEST873P23 | -(0.32–0.63) | Confirmed (table 4) |
| HNRNPK | Z | Male | WLB066G09 | -(0.15–0.39) | |
| HSPC097 | Z | Male | WLB040G10 | -(0.15–0.35) | |
| IDUA | Z | Male | WLA061C06 | -(0.23–0.45) | |
| IKAP | Z | Male | WLB112G04 | -(0.62–0.75) | |
| LOC389293 | Z | Male | RJA119B07 | -(0.16–0.36) | |
| LOC427191 | Z | Male | WLB133D02 | -(0.43–0.49) | |
| LOC427252 | Z | Male | WLB033H03 | -(0.23–0.35) | |
| MAK10 | Z | Male | RJA024F07 | -(0.51–0.77) | |
| MHM region | Z | Female | RJA001B07 | 0.44–2.58 | Confirmed (table 4) |
| MSH3 | Z | Male | ChEST701C3 | -(0.57–0.90) | |
| NANS | Z | Male | WLB031E11 | -(0.23–0.29) | |
| PAM | Z | Male | RJB064A12 | -(0.15–0.39) | |
| PAM | Z | Male | WLA096C08 | -(0.35–0.47) | |
| PAR-3 | Z | Male | ChEST812E15 | -(0.47–0.59) | |
| PG-M | Z | Male | ChEST376N5 | -(0.18–0.41) | |
| PIP5K1B | Z | Male | WLA025H03 | -(0.16–0.37) | |
| PLAAd | Z | Male | RJB016B03 | -(0.60–0.76) | |
| RAD1 | Z | Male | ChEST963P4 | -(0.45–0.66) | |
| RAD17 | Z | Male | RJA010B11 | -(0.18–0.38) | |
| RASA1 | Z | Male | ChEST57017 | -(0.58–0.70) | |
| RPS6 | Z | Male | WLB048H08 | -(0.45–0.70) | |
| RPS6e | Z | Male | WLB065B04 | -(0.47–0.67) | |
| RPS23 | Z | Male | WLA053B06 | -(0.67–0.80) | |
| SMAD2 | Z | Male | WLA084F02 | -(0.32–0.42) | Confirmed (table 4) |
| SOLT | Z | Male | ChEST368P13 | -(0.49–0.71) | Confirmed (table 4) |
| SPINZ | Z | Male | ChEST720C2 | -(0.32–0.44) | Confirmed (table 4) |
| TINP1 | Z | Male | WLB058A04 | -(0.64–0.74) | Confirmed (table 4) |
| TLE4 | Z | Male | RJA118C01 | -(0.11–0.39) | |
| VCP | Z | Male | WLA025D11 | -(0.13–0.28) | |
| ZNT-5 | Z | Male | WLB088E10 | -(0.41–0.56) |
a Chromosome
b Can be used to search against GenBank
c Log2 female/male (min – max) lists the range of average expression differences between females and males between ed4 and ed10.
d Original annotation of spotted clone was RJB020E03, which codes for autosomal ACAD8.
e Original annotation of spotted clone was WLB065A04, which codes for autosomal AATF.
The differential expression of selected genes on ed4 (and, for some genes, ed8) was investigated by real-time PCR of individual samples (see Methods) and the results (see Additional File 3) are presented below in the context of the chromosomal locations of these genes.
W-linked genes
Since the W chromosome is present only in female chickens, the expression of W-linked genes was reflected in the microarray analysis by high log2 female/male ratios (Figure 3), and in the real-time PCR analysis by even higher (technically 'infinite') ratios (Table 3). An exception from this was SPINW, for which the exclusive expression in females was not indicated by similarly high log2 female/male ratios in the microarray analysis (see Additional File 2). However, unlike what is known for the other W-linked genes reported here, SPINW has a counterpart (SPINZ) on the Z chromosome (see below). SPINW was found by real-time PCR to be expressed in the female head on ed4 (Table 3, see Additional File 3). Also the expression of WPKCI-8, for which female expression at all stages was detected by seven clones in the microarray analysis (see Additional File 2), was verified in the ed4 female head by real-time PCR.
Table 3.
W-linked genes
| Log2 female/male | |||||||
| ed4a | ed8a | ||||||
| Gene | Arrayb | PCRb | p-value | Arrayb | PCRb | p-value | Note |
| ABWTc | 1.78 | 8.73 ∞ | p < 0.05 | 2.87 | NAf | NAf | |
| SPINW | 0.27 | 11.50 ∞ | p < 0.05 | 0.49 | NAf | NAf | |
| UBE2R2 | NSe | NDEd | - | NSe | NAf | NAf | |
| WPKCI-8 | 4.05 | 13.36 ∞ | p < 0.05 | 1.58 | NAf | NAf | |
a Embryonal day 4/8.
b Array and PCR values are given as log2 female/male ratio expression differences
c ABWT is a clone expressed in females and is located adjacent to the UBE2R2 gene.
d No differential expression
e Not spotted on the microarray.
f Not available
∞ Expressed only in females
The sequence of the EST clone WLA084D05 shows no similarity to any known gene or putative protein. It is part of the UniGene entry Gga.16155 and the TIGR Gene Index entry TC216880 (Release 10.0), located about 300 nucleotides from a chicken sequence similar (>90% sequence alignment match at the amino acid sequence level) to the Ube2r2 mouse sequence (see Additional Files 4 and 5). Using primers designed to amplify this putative Ube2r2 homolog, we did not detect any significant differential expression in embryonic chicken heads. However, using primers amplifying the WLA084D05 sequence, we found expression in heads from 4-day-old female embryos (Table 3). It remains to determine whether this EST may represent a novel W-linked gene (Figure 4, see Additional File 4), which we provisionally suggest calling 'avian brain W-linked transcript' (ABWT).
Figure 4.
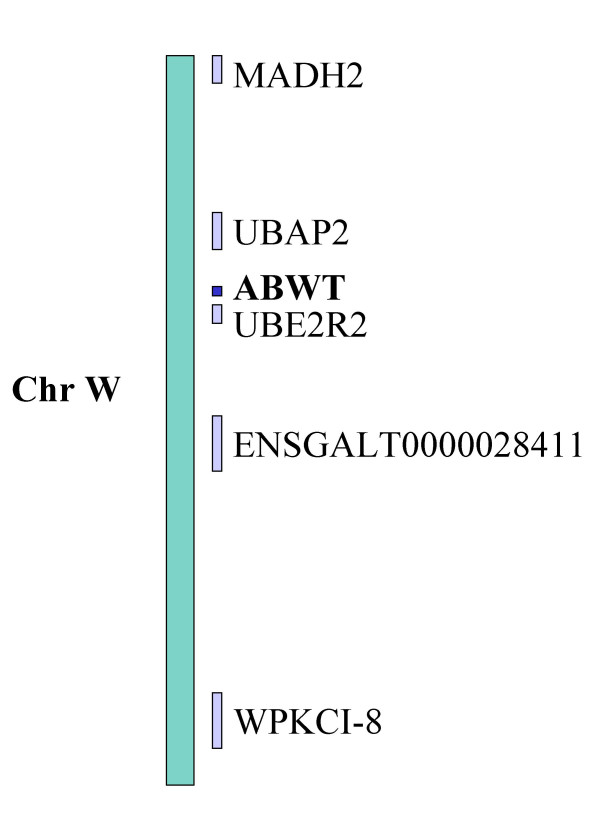
Relative location of Avian brain W-linked transcript (ABWT) in the W chromosome. The sequence of EST clone WLA084D05 (ABWT) aligns to the chicken W chromosome adjacent (~300 nt) to the gene encoding the chicken candidate for ubiquitin-conjugating enzyme E2R2 (UBE2R2). Information for the relative locations was retrieved from the UCSC Genome browser [19] and encompasses the region in chrW_random:1-455,598 (also see Additional File 3).
Z-linked genes
Whereas half of the genes (56 of 114) suggested from the microarray study to be more highly expressed in males are located on the Z chromosome, only one clone with female-enhanced expression is known to be Z-linked (Tables 1 and 2). We found 141 nucleotides of this clone (RJA001B07) to align with high similarity (98% nucleotide sequence identity) to a partial sequence of the GenBank entry with accession AB046698 (Figure 5), representing a Z-linked male hypermethylated (MHM) region. This sequence is thought to be specifically transcribed into a non-coding nuclear RNA in females [20]. Using primers designed to discriminate between the RJA001B07 and AB046698 sequences (Figure 5), we found female-specific transcription for both of these MHM genomic regions (Table 4).
Figure 5.
Comparison of MHM transcripts. Alignment between the sequence of the EST clone RJA001B07 (787 nt) and the Z-linked MHM-region sequence AB046698 (2332 nt), showing a 141-nt region with 98% sequence similarity (blue boxes). The yellow fields are the regions of BLAT alignment to the Z-chromosome (RJA001B07: chrZ:9,422,551-9,422,655 and AB046698: chrZ:9,422,028-9,423,285) in the first assembly of the chicken genome [19]. Also indicated are the approximate locations of the two primer pairs used in the real-time PCR to confirm the higher expression in females of each MHM transcript.
Table 4.
Z-linked genes
| Log2 female/male | |||||||
| ed4a | ed8a | ||||||
| Gene | Arrayb | PCRb | p-value | Arrayb | PCRb | p-value | Note |
| ANXA1c | NDEe | NDEe | - | NDEe | NDEe | ||
| BTF2-P44 | -0.26 | -0.44 | 0.06 | -0.22 | -0.73 | p < 0.05 | |
| CCNH | -0.71 | -1.09 | p < 0.05 | -0.44 | NAg | ||
| CDK7 | NSf | -0.54 | 0.12 | NSf | -0.67 | p < 0.05 | |
| CLA | -0.46 | -1.12 | p < 0.05 | -0.28 | NAg | ||
| DHFR | -0.71 | -1.00 | p < 0.05 | -0.56 | NAg | ||
| DMRT1 | NAg | NDEe | - | NDEe | - | ||
| HINT | NSf | -1.17 | p < 0.05 | NSf | -1.35 | p < 0.05 | |
| HMGCOA | -0.37 | -0.68 | p < 0.05 | -0.32 | NAg | ||
| SMAD2 | -0.32 | -0.8 | p < 0.05 | -0.42 | NAg | ||
| SOLT | -0.71 | -0.95 | p < 0.05 | -0.49 | NAg | ||
| SPINZ | -0.32 | -0.8 | p < 0.05 | -0.21 | -1.35 | p < 0.05 | |
| TINP1 | -0.63 | -0.93 | p < 0.05 | -0.74 | NAg | ||
| MHM array cloned | 2.57 | 8.21 | p < 0.05 | 0.44 | NAg | ||
| MHM GenBankd | NSf | 7.73 | p < 0.05 | NSf | NAg | ||
| TXNc | 0 | 1.05 | p < 0.05 | NAg | NAg | Contaminated by vector sequence | |
| ZO-2c | NDEe | NDEe | - | NDEe | NAg | ||
| ZOV3c | NDEe | NDEe | - | NDEe | NAg | ||
a Embryonal day 4/8.
b Array and PCR values are given as log2 female/male ratio expression differences
c ANXA1 (Annexin 1), TXN (Thioredoxin), ZO-2 and ZOV3 were randomly chosen as not differentially expressed Z-linked genes.
d Two MHM transcripts are listed; RJA001B07 (spotted on the array) and AB046698 (GenBank).
e No differential expression
f Not spotted on the microarray.
g Not available
Real-time PCR analysis confirmed the male-enhanced microarray expression for all Z-linked genes examined (Table 4). We also found significantly higher expression in males (p < 0.05) for two Z-linked genes (CDK7 and the Z-linked WPKCI-8 homolog HINT), but not for a third (DMRT1), that were not represented in the microarray but are functionally related (see Discussion) to other genes identified as differentially expressed (Table 4).
A close to two-fold higher expression in males was observed for most of the Z-linked genes in the real-time PCR analysis (Table 4), suggestive of gene dosage. Exceptions were BTF2-P44, CDK7 and HMGCOA. No differential expression was detected by real-time PCR for three genes (ANXA1, ZO-2 and ZOV3) that were randomly selected among the non-differentially expressed Z-linked genes in the microarray experiment (Table 4), supporting that only certain Z-linked genes are more highly expressed in males. A fourth Z-linked gene (TXN) randomly selected among genes that were not differentially expressed in the microarray analysis was revealed by real-time PCR to be more highly expressed in males (Table 4). However, examination of the corresponding microarray clone (RJA044E12) by sequencing showed that the spotted cDNA contained vector sequence only.
Genes located on autosomes or having unknown chromosomal location
Differential expression could be confirmed by real-time PCR for only three genes out of 14 analyzed genes with autosomal (P311) or unknown location (ACAA2 and CETN3), all with higher expression in males (Table 5). Errors in the microarray were uncovered for 6 of 11 genes that could not be confirmed by real-time PCR (Tables 4 and 5). For example, the microarray spots thought to represent the male-enhanced autosomal genes AATF and ACAD8 were found to contain EST clones representing the Z-linked genes RPS6 and PLAA, respectively (Table 5). Two of the microarray clones showing female-enhanced expression that could not be confirmed by real-time PCR were found to be erroneous and contain repetitive sequences (data not shown), whereas two such clones (representing the autosomal genes CEZANNE2 and NAT5) appeared to be correctly annotated (Table 5). The discrepancy between microarray and real-time PCR data for non-sex chromosomal gene expression remains unexplained. Unspecific cross-hybridization of sex chromosome-linked target cDNA to non-sex chromosomal array probes may be one possibility. Because of this uncertainty we decided not to further follow up on non-sex chromosomal candidates. Only microarray data on sex-chromosomal genes are reported in Table 2 (for the whole data set of 146 clones, see Additional File 2). We confirmed the absence of differential expression for the autosomal gene MAT1, a gene selected for PCR analysis because of its functional association with other genes identified as differentially expressed (see Discussion).
Table 5.
Autosomal genes and genes having an unknown location
| Log 2 female/male | |||||||||
| ed4a | ed8a | ||||||||
| Gene | Agreement between array and PCR data |
Chrb | Arrayc | PCRc | p-value | Arrayc | PCRc | p-value | Notes |
| ACAA2 | Yes | Ud | -0.50 | -0.80 | p < 0.05 | -0.18 | -1.00 | p < 0.05 | |
| CETN3 | Yes | Ud | -0.66 | -0.97 | p < 0.05 | -0.54 | -1.29 | p < 0.05 | |
| MAT1 | Yes | 5 | NDEe | NDEe | - | NDEe | NDEe | - | |
| P311 | Yes | 10 | -0.77 | -0.97 | p < 0.05 | -0.62 | -0.92 | p < 0.05 | |
| AATF | No | 19 | -0.53 | NDEe | - | -0.67 | NAf | Real identity is RPS6 from Chr Z | |
| ACAD8 | No | 24 | -0.72 | NDEe | - | -0.74 | NAf | Real identity is PLAA from Chr Z | |
| CAT-1 | No | 4 | 0.97 | NDEe | - | 0.39 | NAf | ||
| CEZANNE2 | No | 10 | 5.00 | NDEe | - | 1.95 | NAf | ||
| CX3CR | No | 2 | -0.67 | 0.34 | - | -0.49 | NAf | ||
| HERP1/HEY2 | No | 3 | -0.49 | -0.23 | - | -0.58 | NAf | Real identity is ChEST696L1 from Chr 12 | |
| MPRL3 | No | 2 | 0.49 | -0.38 | - | 0.72 | NAf | Real identity is WLB075E02 (Rep. seq) from unknown chr. locationg |
|
| NAT5 | No | 7 | 1.00 | -0.27 | - | 0.74 | NAf | ||
| PRTD-NY3 | No | 28 | 0.67 | -0.29 | - | 0.42 | NAf | Real identity is RJB067C04 from unknown chr. locationg |
|
| RJA094A01 | No | 9 | 0.70 | NDEe | - | 0.45 | NAf | ||
| ZNF216 | No | Ud | 0.32 | 0.15 | - | 0.41 | NAf | ||
a Embryonal day 4/8.
b Chromosome
c Array and PCR values are given as log2 female/male ratio expression differences
d Unknown chromosomal localization
e No differential expression
f Not available
g Rep. seq stands for repetitive sequence.
Discussion
Relatively little is known about the genes that are involved in neuronal sex differentiation in birds, whether influenced by gonadal steroid hormones or not. In the present study we used cDNA microarrays to identify genes that are differentially expressed between males and females in the developing chicken brain (or whole head) before (ed4) and during (ed6, 8 and 10) morphological differentiation of the gonads. We found statistical significance (adjusted p-value < 0.0005) for differential expression of 146 microarray clones across the embryonic stages and types of tissue sample (whole head for ed4 and 6, and brain for ed8 and 10). These clones correspond to ~1.4% of the ~10,700 clones included in the analysis. Using real-time PCR we were able to confirm female expression for all three W-linked genes identified, and the differential expression of all ten Z-linked genes tested and three genes with autosomal or unknown location. The real-time PCR analysis furthermore revealed one false negative among Z-linked genes (TXN), and some false positives among genes located on autosomal or unknown chromosomes. In many cases, however, this could be traced to errors in the microarrays.
A major finding was that sex-specific differential expression could be detected for numerous genes already at the earliest studied embryonic stage (ed4), before the stage (~ed5) at which the earliest sex differences in gonadal gene expression with regard to steroidogenesis have been found [15,16,21]. Expression of several genes for steroidogenic enzymes (P450scc, P450c17, 3-βHSD, 17βHSD, and aromatase) in chicken gonads already on ed4 has been documented, but no sex-dependent expression differences [21]. Even if we cannot rule out the possibility that hormonal differences between males and females may exist on ed4, the early sex-specific expression of the genes reported in the present study may be primarily regulated by other mechanisms than hormonal control. In favor of this notion, we found no apparent relationship between the expected differences in hormonal levels associated with gonadal differentiation [12] and the magnitude of the expression differences between the sexes for these genes (Figure 3). Moreover, our preliminary data from chicken embryos exposed to ethinyl estradiol in ovo on ed4 show that the expression in the brain on ed10 for the majority of these genes is virtually unaffected by treatment in either sex (work in progress).
Gene expression differences independent of gonadal hormones have previously been suggested to play critical roles in the sexual differentiation of the brain in birds [22] and mice [23]. Why an apparently different set of genes should be involved in the chicken compared to the mouse [23] is unclear. That such a large proportion of genes located on the sex chromosomes (Z and W) were identified as differentially expressed in the chicken is therefore intriguing considering the independent evolution and different gene content of the sex chromosomes in birds and mammals [24].
A majority of the genes indicated to be differentially expressed from the microarray analysis were more highly expressed in males than in females, and about half of these genes are located on the Z chromosome. This raises the issue of dosage compensation versus biallelic expression of Z-linked genes in males [25]. Although biallelic expression has previously been demonstrated [26,27], and might be inferred from the close to two-fold higher expression in males of many Z-linked genes in our study, the expression levels of some Z-linked genes were found both by microarray and PCR analysis not to differ significantly between the sexes. Such a lack of sex differences in the expression of certain genes located on the Z chromosome would be in line with previous evidence for dosage compensation [28]. Taken together, our results suggest that if dosage compensation does occur in chicken it is unlikely to involve a widespread inactivation of the Z chromosome similar to that of the mammalian X chromosome. Studies by McQueen and coworkers [28] in chicken embryos have shown that at least six genes on the Z chromosome are dosage compensated. However, Kuroda and coworkers [26] found that transcription of five genes, including two of the genes studied by McQueen and coworkers [28], is taking place on both Z chromosomes of male chicken. This provides further support that dosage compensation in birds does not involve inactivation of a large majority of genes on the Z chromosome.
That epigenetic mechanisms such as methylation and acetylation may be involved in the sex-specific expression of genes located on the Z chromosome has previously been implicated by the female-specific expression of the Z-linked MHM region [20,29]. In agreement with this, our microarray results showed high female/male ratios suggestive of expression in females only of two distinctive transcripts containing an MHM region. Whether these transcripts, represented by microarray clone RJA001B0 (Table 2) and GenBank entry AB046698[20], respectively, are expressed from the same or independent genomic regions is unclear. Their highly similar MHM regions (141 nucleotides with 98% identity) and their female-specific expression indicate some common function, possibly the repression of the adjacent gene DMRT1, suggested as a conserved sex determining gene [30-35], through the accumulation of a non-coding RNA [20]. However, unlike in male gonads before and during gonadal differentiation [32,36,37], we found no evidence of male-enhanced expression of DMRT1 in the embryonic chicken brain.
We found high female/male expression ratios on ed4 for three genes/clones (WPKCI-8, SPINW and ABWT) located on the female-specific W chromosome, indicating significant early expression in the female embryonic brain. Because of its early expression (ed4.5) in the developing female gonads [38,39], WPKCI-8 (also known as ASW) has been suggested to be involved in avian sex determination [13]. Early WPKCI-8 expression (ed5) has also been detected in the spinal cord, spinal ganglion, and myotomes [38]. The WPKCI-8 gene, which is reiterated approximately 40 times on the W chromosome [25], and its single-copy homolog on the Z chromosome HINT [25] both encode proteins belonging to the Hint family of dimeric nucleotide hydrolases [38]. The Wpkci-8 protein, however, lacks the histidine triad (HIT) motif [25] and appears to act as a dominant suppressor of Hint activity, possibly by conferring signals for mislocalization or degradation of the Hint/Wpkci-8 heterodimers [40] (Figure 6). It is an interesting possibility that suppressed levels of active Hint in the brain of female chicken embryos, resulting from both lower expression of the HINT gene itself and inhibition by expressed Wpkci-8, could contribute to sexual differentiation of the nervous system. Female expression of WPKCI-8 and male-enhanced expression of HINT has previously been detected in the telencephalon of juvenile zebra finches [41]. The Hint protein (also known as protein kinase C inhibitor/interacting protein) is well conserved between species [38,39], but whether this protein is involved in sex determination or sexual differentiation in various species is unclear.
Figure 6.
Differentially expressed genes related to sex determination/differentiation and/or the TFIIH protein complex (see Discussion). Higher expression in males (ZZ) or females (ZW) of Z-linked and W-linked genes is indicated by arrows pointing upward. Short arrows ( ) indicate ≤2-fold difference, and long arrows (↑) indicate >2-fold difference, as determined by real-time PCR. Genes not differentially expressed are indicated with a dash (—). Long thin arrows (→) indicate gene product associations. A dotted bracket shows the possible interaction between HINT and the TFIIH complex.
We found male-enhanced expression for two Z-linked genes (CCNH and CDK7) known to encode subunits of the cyclin-dependent kinase activating kinase (CAK) complex, and a third one (BTF2-P44) encoding a subunit of the transcription factor II H (TFIIH) core complex. Together these complexes constitute the basal transcription complex TFIIH, which is involved in transcription, DNA repair, and cell-cycle control [33]. Among the genes encoding the nine proteins (CDK7, CCNH, MAT1, ERCC2, ERCC3, BTF2-P34, BTF2-44, BTF2-52, BTF2-62) in this complex [33], two (ERCC2 and BTF2-52) appear to be less conserved in the chicken genome (see Additional Files 6 and 7). The implications of the male-enhanced expression of some but not all components of CAK (we found no differential expression for its third component MAT1) and the TFIIH core complex remains to be elucidated. However, it is intriguing that both CAK and TFIIH are involved in estrogen receptor α (ERα) and androgen receptor (AR) transactivation in mammals [42-45], and that a functional CAK is important for both the mitotic and meiotic cell cycle [46-48]. The proteins encoded by the Z-linked genes HINT and APTX, are both members of the HIT protein superfamily [49]. APTX, which in the microarrays is more highly expressed in males, encodes aprataxin, a protein involved in single-strand break repair [50,51] and Hint seems to function as a positive regulator of components of TFIIH [40], including the CCNH homolog Ccl1 [52]. Considering the role of TFIIH in DNA-repair, a sex specific control of DNA repair seems possible. In addition to TFIIH components, three other Z-linked genes associated with DNA repair (RAD1 [53], MSH3 [54], and DHFR [55]) were found in the microarray result to be more highly expressed in males.
Analogous to the sex-dependent expression of WPKCI-8 and HINT, the W-linked gene SPINW was expressed in females while the Z-linked homolog SPINZ showed male-enhanced expression. SPINW, which is prominently expressed in ovarian and somatic tissues, has been suggested to be involved in gonadal differentiation [56], but the early (ed4) sex-specific expression of these genes in the brain may indicate a more widespread involvement in sexual differentiation. We also identified a W-linked transcript, ABWT, which in addition to being expressed in the early female embryonic brain has also been found in cDNA libraries from chicken ovaries and heart (UniGene entry Gga.16155). ABWT maps to the genome in the vicinity of the homolog to mouse Ube2r2 (i.e. chicken gene UBE2R2), a gene belonging to the E2 family of ubiquitin-conjugating enzymes [57]. As we were unable to detect any differential expression of UBE2R2 transcripts, however, the detected ABWT transcripts appear to be distinct from these. It remains to be determined whether ABWT is a splice variant of a UBE2R2 transcript, a novel gene encoding a yet unidentified protein or a non-coding RNA.
Conclusion
In conclusion, this study provides hints to mechanisms behind sexual differentiation of the nervous system in birds and raises several new questions. The expression of W-linked genes supports the presence of 'sex-control genes' similar to the mammalian SRY gene, in addition to the possible gene dosage effects from genes on the Z chromosomes. Future studies will reveal if the W- and Z-linked genes are differentially expressed in the early embryonic brain of different bird species and if differential expression of these genes is present also in other tissues. It should be noted, however, that WPKCI-8, an apparent key player in sexual differentiation [13,38], is not reiterated on [38], and may even not be linked to [39], the W chromosome of the primitive ratites (emus and ostriches). The crucial importance of sex steroids for organization of the brain and behavior in birds has been shown in several studies (as reviewed by Balthazart et al [58] and Panzica et al [59]), but the results presented in this paper point toward the possible presence also of a genetic component in sex-specific neuronal differentiation. Consequently, it seems likely that genetic and hormonal control interact to organize the avian brain dimorphism during differentiation.
Methods
Embryos and sample collection
Fertilized eggs from White Leghorn fowl were purchased from OVA Production (Morgongåva, Sweden). The eggs were incubated at 37.5°C and 60% relative humidity, and were turned every 3 hours. After 8 or 10 days of incubation (ed8 and ed10), whole brains were dissected out. As brains could not be excised in a reproducible way from earlier embryos (ed4 and ed6), whole heads were collected. Heads were excised along a line from the mandibular and maxillary processes of the first pharyngeal arch to the caudal boundary of the myelencephalon (ed4), or from immediately in front of the maxillary process to the caudal boundary of the myelencephalon (ed6). Samples were immediately frozen in liquid nitrogen, and stored at -70°C. A tissue sample from each embryo was also collected for DNA isolation and genetic sexing according to a PCR-based method [60] in which intron sequences of different lengths in the W-linked gene CHD1W (females) and Z-linked gene CHD1Z (both sexes) are amplified.
RNA isolation
Total RNA was isolated using the Micro-to-Midi Total RNA Purification System (Invitrogen, Carlsbad, CA). Any contaminating genomic DNA was digested by DNase treatment (DNA-free, Ambion, Austin, USA), according to the manufacturer's recommendations. RNA quality was checked using the Agilent 2100 Bioanalyzer and the RNA 6000 LabChip (Agilent Technologies, Palo Alto, CA, USA). Only high quality RNA, with no signs of degradation, was used for further experiments.
Microarrays
Spotted cDNA microarrays, containing 1,136 expressed-sequence-tag (EST) clones from a cDNA library of developing chicken brain [9] and 12,771 EST clones from four cDNA libraries from brain and testis of White Leghorn and Red Jungle Fowl [10], spotted in duplicate, were purchased from the Royal Institute of Technology, Stockholm, Sweden [61]. Annotation and chromosome localization of the spotted clones can be found at the Stockholm Bioinformatics Center (SBC) [62].
Experimental design
Four microarray hybridizations were done for each embryonic stage (ed4, 6, 8 and 10), addressing biological and technical variation through a pooling and dye reversal strategy (Figure 1A). Equal amounts of total RNA extracted from eight male and eight female individual embryos were mixed in four pools with RNA from 4 embryos of the same sex in each pool.
This design, which we adopted from Churchill [63], is a trade-off between the need for biological and technical replication while keeping down animal consumption and microarray use. Although pooling is intended to average between individuals there is a risk that single individuals may bias the sample. Individual variation among the embryos included in the pools was addressed in the PCR analysis (see below), and was found to be relatively modest for the randomly selected individuals assayed (see Additional File 3). Moreover, four additional microarray hybridizations were done for ed10, using an alternative design (Figure 1B) in which all samples were derived from individual embryos and using other embryos than in the pooling strategy.
cDNA synthesis and microarray hybridization
Labeling of cDNA for microarray hybridization was done using the 3DNA Array 350 Expression Array Detection Kit (Genisphere Inc., Hatfield, PA) according to the manufacturer's protocol and recommendations. Briefly, total RNA (20 μg) was oligo-dT-primed with Cy3- or Cy5-capture-sequence primer (see Figure 1 for dye reversal scheme), and reverse transcribed using SuperScript II Reverse Transcriptase (Invitrogen, Carlsbad, CA). For cDNA hybridization, 5 μg cDNA was mixed with 1 μl mouse COT-1 DNA and either regular (ed8 and ed10S) or Enhanced (ed4, ed6, ed10) hybridization buffer. After hybridization at 60°C for 16 hours, microarray slides were washed on a rocking platform, first with 2 × SSC containing 0.2% SDS for 10 min at 55°C, followed by 2 × SSC and 0.2 × SSC for 10 min each at room temperature. 3DNA hybridization was performed at 60°C for 2.5 hours, followed by washes as for the cDNA hybridization.
Microarray data analysis
The microarrays were scanned with a GenePix 4000B scanner (Axon, Foster City, CA) at 10 μm resolution. The photomultiplier tube voltage settings were varied to obtain maximum signal intensities while saturating less than 0.1% of the spots. Images were analyzed with the GenePix Pro 5.0 (Axon) software, utilizing the option to find irregular features. Spots with visible artifacts or containing fewer than 35 pixels were manually flagged as bad. As each array contained the same clone spotted in duplicate in each half of the array, the average of the two duplicate spots was calculated for each array. If one of the duplicate spots was missing or flagged bad, the value was based only on the remaining spot. The base 2 logarithm (log2) ratio of the median spot intensity for each channel was used to quantify the fold difference in relative gene expression levels. Since all arrays had low background, no background subtraction was done. To remove systematic sources of variation, within-print-group loess normalization [64] was done, in which the relative weight of 0.1 was given to spots flagged as missing or bad. To identify clones differentially expressed between females and males independently of embryonic stage (ed4, 6, 8 or 10), tissue origin (brain or whole head), or experimental design (pools or individuals; see above), the arrays were collapsed across these parameters, resulting in 12 biologically independent samples per gender analyzed on 20 arrays.
Clones for which values were obtained for less than 17 (out of 20) arrays were excluded from further analysis, resulting in 10,792 clones across all arrays. In addition, 90 of the microarray clones known from previous RepeatMasker analysis to mainly consist of repetitive sequence were excluded from further analysis. The moderated t-statistics and log-odds of differential expression was calculated using the Limma package version 2.0.4 [17] in the statistical software R version 2.2.1 [65] (both freely available). To address the problem with multiple testing, the p-values were adjusted using the method of Benjamini and Hochberg [18]. Because of the technical replication of the pooled samples (Figure 1A), only 12 arrays (not all 20) were independent measurements. We only considered clones to be differentially expressed if the adjusted p-value < 0.0005. Microarray data are available in the ArrayExpress database [66] at the accession number E-MEXP-266.
Annotation of EST clones detecting differential expression
We reevaluated gene identities for all differentially expressed EST clones (146 clones; see Results) by searching The Institute of Genomic Research (TIGR) Chicken Gene Indices (Release 10.0) [67]. All sequences can be accessed by using the clone identity in a search against GenBank database [68]. Functional annotations were reassessed by RepeatMasker [69] and searching the National Center for Biotechnology Information (NCBI) non-redundant and the Universal Protein Resource (UniProt) databases [70,71]. The RepeatMasker program screens nucleotide sequences against a library of repetitive elements such as interspersed repeats and low complexity DNA sequences. We discarded sequences with more than 10% repetitive sequence.
Chromosomal localizations in the released chicken genome [11] were reinvestigated using the BLAST-like Alignment Tool (BLAT) [72] and the University of California Santa Clara (UCSC) Genome Browser [73]. Designating functionality to chicken gene products is complicated by the limited knowledge of the avian genome or proteome. Assuming that well conserved protein regions and domains reflect similar protein functionality, cross-species comparisons of several gene products (see Additional Files 5, 6, 7) were done using data from the USCS genome browser, the Ensembl genome browser [74], TIGR chicken gene indices [75], the Pfam [76] and UniProt databases in combination with the BLAST2 (default parameters) [77]. The figures in Additional Files 4 and 5 show sequence similarity and Pfam domains for several of the gene products mentioned in the discussion. Pfam is a database of multiple alignments of protein domains or conserved protein regions [78]. The thicker boxes represent Pfam A domains which are based on manually crafted accurate multiple protein alignments, whereas the multiple colored thinner boxes represent Pfam B domains based on an automatic clustering of a nonredundant protein database.
Real-time PCR
To confirm the identity as well as the differential expression of selected genes, samples derived from five individual embryos of each sex (randomly selected among the eight that had been pooled for microarray analysis) on ed4 (and, for some genes, ed8) were subjected to real-time PCR. Primers were designed with Primer Express software (Applied Biosystems, Palo Alto, CA, USA), using default settings for the TaqMan mode, and ordered from DNA Technology A/S (Aarhus, Denmark). Primers were designed for amplicons to span exon-exon borders when possible, as determined by the alignment of EST sequences against the chicken genome (see above). Primer sequences are given in Table 6. Primers amplifying the endogenous reference 18S ribosomal RNA were from TaqMan® Ribosomal RNA Control Reagents (Applied Biosystems). For PCR, 2 μg total RNA was reverse transcribed in a final volume of 100 μl using TaqMan Reverse Transcription Reagents (Applied Biosystems) with random hexamer primers according to manufacturer instructions. Reactions excluding MultiScribe Reverse Transcriptase (Applied Biosystems) were performed as negative controls. cDNA targets at a 100-fold (for target genes) or 10,000-fold (for endogenous reference) final dilution were amplified in replicate wells (four for target genes and six for endogenous reference), using primer concentration 250 nM (reverse and forward primer) for target genes and 50 nM for 18S, respectively, in 1× qPCR Mastermix Plus for SYBR Green I (Eurogentec, Seraing, Belgium) in an ABI Prism 7000 Sequence Detector System (Applied Biosystems) with the following thermal profile: 50°C for 2 min, 95°C for 10 min, followed by 40 cycles of 15 sec at 95°C and 1 min at 60°C in a volume of 25 μl. PCR products were checked by monitoring melting curves. Standard curves for each gene were obtained by amplifying (in quadruplicate) a four-fold dilution series of 1:50 through 1:12,800 final volume of a reference mixture containing equal amounts of cDNA from all ten individual samples. For each gene, after removing one outlying value (leaving three values for target genes and five for endogenous reference), a mean normalized gene expression (MNE) was calculated according to Muller et al [79]:
Table 6.
Primer sequences
| Gene | Amplicon (nt) | Forward (5'-3') | Reverse (3'-5') |
| AATF | 64 | TTACCGCTCACTGTTTGGAAGA | TCCCGGATGCCAACCA |
| ACAA2 | 76 | TCTGGTTTCCAGTCCATTGCT | CTCCACCACACAGAACCACTTC |
| ACAD8 | 70 | CATGGCCAAGCTGTTTGCTA | GCCCCCGTGCATCTGTAG |
| ANXA1 | 78 | TGAATGATGATCTTGCTGACAATG | CGTTAACATCCGTCCCTTTCC |
| BTF2-P44 | 85 | CCTCCACCTGCCAGTTCAAC | CCTGGTCAGAAAGGGAAGCA |
| CAT1 | 71 | CACGCTGATGGTGCCCTACT | AGCCCACCGCCTTGAAAG |
| CCNH | 73 | AACCGAAAGTTTCGCAGCAA | GGGCCTCCAGCAGGAAAG |
| CDK7 | 78 | GGGACAGATCGTGGCTATCAAA | TGAGAGCTGTTCTGTTGATTCCA |
| CETN3 | 77 | GAAATACTCAAGGCGTTCAAATTGT | GCAACCCGACGCAGGTT |
| CEZANNE2 | 67 | CCACAACTGGTGATGGAAACTG | CGGTCATGAAATCCCCACAT |
| CEZANNE2 e! | 69 | GGCCACAACTGGTGATGGA | CGGTCATGAAATCCCCACAT |
| CLA | 51 | GTAAGTGGAGAGAGGAGCAAAAGG | AGTTTGCATCAAGCTGCTCAAG |
| CX3CR | 74 | CACCGTGTCTGCTTCAAGTACTG | TATGTGCGGACGTCATAATGATT |
| DHFR | 79 | ATGGGCATCGGGAAGGA | TGCTGGTCATTCTCTGGAAGTACT |
| DMRT1 | 81 | GAAGCCTCCCAGCAACATACA | CATGGCATGGCGGTTCTC |
| HERP1/HEY2 | 68 | GCGACCGGAGGTAAAGGTTATT | CGGAAGCCAATGCTCATAAAA |
| HINT | 77 | ATATTCTGGGAGGTCGTCAGTTG | TTGTACACATGCAGCATCTCTTGT |
| HMGCOA | 84 | GAAGAAAATAAACCAAACCCTGTAACA | GCGACTGTGTGCATGAACAAG |
| MAT1 | 62 | CCCCTCCCTGAAGCTGATG | GCTCCACGCAGCTCTCACA |
| MHM array clone | 76 | CAACAGCACTACTGGAGCCATATG | GGAAGCCCCTGCAAAGAAG |
| MHM GenBank | 69 | GAAATGCCTCGCCCTTTAAGT | TGACTGCCCTTGGTTGTCTGT |
| MRPL3 | 72 | GAGTTGGTGTTGTTGCGGTAA | TGACAGCGTGCTTCTTTCCT |
| NAT5 | 51 | CTGACGGAGACCTACGGCAT | CCAGTGTGCCAGGTACTGCA |
| P311 | 75 | TCATGGTTTCCTTGTGGTAAGTGA | TCCAAAATAGCACCATTCATCAGT |
| PRTD-NY3 | 68 | TCACACGGTCTCCATACCTCAA | CCGACAGCCTGCCATCTC |
| RJA094A01 | 74 | GGGAGGGTGGATCTGTGACA | ACAGCCCTTCCCGTAAAAGAG |
| SMAD2 | 51 | AGTGGGACACAACAGGCCTT | CGAGAGATCTGGTTTGTTCAGAGAA |
| SOLT | 61 | TTATTAGGAGAAGAAGAGTTGCAGAAAG | CTGCTGACAGCACCATTTCAA |
| SPINW | 102 | CTGTTCAAGAATAAATAGAATCACAATGG | TTCAGTCCTCACATAGTCCAACTTAGTT |
| SPINZ | 101 | CCAAGTTCCTGTAAATCCCTCTCTT | CAAGCGCAGAAACTCTTTCATCT |
| TINP1 | 77 | AAGCTGGGAAATGGGAGGTT | AAGCTGGGAAATGGGAGGTT |
| TXN | 72 | TGATGTGGTGTTCATTGAAATTGA | GGCATGCACTTCACATCACAGT |
| UBE2R2 | 76 | CCAAAGCTGAGGCAGAAAAGG | GGCACTTTAGTTTTGATGCAGTACTC |
| WLA084D05/ABWT | 72 | TGGGATGGCTGCATGTGTA | AACCCCGCCACTGGTATTC |
| WPKCI-8 | 51 | AGATTGTGGCGCACCTCTTC | CACTTCTCGCCAACAATCATCA |
| ZNF216 | 67 | GCCCCGGCCCCATT | GCATTAAAACTACAGAATCCTCTTTGC |
| ZO-2 | 83 | CCTTTTCTTCCCCTTTTATTAATGCT | TCTGTTGCATCAAGTTTATCTCCTAGA |
| ZOV3 | 86 | CGATACCTGCCTCCAGTGTGT | GAGGAACAGACCTATTTACAAACTGAAA |
Etarget and Eref denote the efficiency, and CTtarget and CTref the threshold cycle (CT) of the target and reference gene, respectively, in the PCR amplification. PCR data for each gene are reported in Tables 3, 4, 5 (also see Additional File 3). An un-paired Student's t-test, using the MNE values, was used to determine a statistically significant difference between the genders (p < 0.05) for each gene. The comparative Ct method [80] was used to calculate the average relative log2 fold difference between males and females for each gene.
List of abbreviations
ABWT, Avian brain W-linked transcript
BLAT, BLAST-like alignment tool
e!, ensemble genome browser
ed, embryonic day
EST, Expressed sequence tag
F, Female
Female genes, genes more highly expressed in females
CAK, Cyclin-dependent kinase activating kinase
Gg, Gallus gallus
HIT, histidine triad motif
Hs, Homo sapiens
M, Male
Male genes, genes more highly expressed in males
MHM, Male hypermethylated
Mm, Mus musculus
MNE, Mean normalized expression
Sc, Saccharomyces
TFIIH, Transcription factor II H
UCSC, University of California Santa Cruz
Xl, Xenopus leavis
Xt, Xenopus tropicalis
Authors' contributions
All authors conceived and designed the experiments, but KK designed the microarray study. AM performed the experiment related to the animal material. KK, BS and non-authors (see Acknowledgments) carried out the microarray and PCR analysis. BS and KK analyzed the data. BB and LD contributed reagents, materials, and analysis tools. BS, KK and MS drafted the manuscript with significant contributions from all authors. All authors read and approved the final manuscript.
Supplementary Material
Expression profile for microarray genes. Expression profile for microarray genes more highly expressed in males according to the chromosomal localization.
Differentially expressed clones. Excel sheet showing annotations and expression data for all 146 differentially expressed clones.
Graphs of PCR results. The average mean normalized expression (MNE) for females (red) and males (blue) of selected gene (listed alphabetically) on ed4 and/or ed8, analyzed by real-time PCR (n = 5). Error bars indicate standard error of the mean. For calculations, see Methods.
Alignment of ABWT. A. UCSC genome browser window showing the alignment of ABWT and three additional annotation tracks. 'Non-Chicken RefSeq Genes' shows the alignment of non-chicken RefSeq sequences for Ube2r2 from mouse (Mus musculus) and zebrafish (Danio rerio). 'Chicken mRNAs from GenBank' describes the alignment of additional chicken mRNAs in this region. 'Repeating Elements by RepeatMasker ' shows the parts of the genome region masked for repetitive sequences. This UCSC Genome Browser window can be accessed by searching with 'chrW_random:175,450-180,581' on the UCSC chicken genome browser site [19]. B. Alignment data for ABWT against the chicken genome.
Species comparisons of the UBE2R2 protein. Species comparison between chicken (Gg), human (Hs), mouse (Mm), Xenopus leavis/tropicalis (Xl/Xt) and Saccharomyces cerevisiae (Sc) of the UBE2R2 protein using the protein sequences listed in additional file 7. A comparison between Pfam domains (representing protein domains or conserved protein regions) and the number of positive amino acid matches against the chicken sequence is shown (see Methods).
Species comparisons of proteins associated with TFIIH complex. Species comparison between chicken (Gg), human (Hs), mouse (Mm), Xenopus leavis/tropicalis (Xl/Xt) and Saccharomyces cerevisiae (Sc) of TFIIH proteins using the protein sequences listed in additional file 7. A comparison between Pfam domains (representing protein domains or conserved protein regions) and the number of positive amino acid matches against the chicken sequence is shown (see Methods).
Species comparisons of proteins associated with TFIIH complex. List of the protein identities used in Additional Files 5 and 6.
Acknowledgments
Acknowledgements
We want to thank Professor Leif Andersson and the KTH Microarray Resource Center for providing the chicken cDNA arrays. Dr Peter Savolainen at the KTH Microarray Resource Center is thanked for valuable discussions concerning the quality of the spotted microarrays and for sequencing cDNA clones. Raili Engdahl and Lena Norgren are acknowledged for excellent technical assistance. This work was supported by the Swedish EPA (the ReproSafe program) and the Swedish Research Council for Environment, Agricultural Sciences and Spatial Planning (Formas).
Contributor Information
Birger Scholz, Email: Birger.Scholz@farmbio.uu.se.
Kim Kultima, Email: Kim.Kultima@farmbio.uu.se.
Anna Mattsson, Email: Anna.Mattsson@ebc.uu.se.
Jeanette Axelsson, Email: Jeanette.Axelsson@ebc.uu.se.
Björn Brunström, Email: Bjorn.Brunstrom@ebc.uu.se.
Krister Halldin, Email: krister.halldin@imm.ki.se.
Michael Stigson, Email: Michael.Stigson@farmbio.uu.se.
Lennart Dencker, Email: Lennart.Dencker@farmbio.uu.se.
References
- Morris JA, Jordan CL, Breedlove SM. Sexual differentiation of the vertebrate nervous system. Nat Neurosci. 2004;7:1034–1039. doi: 10.1038/nn1325. [DOI] [PubMed] [Google Scholar]
- Schantz SL, Widholm JJ. Cognitive effects of endocrine-disrupting chemicals in animals. Environ Health Perspect. 2001;109:1197–1206. doi: 10.1289/ehp.011091197. [DOI] [PMC free article] [PubMed] [Google Scholar]
- Arnold AP, Gorski RA. Gonadal steroid induction of structural sex differences in the central nervous system. Annu Rev Neurosci. 1984;7:413–442. doi: 10.1146/annurev.ne.07.030184.002213. [DOI] [PubMed] [Google Scholar]
- MacLusky NJ, Naftolin F. Sexual differentiation of the central nervous system. Science. 1981;211:1294–1302. doi: 10.1126/science.6163211. [DOI] [PubMed] [Google Scholar]
- Dennis C. Brain development: the most important sexual organ. Nature. 2004;427:390–392. doi: 10.1038/427390a. [DOI] [PubMed] [Google Scholar]
- Arnold AP. Sex chromosomes and brain gender. Nat Rev Neurosci. 2004;5:701–708. doi: 10.1038/nrn1494. [DOI] [PubMed] [Google Scholar]
- Agate RJ, Grisham W, Wade J, Mann S, Wingfield J, Schanen C, Palotie A, Arnold AP. Neural, not gonadal, origin of brain sex differences in a gynandromorphic finch. Proc Natl Acad Sci U S A. 2003;100:4873–4878. doi: 10.1073/pnas.0636925100. [DOI] [PMC free article] [PubMed] [Google Scholar]
- Halldin K, Axelsson J, Brunstrom B. Effects of endocrine modulators on sexual differentiation and reproductive function in male Japanese quail. Brain Res Bull. 2005;65:211–218. doi: 10.1016/j.brainresbull.2004.11.020. [DOI] [PubMed] [Google Scholar]
- Boardman PE, Sanz-Ezquerro J, Overton IM, Burt DW, Bosch E, Fong WT, Tickle C, Brown WR, Wilson SA, Hubbard SJ. A comprehensive collection of chicken cDNAs. Curr Biol. 2002;12:1965–1969. doi: 10.1016/S0960-9822(02)01296-4. [DOI] [PubMed] [Google Scholar]
- Savolainen P, Fitzsimmons C, Arvestad L, Andersson L, Lundeberg J. ESTs from brain and testis of White Leghorn and red junglefowl: annotation, bioinformatic classification of unknown transcripts and analysis of expression levels. To appear in Cytogenetic and Genome Research. doi: 10.1159/000085674. [DOI] [PubMed] [Google Scholar]
- Hillier LW, Miller W, Birney E, Warren W, Hardison RC, Ponting CP, Bork P, Burt DW, Groenen MA, Delany ME, Dodgson JB, Chinwalla AT, Cliften PF, Clifton SW, Delehaunty KD, Fronick C, Fulton RS, Graves TA, Kremitzki C, Layman D, Magrini V, McPherson JD, Miner TL, Minx P, Nash WE, Nhan MN, Nelson JO, Oddy LG, Pohl CS, Randall-Maher J, Smith SM, Wallis JW, Yang SP, Romanov MN, Rondelli CM, Paton B, Smith J, Morrice D, Daniels L, Tempest HG, Robertson L, Masabanda JS, Griffin DK, Vignal A, Fillon V, Jacobbson L, Kerje S, Andersson L, Crooijmans RP, Aerts J, van der Poel JJ, Ellegren H, Caldwell RB, Hubbard SJ, Grafham DV, Kierzek AM, McLaren SR, Overton IM, Arakawa H, Beattie KJ, Bezzubov Y, Boardman PE, Bonfield JK, Croning MD, Davies RM, Francis MD, Humphray SJ, Scott CE, Taylor RG, Tickle C, Brown WR, Rogers J, Buerstedde JM, Wilson SA, Stubbs L, Ovcharenko I, Gordon L, Lucas S, Miller MM, Inoko H, Shiina T, Kaufman J, Salomonsen J, Skjoedt K, Wong GK, Wang J, Liu B, Yu J, Yang H, Nefedov M, Koriabine M, Dejong PJ, Goodstadt L, Webber C, Dickens NJ, Letunic I, Suyama M, Torrents D, von Mering C, Zdobnov EM, Makova K, Nekrutenko A, Elnitski L, Eswara P, King DC, Yang S, Tyekucheva S, Radakrishnan A, Harris RS, Chiaromonte F, Taylor J, He J, Rijnkels M, Griffiths-Jones S, Ureta-Vidal A, Hoffman MM, Severin J, Searle SM, Law AS, Speed D, Waddington D, Cheng Z, Tuzun E, Eichler E, Bao Z, Flicek P, Shteynberg DD, Brent MR, Bye JM, Huckle EJ, Chatterji S, Dewey C, Pachter L, Kouranov A, Mourelatos Z, Hatzigeorgiou AG, Paterson AH, Ivarie R, Brandstrom M, Axelsson E, Backstrom N, Berlin S, Webster MT, Pourquie O, Reymond A, Ucla C, Antonarakis SE, Long M, Emerson JJ, Betran E, Dupanloup I, Kaessmann H, Hinrichs AS, Bejerano G, Furey TS, Harte RA, Raney B, Siepel A, Kent WJ, Haussler D, Eyras E, Castelo R, Abril JF, Castellano S, Camara F, Parra G, Guigo R, Bourque G, Tesler G, Pevzner PA, Smit A, Fulton LA, Mardis ER, Wilson RK. Sequence and comparative analysis of the chicken genome provide unique perspectives on vertebrate evolution. Nature. 2004;432:695–716. doi: 10.1038/nature03154. [DOI] [PubMed] [Google Scholar]
- Bruggeman V, Van As P, Decuypere E. Developmental endocrinology of the reproductive axis in the chicken embryo. Comp Biochem Physiol A Mol Integr Physiol. 2002;131:839–846. doi: 10.1016/S1095-6433(02)00022-3. [DOI] [PubMed] [Google Scholar]
- Smith CA, Sinclair AH. Sex determination: insights from the chicken. Bioessays. 2004;26:120–132. doi: 10.1002/bies.10400. [DOI] [PubMed] [Google Scholar]
- Andrews JE, Smith CA, Sinclair AH. Sites of Estrogen Receptor and Aromatase Expression in the Chicken Embryo. General and Comparative Endocrinology. 1997;108:182–190. doi: 10.1006/gcen.1997.6978. [DOI] [PubMed] [Google Scholar]
- Nishikimi H, Kansaku N, Saito N, Usami M, Ohno Y, Shimada K. Sex differentiation and mRNA expression of P450c17, P450arom and AMH in gonads of the chicken. Mol Reprod Dev. 2000;55:20–30. doi: 10.1002/(SICI)1098-2795(200001)55:1<20::AID-MRD4>3.0.CO;2-E. [DOI] [PubMed] [Google Scholar]
- Nomura O, Nakabayashi O, Nishimori K, Yasue H, Mizuno S. Expression of five steroidogenic genes including aromatase gene at early developmental stages of chicken male and female embryos. J Steroid Biochem Mol Biol. 1999;71:103–109. doi: 10.1016/S0960-0760(99)00127-2. [DOI] [PubMed] [Google Scholar]
- Smyth GK. Linear models and empirical Bayes methods for assessing differential expression in microarray experiments. Statistical Applications in Genetics and Molecular Biology. 2004;3:Article 3.. doi: 10.2202/1544-6115.1027. [DOI] [PubMed] [Google Scholar]
- Benjamini Y, Hochberg Y. Controlling the false discovery rate: a practical and powerful approach to multiple testing. Journal of the Royal Statistical Society Series B. 1995;57:289–300. [Google Scholar]
- UCSC (University of California Santa Cruz) genome browser. http://genome.ucsc.edu/cgi-bin/hgGateway/ [DOI] [PMC free article] [PubMed]
- Teranishi M, Shimada Y, Hori T, Nakabayashi O, Kikuchi T, Macleod T, Pym R, Sheldon B, Solovei I, Macgregor H, Mizuno S. Transcripts of the MHM region on the chicken Z chromosome accumulate as non-coding RNA in the nucleus of female cells adjacent to the DMRT1 locus. Chromosome Res. 2001;9:147–165. doi: 10.1023/A:1009235120741. [DOI] [PubMed] [Google Scholar]
- Kamata R, Takahashi S, Morita M. Gene expression of sex-determining factors and steroidogenic enzymes in the chicken embryo: influence of xenoestrogens. Gen Comp Endocrinol. 2004;138:148–156. doi: 10.1016/j.ygcen.2004.05.011. [DOI] [PubMed] [Google Scholar]
- Arnold AP. The gender of the voice within: the neural origin of sex differences in the brain. Current Opinion in Neurobiology. 2003;13:759–764. doi: 10.1016/j.conb.2003.10.005. [DOI] [PubMed] [Google Scholar]
- Dewing P, Shi T, Horvath S, Vilain E. Sexually dimorphic gene expression in mouse brain precedes gonadal differentiation. Brain Res Mol Brain Res. 2003;118:82–90. doi: 10.1016/S0169-328X(03)00339-5. [DOI] [PubMed] [Google Scholar]
- Fridolfsson AK, Cheng H, Copeland NG, Jenkins NA, Liu HC, Raudsepp T, Woodage T, Chowdhary B, Halverson J, Ellegren H. Evolution of the avian sex chromosomes from an ancestral pair of autosomes. PNAS. 1998;95:8147–8152. doi: 10.1073/pnas.95.14.8147. [DOI] [PMC free article] [PubMed] [Google Scholar]
- Ellegren H. Dosage compensation: do birds do it as well? Trends in Genetics. 2002;18:25–28. doi: 10.1016/S0168-9525(01)02553-7. [DOI] [PubMed] [Google Scholar]
- Kuroda Y, Arai N, Arita M, Teranishi M, Hori T, Harata M, Mizuno S. Absence of Z-chromosome inactivation for five genes in male chickens. Chromosome Res. 2001;9:457–468. doi: 10.1023/A:1011672227256. [DOI] [PubMed] [Google Scholar]
- Kuroiwa A, Yokomine T, Sasaki H, Tsudzuki M, Tanaka K, Namikawa T, Matsuda Y. Biallelic expression of Z-linked genes in male chickens. Cytogenet Genome Res. 2002;99:310–314. doi: 10.1159/000071609. [DOI] [PubMed] [Google Scholar]
- McQueen HA, McBride D, Miele G, Bird AP, Clinton M. Dosage compensation in birds. Curr Biol. 2001;11:253–257. doi: 10.1016/S0960-9822(01)00070-7. [DOI] [PubMed] [Google Scholar]
- Bisoni L, Batlle-Morera L, Bird AP, Suzuki M, McQueen HA. Female-specific hyperacetylation of histone H4 in the chicken Z chromosome. Chromosome Res. 2005;13:205–214. doi: 10.1007/s10577-005-1505-4. [DOI] [PubMed] [Google Scholar]
- Raymond CS, Shamu CE, Shen MM, Seifert KJ, Hirsch B, Hodgkin J, Zarkower D. Evidence for evolutionary conservation of sex-determining genes. Nature. 1998;391:691–695. doi: 10.1038/35618. [DOI] [PubMed] [Google Scholar]
- Raymond CS, Parker ED, Kettlewell JR, Brown LG, Page DC, Kusz K, Jaruzelska J, Reinberg Y, Flejter WL, Bardwell VJ, Hirsch B, Zarkower D. A region of human chromosome 9p required for testis development contains two genes related to known sexual regulators. Hum Mol Genet. 1999;8:989–996. doi: 10.1093/hmg/8.6.989. [DOI] [PubMed] [Google Scholar]
- Smith CA, McClive PJ, Western PS, Reed KJ, Sinclair AH. Conservation of a sex-determining gene. Nature. 1999;402:601–602. doi: 10.1038/45130. [DOI] [PubMed] [Google Scholar]
- Kettlewell JR, Raymond CS, Zarkower D. Temperature-dependent expression of turtle Dmrt1 prior to sexual differentiation. Genesis. 2000;26:174–178. doi: 10.1002/(SICI)1526-968X(200003)26:3<174::AID-GENE2>3.0.CO;2-J. [DOI] [PubMed] [Google Scholar]
- Guan G, Kobayashi T, Nagahama Y. Sexually dimorphic expression of two types of DM (Doublesex/Mab-3)-domain genes in a teleost fish, the Tilapia (Oreochromis niloticus) Biochem Biophys Res Commun. 2000;272:662–666. doi: 10.1006/bbrc.2000.2840. [DOI] [PubMed] [Google Scholar]
- Shibata K, Takase M, Nakamura M. The Dmrt1 expression in sex-reversed gonads of amphibians. Gen Comp Endocrinol. 2002;127:232–241. doi: 10.1016/S0016-6480(02)00039-4. [DOI] [PubMed] [Google Scholar]
- Raymond CS, Kettlewell JR, Hirsch B, Bardwell VJ, Zarkower D. Expression of Dmrt1 in the genital ridge of mouse and chicken embryos suggests a role in vertebrate sexual development. Dev Biol. 1999;215:208–220. doi: 10.1006/dbio.1999.9461. [DOI] [PubMed] [Google Scholar]
- Shan Z, Nanda I, Wang Y, Schmid M, Vortkamp A, Haaf T. Sex-specific expression of an evolutionarily conserved male regulatory gene, DMRT1, in birds. Cytogenet Cell Genet. 2000;89:252–257. doi: 10.1159/000015626. [DOI] [PubMed] [Google Scholar]
- Hori T, Asakawa S, Itoh Y, Shimizu N, Mizuno S. Wpkci, encoding an altered form of PKCI, is conserved widely on the avian W chromosome and expressed in early female embryos: implication of its role in female sex determination. Mol Biol Cell. 2000;11:3645–3660. doi: 10.1091/mbc.11.10.3645. [DOI] [PMC free article] [PubMed] [Google Scholar]
- O'Neill M, Binder M, Smith C, Andrews J, Reed K, Smith M, Millar C, Lambert D, Sinclair A. ASW: a gene with conserved avian W-linkage and female specific expression in chick embryonic gonad. Dev Genes Evol. 2000;210:243–249. doi: 10.1007/s004270050310. [DOI] [PubMed] [Google Scholar]
- Pace HC, Brenner C. Feminizing chicks: a model for avian sex determination based on titration of Hint enzyme activity and the predicted structure of an Asw-Hint heterodimer. Genome Biol. 2003;4:R18. doi: 10.1186/gb-2003-4-3-r18. [DOI] [PMC free article] [PubMed] [Google Scholar]
- Wade J, Peabody C, Coussens P, Tempelman RJ, Clayton DF, Liu L, Arnold AP, Agate R. A cDNA microarray from the telencephalon of juvenile male and female zebra finches. J Neurosci Methods. 2004;138:199–206. doi: 10.1016/j.jneumeth.2004.04.007. [DOI] [PubMed] [Google Scholar]
- Chen D, Riedl T, Washbrook E, Pace PE, Coombes RC, Egly JM, Ali S. Activation of estrogen receptor alpha by S118 phosphorylation involves a ligand-dependent interaction with TFIIH and participation of CDK7. Mol Cell. 2000;6:127–137. doi: 10.1016/S1097-2765(00)00014-9. [DOI] [PubMed] [Google Scholar]
- Talukder AH, Mishra SK, Mandal M, Balasenthil S, Mehta S, Sahin AA, Barnes CJ, Kumar R. MTA1 Interacts with MAT1, a Cyclin-dependent Kinase-activating Kinase Complex Ring Finger Factor, and Regulates Estrogen Receptor Transactivation Functions. J Biol Chem. 2003;278:11676–11685. doi: 10.1074/jbc.M209570200. [DOI] [PubMed] [Google Scholar]
- Lee DK, Duan HO, Chang C. From androgen receptor to the general transcription factor TFIIH. Identification of cdk activating kinase (CAK) as an androgen receptor NH(2)-terminal associated coactivator. J Biol Chem. 2000;275:9308–9313. doi: 10.1074/jbc.275.13.9308. [DOI] [PubMed] [Google Scholar]
- Ito S, Takeyama K, Yamamoto A, Sawatsubashi S, Shirode Y, Kouzmenko A, Tabata T, Kato S. In vivo potentiation of human oestrogen receptor alpha by Cdk7-mediated phosphorylation. Genes Cells. 2004;9:983–992. doi: 10.1111/j.1365-2443.2004.00777.x. [DOI] [PubMed] [Google Scholar]
- Larochelle S, Pandur J, Fisher RP, Salz HK, Suter B. Cdk7 is essential for mitosis and for in vivo Cdk-activating kinase activity. Genes Dev. 1998;12:370–381. doi: 10.1101/gad.12.3.370. [DOI] [PMC free article] [PubMed] [Google Scholar]
- Matt Kim J, McGaughy JT, Kent Bogle R, Ravnik SE. Meiotic Expression of the Cyclin H/Cdk7 Complex in Male Germ Cells of the Mouse. Biol Reprod. 2001;64:1400–1408. doi: 10.1095/biolreprod64.5.1400. [DOI] [PubMed] [Google Scholar]
- Wallenfang MR, Seydoux G. cdk-7 Is required for mRNA transcription and cell cycle progression in Caenorhabditis elegans embryos. Proc Natl Acad Sci U S A. 2002;99:5527–5532. doi: 10.1073/pnas.082618399. [DOI] [PMC free article] [PubMed] [Google Scholar]
- Brenner C. Hint, Fhit, and GalT: function, structure, evolution, and mechanism of three branches of the histidine triad superfamily of nucleotide hydrolases and transferases. Biochemistry. 2002;41:9003–9014. doi: 10.1021/bi025942q. [DOI] [PMC free article] [PubMed] [Google Scholar]
- Mosesso P, Piane M, Palitti F, Pepe G, Penna S, Chessa L. The novel human gene aprataxin is directly involved in DNA single-strand-break repair. Cell Mol Life Sci. 2005;62:485–491. doi: 10.1007/s00018-004-4441-0. [DOI] [PubMed] [Google Scholar]
- Gueven N, Becherel OJ, Kijas AW, Chen P, Howe O, Rudolph JH, Gatti R, Date H, Onodera O, Taucher-Scholz G, Lavin MF. Aprataxin, a novel protein that protects against genotoxic stress. Hum Mol Genet. 2004;13:1081–1093. doi: 10.1093/hmg/ddh122. [DOI] [PubMed] [Google Scholar]
- Bieganowski P, Garrison PN, Hodawadekar SC, Faye G, Barnes LD, Brenner C. Adenosine monophosphoramidase activity of Hint and Hnt1 supports function of Kin28, Ccl1, and Tfb3. J Biol Chem. 2002;277:10852–10860. doi: 10.1074/jbc.M111480200. [DOI] [PMC free article] [PubMed] [Google Scholar]
- Melo J, Toczyski D. A unified view of the DNA-damage checkpoint. Current Opinion in Cell Biology. 2002;14:237–245. doi: 10.1016/S0955-0674(02)00312-5. [DOI] [PubMed] [Google Scholar]
- Peltomaki P. DNA mismatch repair and cancer. Mutation Research/Reviews in Mutation Research. 2001;488:77–85. doi: 10.1016/S1383-5742(00)00058-2. [DOI] [PubMed] [Google Scholar]
- Trimble JJ, Murthy SC, Bakker A, Grassmann R, Desrosiers RC. A gene for dihydrofolate reductase in a herpesvirus. Science. 1988;239:1145–1147. doi: 10.1126/science.2830673. [DOI] [PubMed] [Google Scholar]
- Itoh Y, Hori T, Saitoh H, Mizuno S. Chicken spindlin genes on W and Z chromosomes: transcriptional expression of both genes and dynamic behavior of spindlin in interphase and mitotic cells. Chromosome Res. 2001;9:283–299. doi: 10.1023/A:1016694513051. [DOI] [PubMed] [Google Scholar]
- Semplici F, Meggio F, Pinna LA, Oliviero S. CK2-dependent phosphorylation of the E2 ubiquitin conjugating enzyme UBC3B induces its interaction with beta-TrCP and enhances beta-catenin degradation. Oncogene. 2002;21:3978–3987. doi: 10.1038/sj.onc.1205574. [DOI] [PubMed] [Google Scholar]
- Balthazart J, Tlemcani O, Ball GF. Do sex differences in the brain explain sex differences in the hormonal induction of reproductive behavior? What 25 years of research on the Japanese quail tells us. Horm Behav. 1996;30:627–661. doi: 10.1006/hbeh.1996.0066. [DOI] [PubMed] [Google Scholar]
- Panzica GC, Viglietti-Panzica C, Balthazart J. The sexually dimorphic medial preoptic nucleus of quail: a key brain area mediating steroid action on male sexual behavior. Front Neuroendocrinol. 1996;17:51–125. doi: 10.1006/frne.1996.0002. [DOI] [PubMed] [Google Scholar]
- Fridolfsson AK, Ellegren H. A simple and universal method for molecular sexing of non-ratite birds. Journal of Avian Biology. 1999;30:116–121. [Google Scholar]
- Royal Institute of Technology (KTH) Microarray Center. http://www.biotech.kth.se/molbio/microarray/index.html/
- Stockholm Bioinformatics Center (SBC) Chicken EST identities. http://www.sbc.su.se/~arve/chicken/
- Churchill GA. Fundamentals of experimental design for cDNA microarrays. Nat Genet. 2002;32 Suppl:490–495. doi: 10.1038/ng1031. [DOI] [PubMed] [Google Scholar]
- Yang YH, Dudoit S, Luu P, Lin DM, Peng V, Ngai J, Speed TP. Normalization for cDNA microarray data: a robust composite method addressing single and multiple slide systematic variation. Nucleic Acids Res. 2002;30:e15. doi: 10.1093/nar/30.4.e15. [DOI] [PMC free article] [PubMed] [Google Scholar]
- Ihaka RGR. R: A Language for Data Analysis and Graphics. Journal of Computational and Graphical Statistics. 1996;5:299–-314. [Google Scholar]
- ArrayExpress database. http://www.ebi.ac.uk/arrayexpress/
- Quackenbush J, Cho J, Lee D, Liang F, Holt I, Karamycheva S, Parvizi B, Pertea G, Sultana R, White J. The TIGR Gene Indices: analysis of gene transcript sequences in highly sampled eukaryotic species. Nucl Acids Res. 2001;29:159–164. doi: 10.1093/nar/29.1.159. [DOI] [PMC free article] [PubMed] [Google Scholar]
- NCBI (National Center for Biotechnology Information) GenBank. http://www.ncbi.nlm.nih.gov/Genbank/index.html/
- A.F.A. Smit & P. Green Institute for Systems Biology. http://www.repeatmasker.org/cgi-bin/WEBRepeatMasker.
- Benson DA, Karsch-Mizrachi I, Lipman DJ, Ostell J, Wheeler DL. GenBank. Nucleic Acids Res. 2005;33 Database Issue:D34–8. doi: 10.1093/nar/gki063. [DOI] [PMC free article] [PubMed] [Google Scholar]
- Apweiler R, Bairoch A, Wu CH, Barker WC, Boeckmann B, Ferro S, Gasteiger E, Huang H, Lopez R, Magrane M, Martin MJ, Natale DA, O'Donovan C, Redaschi N, Yeh LSL. UniProt: the Universal Protein knowledgebase. Nucl Acids Res. 2004;32:D115–119. doi: 10.1093/nar/gkh131. [DOI] [PMC free article] [PubMed] [Google Scholar]
- Kent WJ. BLAT---The BLAST-Like Alignment Tool. Genome Res. 2002;12:656–664. doi: 10.1101/gr.229202. 10.1101/gr.229202. Article published online before March 2002. [DOI] [PMC free article] [PubMed] [Google Scholar]
- Karolchik D, Baertsch R, Diekhans M, Furey TS, Hinrichs A, Lu YT, Roskin KM, Schwartz M, Sugnet CW, Thomas DJ, Weber RJ, Haussler D, Kent WJ. The UCSC Genome Browser Database. Nucl Acids Res. 2003;31:51–54. doi: 10.1093/nar/gkg129. [DOI] [PMC free article] [PubMed] [Google Scholar]
- Hubbard T, Andrews D, Caccamo M, Cameron G, Chen Y, Clamp M, Clarke L, Coates G, Cox T, Cunningham F, Curwen V, Cutts T, Down T, Durbin R, Fernandez-Suarez XM, Gilbert J, Hammond M, Herrero J, Hotz H, Howe K, Iyer V, Jekosch K, Kahari A, Kasprzyk A, Keefe D, Keenan S, Kokocinsci F, London D, Longden I, McVicker G, Melsopp C, Meidl P, Potter S, Proctor G, Rae M, Rios D, Schuster M, Searle S, Severin J, Slater G, Smedley D, Smith J, Spooner W, Stabenau A, Stalker J, Storey R, Trevanion S, Ureta-Vidal A, Vogel J, White S, Woodwark C, Birney E. Ensembl 2005. Nucleic Acids Res. 2005;33 Database Issue:D447–53. doi: 10.1093/nar/gki138. [DOI] [PMC free article] [PubMed] [Google Scholar]
- Lee Y, Tsai J, Sunkara S, Karamycheva S, Pertea G, Sultana R, Antonescu V, Chan A, Cheung F, Quackenbush J. The TIGR Gene Indices: clustering and assembling EST and known genes and integration with eukaryotic genomes. Nucleic Acids Res. 2005;33 Database Issue:D71–4. doi: 10.1093/nar/gki064. [DOI] [PMC free article] [PubMed] [Google Scholar]
- Bateman A, Coin L, Durbin R, Finn RD, Hollich V, Griffiths-Jones S, Khanna A, Marshall M, Moxon S, Sonnhammer EL, Studholme DJ, Yeats C, Eddy SR. The Pfam protein families database. Nucleic Acids Res. 2004;32:D138–41. doi: 10.1093/nar/gkh121. [DOI] [PMC free article] [PubMed] [Google Scholar]
- Tatusova TA, Madden TL. BLAST 2 Sequences, a new tool for comparing protein and nucleotide sequences. FEMS Microbiol Lett. 1999;174:247–250. doi: 10.1111/j.1574-6968.1999.tb13575.x. [DOI] [PubMed] [Google Scholar]
- Pfam. http://www.sanger.ac.uk/Software/Pfam/
- Muller YP, Janovjak H, Miserez AR, Dobbie S. Processing of Gene Expression Data generated by Quantitative Real-Time RT-PCR. Biotechniques. 2002;32:1372–4, 1376, 1378-9.. [PubMed] [Google Scholar]
- Wong ML, Medrano JF. Real-time PCR for mRNA quantitation. Biotechniques. 2005;39:75–85. doi: 10.2144/05391RV01. [DOI] [PubMed] [Google Scholar]
Associated Data
This section collects any data citations, data availability statements, or supplementary materials included in this article.
Supplementary Materials
Expression profile for microarray genes. Expression profile for microarray genes more highly expressed in males according to the chromosomal localization.
Differentially expressed clones. Excel sheet showing annotations and expression data for all 146 differentially expressed clones.
Graphs of PCR results. The average mean normalized expression (MNE) for females (red) and males (blue) of selected gene (listed alphabetically) on ed4 and/or ed8, analyzed by real-time PCR (n = 5). Error bars indicate standard error of the mean. For calculations, see Methods.
Alignment of ABWT. A. UCSC genome browser window showing the alignment of ABWT and three additional annotation tracks. 'Non-Chicken RefSeq Genes' shows the alignment of non-chicken RefSeq sequences for Ube2r2 from mouse (Mus musculus) and zebrafish (Danio rerio). 'Chicken mRNAs from GenBank' describes the alignment of additional chicken mRNAs in this region. 'Repeating Elements by RepeatMasker ' shows the parts of the genome region masked for repetitive sequences. This UCSC Genome Browser window can be accessed by searching with 'chrW_random:175,450-180,581' on the UCSC chicken genome browser site [19]. B. Alignment data for ABWT against the chicken genome.
Species comparisons of the UBE2R2 protein. Species comparison between chicken (Gg), human (Hs), mouse (Mm), Xenopus leavis/tropicalis (Xl/Xt) and Saccharomyces cerevisiae (Sc) of the UBE2R2 protein using the protein sequences listed in additional file 7. A comparison between Pfam domains (representing protein domains or conserved protein regions) and the number of positive amino acid matches against the chicken sequence is shown (see Methods).
Species comparisons of proteins associated with TFIIH complex. Species comparison between chicken (Gg), human (Hs), mouse (Mm), Xenopus leavis/tropicalis (Xl/Xt) and Saccharomyces cerevisiae (Sc) of TFIIH proteins using the protein sequences listed in additional file 7. A comparison between Pfam domains (representing protein domains or conserved protein regions) and the number of positive amino acid matches against the chicken sequence is shown (see Methods).
Species comparisons of proteins associated with TFIIH complex. List of the protein identities used in Additional Files 5 and 6.