Abstract
The shortage of organs for transplantation into human patients continues to be a driving force behind research into the use of tissues from non-human donors, particularly pig. The primary barrier to such xenotrans-plantation is the reaction between natural antibodies present in humans and Old World monkeys and the Galα(1–3)Gal epitope (xenograft antigen, xenoantigen) found on the cell surfaces of the donor organ. This hyperacute immune response leads ultimately to graft rejection. Because of its high specificity for the xenograft antigen, isolectin 1-B4 from Griffonia simplicifolia (GS-1-B4) has been used as an immunodiagnostic reagent. Furthermore, haptens that inhibit natural antibodies also inhibit GS-1-B4 from binding to the xenoantigen. Here we report the first x-ray crystal structure of the xenograft antigen bound to a protein (GS-1-B4). The three-dimensional structure was determined from orthorhombic crystals at a resolution of 2.3 Å. To probe the influence of binding on ligand properties, we report also the results of molecular dynamics (MD) simulations on this complex as well as on the free ligand. The MD simulations were performed with the AMBER force-field for proteins augmented with the GLYCAM parameters for glycosides and glycoproteins. The simulations were performed for up to 10 ns in the presence of explicit solvent. Through comparison with MD simulations performed for the free ligand, it has been determined that GS-1-B4 recognizes the lowest energy conformation of the disaccharide. In addition, the x-ray and modeling data provide clear explanations for the reported specificities of the GS-1-B4 lectin. It is anticipated that a further under-standing of the interactions involving the xenograft antigen will help in the development of therapeutic agents for application in the prevention of hyperacute xenograft rejection.
The major barrier to xenotransplantation (1) is a hyperacute immune response (2), in which Galα (1–3)Gal (xenograft antigen) present on the surface of non-primate tissues triggers the rejection from human transplant recipients (3–5). The ubiquitous presence of anti-Galα(1–3)Gal antibodies in humans, Old World monkeys and apes is paralleled by the absence of Galα (1–3)Gal on the cell surfaces of those species (6). The natural antibodies attack the surface endothelial cells leading to complement activation and organ death. Several approaches to this problem have been considered (1), including inhibition of the anti-Galα (1–3)Gal antibodies, induction of tolerance to the xenoantigen (7), and transgenic alteration of the Galα (1–3)Gal epitope present on the cell surfaces of the donor species (8, 9). To date, only transient suppression of the anti-Galα (1–3)Gal immune response has been achieved (1). Overcoming xenograft rejection has become increasingly important due to the huge demand for organ transplants; a study in 1998 estimated that the demand had increased by 100% over the period 1990 through 1998 (1).
Griffonia simplicifolia lectin-1 (GS-1)1 is a carbohydrate-binding glycoprotein that is isolated from the seeds of the African leguminous shrub. As in many other legume lectins, GS-1 relies on the presence of divalent metal cations for its carbohydrate-binding activity (10). GS-1 is a mixture of five tetrameric isolectins that vary in their content of A and B subunits (11). The A subunit was found to bind strongly to both GalNAcα and Galα residues, while favoring GalNAcα (12). Competitive binding studies have shown that the GS-1 isolectin composed of four B subunits (GS-1-B4) has a high affinity for the Galα (1–3)Gal sequence (12, 13). Therefore, GS-1-B4 has found application as an immunodiagnostic reagent in studies of the xenograft antigen. Furthermore, inhibitors of the interaction between anti-Galα (1–3)Gal antibodies and the xenograft antigen also inhibit carbohydrate binding to GS-1-B4 (14–16). Notably, the binding of Galα (1–3)Gal to GS-1-B4 appears to be determined primarily by the presence of the terminal α-galactosyl residue; other linkages may be tolerated, as long as they contain a terminal Galα residue. Thus, GS-1-B4 is not a perfect model for the natural antibodies; however, it does provide an opportunity to gain detailed insight into the mechanism of recognition of the xenoantigen. To determine the mechanism for the observed specificities, as well as to obtain the first structure of the xenoantigen bound to a protein, we have determined the x-ray crystal structure of the GS-1-B4·Galα (1–3)Gal complex.
A number of structural studies have been reported for the xenograft antigen and related oligosaccharides (12, 17–21). These studies used both computational and NMR spectroscopic methods to determine the solution conformation. Earlier computational studies employed adiabatic energy mapping to predict low energy conformations for the Galα(1–3)Gal linkage. More recently, both gas-phase Monte Carlo and molecular dynamics (MD) simulations have been employed to examine ligand flexibility (19, 21). To determine the extent to which water mediates the conformational properties of the ligand, the present study employed MD simulations of the free ligand in explicit water at atmospheric pressure and room temperature. These long 10-ns simulations are extremely computer-intensive, however, they are able to predict with accuracy the influence of solvation and binding interactions on the conformational and dynamic properties of carbohydrates (22). To examine the influence of protein binding on ligand dynamics, as well as to obtain a complete spatial and temporal picture of the interaction, 2- to 5-ns MD simulations of the bound complex, were also performed with explicit water. These simulations provide additional insight into the structural significance of bound waters, seen to mediate the carbohydrate-protein interaction in the x-ray structure.
EXPERIMENTAL PROCEDURES
Crystallization, Diffraction Data Collection, and Structure Solution by Molecular Replacement
The crystallization, x-ray diffraction data collection, and molecular replacement for the GS-1-B4 complex with Galα (1–3)Galβ-OMe are described in detail elsewhere (23).
Structure Refinement
Data collected from two crystals from different crystallization drops where used in the structural refinement. The combined data set was obtained by merging individual integrated reflection files using SCALEPACK of the HKL software suite (24). Of 22,043 observed (23,055 theoretical) reflections between 20- and 2.2-Å resolution, 1500 were set aside as test observations (25). The CNS suite of programs (26), with a maximum likelihood target function (27), was used throughout the entire process of refinement. After two rounds of independent rigid-body refinement of the two instances of the search model polypeptide chain (RCSB ID: 1GSL) (28), the NCS transformation matrix between the two molecules was determined. The resultant operators were used in the application of NCS constraints in the initial stages of refinement. Real-space density fitting was performed using O (29). After the inclusion of two metal ions (30) and carbohydrate chains, NCS constraints were removed and replaced by gradually decreasing restraints. Prior to PDB submission (as RCSB ID: 1HQL) (31) the model quality was assessed using PROCHECK (32).
Molecular Dynamics
The SANDER (33) module of AMBER 5.0 (34) was utilized in conjunction with the PARM98 parameter set for proteins and the GLYCAM (35) parameter set for glycosides and glycoproteins. A single subunit of the GS-1-B4 x-ray crystal structure 1HQL was protonated with INSIGHTII (36), and a 25-Å droplet containing 1389 TIP3P waters (37) was placed around O3 of the non-reducing end of the disaccharide (Galα, residue 243). Initially, the solvent positions were optimized with 9000 steps of steepest descent, followed by 1000 steps of conjugate gradient, energy minimization. This was followed by a period of simulated annealing, during which the solvent was heated to 300 K over 20 ps, held at 300 K for 60 ps, before being cooled to 5 K over an additional 20 ps. The simulated annealing was followed by energy minimization of the entire system. During the production MD simulation, all atoms of the protein within 15 Å of the binding site (defined as the carbohydrate recognition domain (CRD)), all waters, and the ligand were allowed complete motional freedom. All other atoms were held frozen unless otherwise stated. The system was then heated from 5 to 300 K over 40 ps and maintained at 300 K for 2 ns through weak coupling to an external bath with a coupling constant of 0.25 ps−1. An additional simulation was performed for 5 ns with the water involved in the binding site (Wat56) restrained in the crystallographic position.
All simulations involving the free disaccharide were performed under periodic boundary conditions at constant pressure, following similar protocols for energy minimization and simulated annealing as used for the droplet simulations. The final production run was performed for 10 ns. All MD simulations employed an integration time step of 2 fs, a dielectric constant of unity, scaling of 1–4 electrostatic and van der Waals interactions by the standard values of 1/1.2 and 1/2.0, restraint of all hydrogen-containing bonds through the SHAKE algorithm (33), and a cutoff of 8 Å for all non-bonded interactions. Analysis of the trajectories was performed using the CARNAL module of AMBER 5.0.
RESULTS AND DISCUSSION
X-ray Data Reduction and Structure Refinement
The structure of the complex was solved by molecular replacement using diffraction data from 8 to 4 Å, from only one crystal (Crystal I) (23), resulting in the placement of two instances of the search model polypeptide in the asymmetric unit. However, the subsequent refinement proved challenging. Apart from a 25-residue N-terminal sequence (38), no further sequence information was initially available for GS-1-B4. Although the related lectin GS-4 has 12 of its 27 N-terminal amino acid residues in common with GS-1-B4, a loop in this region of the chain contains 3 additional residues (28). Initial inspection of annealed omit maps (39) using data from 30 to 2.65 Å revealed substantial discrepancies between search model coordinates and electron density. The quality of these maps did not permit significant model improvements due to difficulties in real space fitting of misplaced regions. This could be attributed to the uncertainty surrounding the number of residues and the types of side chains to be fitted in areas with low correlation between electron density and model coordinates.
A second set of diffraction data, this time extending beyond 2.2-Å resolution, was collected using a crystal (Crystal II) grown in a separate experiment under the conditions described for Crystal I (23). This data set was less complete than that for Crystal I, for resolutions lower than 2.65 Å, apparently due to increased crystal mosaicity and ensuing rejection of overlapping reflections. Applying the parameters used in the molecular replacement for the Crystal I data, these data failed to provide a structure solution using the CNS program. Consequently, several strategies were considered for scaling data from both crystals into a combined data set to use the additional higher resolution data during refinement. Ultimately, the combined set was obtained by scaling together individual integrated reflection files from DENZO (24).
Although Table I highlights significant discrepancies between the data from both crystals, the procedure resulted in a data set that proved to be of sufficient quality for successful refinement by alternating slow-cool simulated annealing and real-space model rebuilding. Initially, refinement was confined to one of the polypeptide chains in the asymmetric unit, and coordinates for the second chain were generated by strict application of NCS operators. At this stage, difference density clearly indicated the position of two metal ions. Unlike the commonly observed presence of a Ca2+and a transition metal cation combination (30) two calcium cations were employed initially in the refinement. This decision was based on a study of GS-1 metal dependence (10) and our failure to detect significant amounts of Mn2+ in a metal analysis of a GS-1-B4 solution. At this point, the quality of the electron density permitted the addition of the carbohydrate ligand and residues of the N-glycan on residue Asn27. NCS constraints were replaced by restraints when the crystallographic residual had been improved to 25.5% (Rfree = 26.6%). Lastly, the addition of crystallographic water atoms and substitution of Mn2+ for one Ca2+ in each subunit, both based on difference map density, produced a preliminary model. In the absence of the complete GS-1-B4 amino acid sequence, the model was based on the published N-terminal sequence (38), unpublished data derived from sequencing of fragments from CNBr2 digests and sequences of homologous Griffonia simplicifolia lectins.3 This model was updated when the complete sequence became available (40).
Table I.
Diffraction data analysis, space group P21212
| Parameter | Crystal I | Crystal II | Combined |
|---|---|---|---|
| a (Å) | 111.00 | 111.42 | 111.21 |
| b (Å) | 51.32 | 51.12 | 51.28 |
| c (Å) | 76.91 | 77.22 | 77.11 |
| Resolution (Å) | |||
| Total | 30.00–2.65 | 20.00–2.25 | 20.00–2.20 |
| Outer shell | 2.77–2.65 | 2.35–2.25 | 2.30–2.20 |
| Completeness (%) | 97.4/95.9 | 85.4/85.2 | 96.7/83.8 |
| Completeness I/σ>3 (%) | 83.2/59.2 | 72.2/55.6 | 76.9/48.4 |
| Rsym (%) | 6.9/28.0 | 5.0/24.9 | 14.2/41.6 |
Description of the Biologically Active Tetramer
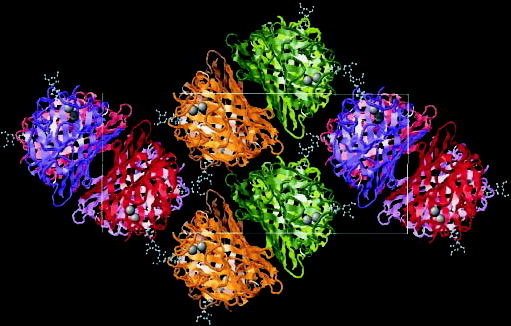
The asymmetric unit consists of two single chain subunits A (not to be confused with the A-type subunit of GS-1) and B. Subunits A and B are related by a non-crystallographic 2-fold axis oriented roughly perpendicular to the 6-stranded “back” β sheet, common in legume lectin monomers (30). However, unlike the case in the “canonical” dimer found in concanavalin A (41), the two subunits do not arrange to form a large 12-stranded sheet. Rather, the strands composed of residues 4 –11, 239 –231, and 69 –76 appear to align as extensions of strands 69 –76, 239 –231, and 4 –11 in the other subunit, respectively. Aromatic residues such as Trp13 and Phe78 and non-polar side chains of Ala30 and Leu231 exhibit the closest contacts with the peptide chain in the other subunit. Application of the crystallographic symmetry-based transformation (1 − x, −y, z) to the atomic coordinates of subunits A and B generated subunits A* and B*, respectively. Interestingly, the mode of association observed between A and A*, as well as between B and B*, resembles that in the GS-4 dimer (28), with a nearly perpendicular alignment of the strands in the β sheets at the interface (Figs. 1 and 2).
Fig. 1. The biological tetramer of GS-1-B4 extends over two asymmetric units containing one Galα (1–3)Galβ-OMe molecule in the binding site of each subunit of the lectin (left, Rasmol).
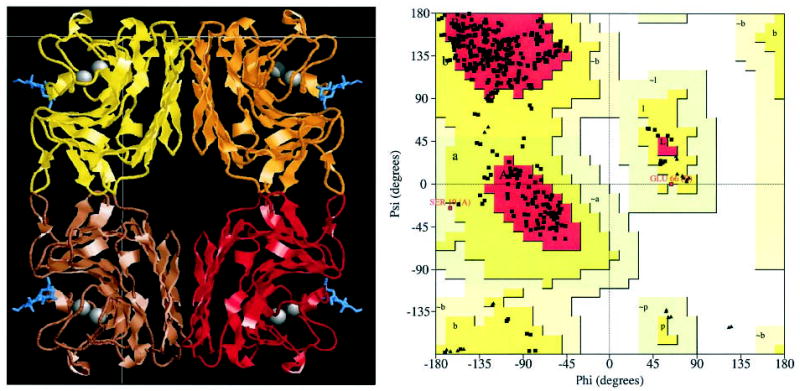
Ramachandran plot of the refined complex model (right, Procheck).
Fig. 2. Packing of GS-1B4 subunits inside the crystallographic unit cell (Rasmol image).
Metal Binding Site
Based on a published biochemical study of the metal dependence of GS-1 (10), Ca2+ was the only divalent metal ion added to the protein buffer used in the crystal-lization of GS-1-B4 (23). Consequently, both metal sites were treated as being occupied by Ca2+ ions in the initial stages of refinement. Significantly shorter bond distances to surrounding protein side-chain atoms and some remaining Fo − Fc electron density at one of the metal centers led to the adoption of the Mn2+/Ca2+ configuration, commonly observed in legume lectins. It must be assumed that residual Mn2+ remained bound to the protein sample even during isolation. Although failing to be detected by atomic spectroscopy, enough Mn2+ apparently remained for the formation of GS-1-B4 crystals containing Mn2+. The final model contains a metal binding site that closely resembles the structure described for GS-4 (Fig. 1) (28). Similar to observations from GS-4, the second carboxylate oxygen of Asp130 is oriented such that it may act as a seventh ligand for one of the Ca2+ ions (28, 42).
N-Glycosylation
Native GS-1-B4 is a glycoprotein (10), and electron density suggests glycosylation at residue Asn27. It is observed on both subunits, but the density on subunit B shows superior continuity when compared with that on A. Electron density permitted the modeling of the core GlcNAcβ(1–4)GlcNAc sequence; however, even in case of the B subunit, density for the carbohydrate residues is weak and does not cover all atoms.
The Xenograft Antigen in the Carbohydrate Binding Site of GS-1-B4
The terminal α-galactosyl residue (Galα) of the xenograft antigen is represented by well-contoured electron density in the CRDs of both the A and B subunits. Interactions between the side chain of Asp88 with hydroxyl groups HO-3 and HO-4, as well as between the side chains of Asn134 and the amide nitrogen of Glu106 with HO-3 (Fig. 1), are paralleled by similar interactions involving residues Asp89, Asn135, and Gly107 in the complex between GS-4 and the Lewis b human blood group determinant (28). Additional contacts can be found between the backbone amides of residues Asn222 and Asn223 and HO-6. Residues Gly105 and Glu106 distinguish GS-1-B4 from a variety of other legume lectins, in which a Gly-Gly sequence is highly conserved in this region, thus the interaction between the side chain of Glu106 and hydroxyl groups HO-2 and HO-3 of the Galα residue is noteworthy.
Significant density for the β-methyl galactosyl residue (Galβ) is only seen in the B subunit. This residue is situated well above the protein surface. Notably, in the ligand bound to subunit B, the Galβ residue is found in close proximity to the loop region extending from residues 61 thorough 69 of a molecule of subunit A, which is generated by a crystallographic symmetry operation. This presumably restricts the mobility of the carbohydrate ligand and, therefore, improved its contribution to diffraction (Figs. 3 and 4 and Table II).
Fig. 3. Schematic representation of metal coordination in GS- 1-B4.
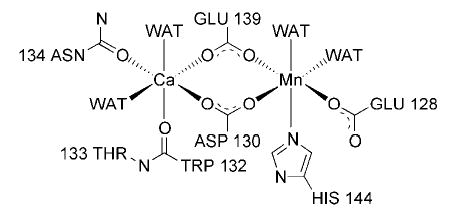
The metal binding site of GS-1-B4 closely resembles that reported for GS-4, where the side chains of Gln129, Asp131, Asn135, Asp140, and His145, four water molecules, and the carbonyl oxygen of Trp133 directly interact with the metal ions.
Fig. 4. Interactions at the carbohydrate binding site of GS-1-B4.
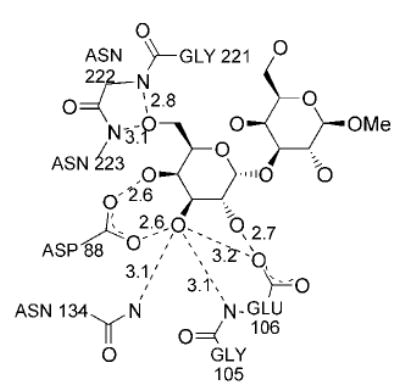
Distances shown are in Å and represent the mean between the values of the two monomers in the asymmetric unit.
Table II.
Statistical analysis of the refined model
| Root mean square deviation from ideal geometry | |
| Bond lengths | 0.007 Å |
| Bond angles | 1.2 ° |
| Dihedral angles | 26.4 ° |
| Improper angles | 0.73 ° |
| Coordinate error (cross-validated) | |
| Luzzati | 0.27 Å (0.32 Å) |
| Sigma A | 0.21 Å (0.24 Å) |
| Temperature factors | |
| Mean | 38.9 Å2 |
| Wilson | 42.6 Å2 |
| Ramachandran plot, residues in: | |
| Most favored regions | 84.8% |
| Additional allowed regions | 14.7% |
| Generously allowed regions | 0.5% |
Free Ligand
Throughout the 10-ns MD simulation in water, the glycosidic torsion angles in Galα(1–3)Galβ-OMe showed only brief, relatively localized transitions from the equilibrium conformation. The Ψ angle showed increased flexibility relative to the α angle, which is consistent with other α-linkages (20) and with earlier predictions that the Galα (1–3)Gal linkage is relatively flexible (see Fig. 3). The major conformation present is shown in Table III and as conformation B in Fig. 3. This conformation was predicted to be the lowest in energy and has been found experimentally to be the most populated in solution in related oligosaccharides (41, 20, 21, 18). Two additional minor conformations were found and are referred to as A and D, (nomenclature consistent with a previous conformational energy map calculated for this linkage) (20). An additional higher energy theoretical conformation (C) (20) was not populated during our simulation. Overall, the average Φ and Ψ angles determined by the MD simulation remained close to those of the ligand in the x-ray crystal structure of the complex. Therefore, it may be concluded that GS-1-B4 recognizes the lowest energy conformation of Galα (1–3)GalβOMe, in which Φ adopts a conformation expected on the basis of the exo-anomeric effect (44) (Fig. 5 and Table III).
Table III. Comparison of the Φ and Ψ angles in the free sugar verses the sugar·protein complex.
Φ angle (deg) is defined by H1-C1-O3′-C3′; Ψ angle is defined by C1-O3′-C3′-H3′.
| Complex
|
|||
|---|---|---|---|
| Crystal | Free sugar | 2-ns | 5-ns |
| Φ −31.8 | −44.2 (14) | −37.7 (14) 3 | −35.7 (10) |
| Ψ −15.9 | −24.7 (18) | −21.8 (16) 3 | −15.0 (14) |
Fig. 5. Glycosidic torsion angles of the free ligand in water determined over the 10-ns MD simulation.
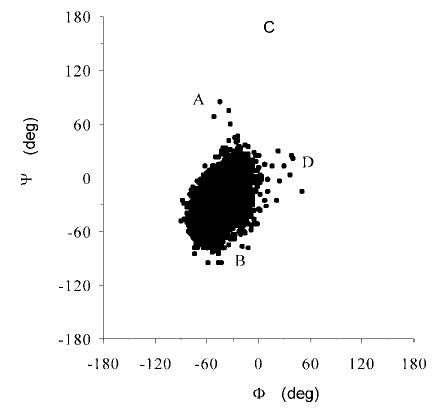
A, B, C, and D refer to previously identified conformations for this disaccharide (20).
Bound Galα (1–3)GalβOMe Conformational Analysis
The average Φ and Ψ angles from the 2-ns MD simulation were in good agreement with the x-ray data. The analysis was halted at 2 ns, because Wat56 dispersed out of the CRD at just over 2 ns. According to the x-ray data from subunit B, this water participates in a bridge between the ligand and the protein and may be of importance in stabilizing the protein·ligand complex. For comparison, a 5-ns MD simulation was performed, in which Wat56 was restrained in the x-ray position. The longer simulation revealed Φ and Ψ angles that were more rigid than observed in the 2-ns MD simulation, suggesting that an indirect result of restraining the water was to attenuate the mobility of neighboring residues.
In both the 2- and 5-ns MD simulations a rotation around the C5–C6 bond of the Galα residue occurred. The transition occurred after ~100 ps in the longer run and 500 ps in the shorter run. This transition resulted from the formation of a new interaction between O6 of the Galα residue and O3 of the Galβ residue at the expense of interactions between O6 and Asn residues 222 and 223. A weak interaction, involving the Nδ2 atom of Asn223 and O6 was maintained throughout the simulation, in contrast to interactions involving the backbone amide atoms of Asn222 and Asn223, which were broken during the transition. The ability of Nδ2 to maintain contact was most likely facilitated by the flexibility of the side chain, in comparison to the more rigid backbone. This result indicates more flexibility in the ligand than might be expected on the basis of epitope mapping studies, which have shown that substituents at the O6 position in Galα decrease the affinity (12).
Hydrogen Bonding Analysis
Because the MD simulations include hydrogen atoms, it is possible to include them in an analysis of hydrogen bond properties, such as donor acceptor assignments, and hydrogen bond occupancies. In the calculation of occupancies, hydrogen bonding interactions were assumed to be present if the participating heavy atoms were ≤4 Å apart, and the angle formed between the heavy atoms and the donating hydrogen was ≤ 60°, as defined in the CARNAL module of AMBER 5.0. The corresponding standard deviations for the inter-atomic positions were calculated only when the requirements for hydrogen bond occupancy were fulfilled. Therefore, typically strongest hydrogen bonds have the highest occupancies, the smallest standard deviations, and the shortest heavy atom separations. The dependence on hydrogen position results in an analysis that is more sensitive than that based on the x-ray data, which relies solely on the heavy atom separation, with a separation of ≤3.2 Å being characterized as moderately strong, and a separation from 3.2 to 4.0 Å being indicative of a weak, hydrogen bond (45). The MD data provide considerable additional insight into the dynamic or fluxional nature of these interactions (Fig. 6 and Table IV).
Fig. 6. Hydrogen bonding interactions between the Galα residue and the CRD (carbohydrate recognition domain) of the GS-1-B4 lectin from the 2-ns MD simulation.
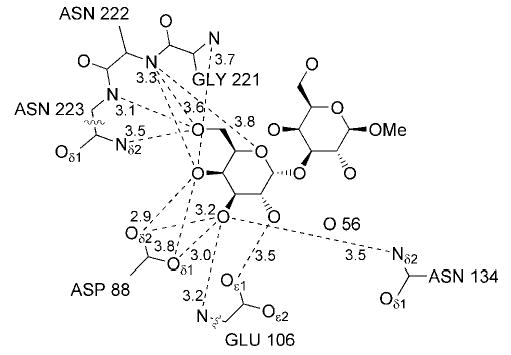
All distances are the mean values, given in Å.
Table IV.
Hydrogen bonding interactions between Galα residue and the GS-1-B4 lectin
| Distancea |
||||
|---|---|---|---|---|
| MD
|
||||
| Donor atom | Acceptor atom | 2-ns run | 5-ns run | X-ray |
| Glu106 NH | Galα O3 | 3.2 (0.2) 51 | 3.2 (0.2) 37 | 3.1 |
| Asn134 Nδ2H1 | Galα O3 | 3.5 (0.3) 84 | 3.5 (0.3) 85 | 3.1 |
| Gly221 NH | Galα O4 | 3.7 (0.2) 56 | 3.5 (0.2) 55 | 3.4 |
| Asn222 NH | Galα O4 | 3.3 (0.2) 98 | 3.4 (0.2) 97 | 4.1 |
| Asn222 NH | Galα O5 | 3.8 (0.2) 34 | 3.7 (0.2) 81 | 3.4 |
| Asn222 NH | Galα O6 | 3.6 (0.2) 19 | 3.5 (0.2) 2 | 3.1 |
| Asn223 NH | Galα O6 | 3.1 (0.1) 28 | 3.3 (0.4) 5 | 2.8 |
| Asn223 Nδ2H1 | Galα O6 | 3.5 (0.2) 31 | 3.5 (0.2) 14 | 3.9 |
| Galα O2H | Glu106 Oε1 | 3.5 (0.3) 49 | 3.4 (0.4) 38 | 2.7 |
| Galα O3H | Asp88 Oδ1 | 3.0 (0.2) 100 | 2.9 (0.1) 100 | 2.6 |
| Galα O3H | Asp88 Oδ2 | 3.2 (0.2) 99 | 3.2 (0.2) 99 | 3.5 |
| Galα O4H | Asp88 Oδ1 | 3.8 (0.2) 75 | 3.8 (0.1) 71 | 3.3 |
| Galα O4H | Asp88 Oδ2 | 2.9 (0.1) 100 | 2.8 (0.1) 100 | 2.6 |
In Ångstroms, standard deviation in parentheses, and percent hydrogen bond occupancies in boldface.
In the crystal structure, the distance between Glu106 Oε1 and the oxygen atom of hydroxyl group HO-2 in Galα is exceptionally short, with a heavy atom separation of 2.6 Å. In both MD simulations of the complex this interaction lengthened to a value of ~3.4 Å. Similarly, the interactions between HO-3 and HO-4 of Galα with the carboxylate group of Asp88 display extremely close contacts in the x-ray structure (2.6 Å), but lengthened to a more common value of ~2.9 Å in the MD simulations. The extent to which this illustrates the limitations of the x-ray data, versus a genuine difference between solution and crystalline environments, is unclear and may only be resolved with collection of a high resolution data set (Fig. 7 and Table V).
Fig. 7. Hydrogen bonding interactions involving the complexed water from the 2-ns MD simulation.
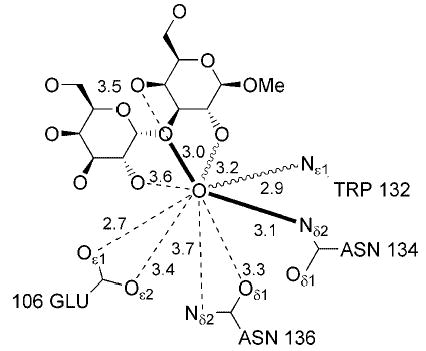
Boldface lines represent interactions present in both conformations. The dashed lines represent interactions taking place only in configuration E, and the wavy lines represent interactions taking place only in configuration W.
Table V.
Hydrogen bonding interactions between Galα(1–3)Galβ OMe and the B subunit of the GS-1-B4 lectin with the complexed water
| Distancea |
||||
|---|---|---|---|---|
| MD
|
||||
| Donor atom | Acceptor atom | 2-ns run | 5-ns run | X-ray |
| Wat56 OH1 | GalβOMe O2 | 3.2 (0.3) 28 | 5.5 | |
| Wat56 OH1 | GalβOMe O3 | 3.0 (0.2) 40 | 3.5 | |
| Wat56 OH1 | Glu106 Oε1 | 2.7 (0.3) 11 | 2.8 (0.3) 70 | 4.0 |
| Wat56 OH1 | Glu106 Oε2 | 3.4 (0.5) 8 | 2.9 (0.4) 40 | 3.0 |
| Wat56 OH1 | Asn136 Oδ1 | 3.3 (0.5) 13 | 3.1 (0.2) 55 | 2.6 |
| Wat56 OH2 | Galα O2 | 3.6 (0.4) 5 | 3.0 (0.2) 100 | 2.8 |
| Wat56 OH2 | GalβOMe O2 | 3.2 (0.3) 26 | 5.5 | |
| Wat56 OH2 | GalβOMe O3 | 3.0 (0.2) 31 | 3.2 (0.2) 48 | 3.5 |
| Trp132 Nε1H1 | Wat56 O | 2.9 (0.2) 77 | 5.5 | |
| Asn134 Nδ2H2 | Wat56 O | 3.1 (0.2) 96 | 3.4 (0.1) 99 | 3.2 |
| GalβOMe O4H | Wat56 O | 3.5 (0.4) 24 | 3.0 (0.2) 98 | 3.6 |
| Asn136 Nδ2H1 | Wat56 O | 3.7 (0.2) 4 | 3.5 (0.3) 26 | 2.7 |
In Ångstroms, standard deviation in parentheses, and percent hydrogen bond occupancies in boldface.
The only difference between the two simulations of the complex was the treatment of the bound water. As a result, interactions involving Wat56, which are shown in Table V, are quite different in each simulation of the complex. Wat56 populates two positions, denoted E and W (referring to coordination to Glu106 or Trp132), during the 2-ns simulation and are illustrated in Fig. 4. Although Wat56 and the carboxylate of Glu106 are tightly coordinated in configuration E, the interaction has a low overall occupancy due to the fact that the W configuration is present for the majority of the time. In the W configuration two new interactions with Wat56 form, involving HO-2 of Galβ and Nδ1 of Trp132. Therefore, these small occupancies illustrate a dynamic, but not necessarily weak, interaction. This suggests that the water is mobile in the binding site, consistent with the absence of electron density for Wat56 in subunit A. Therefore, the positional constraints employed in the 5-ns MD simulation may yield misleading results in the statistical analysis of properties dependent on this water molecule. This raises a considerable question regarding the role played by this water in the binding mechanism (Figs. 8 and 9).
Fig. 8. Transitions involving the complexed water during the 2-ns MD simulation.
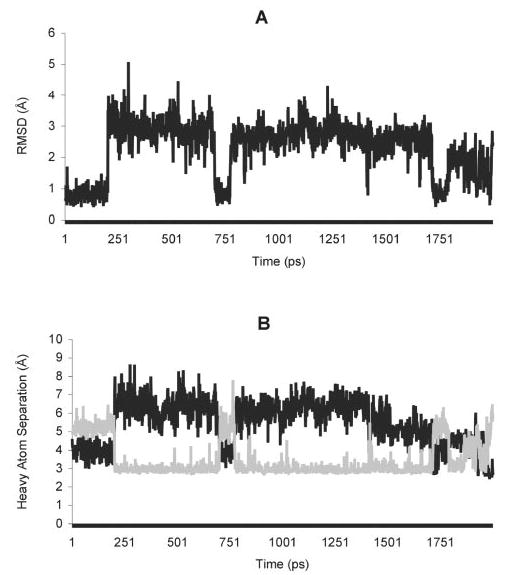
A, the r.m.s.d. of the complexed water, relative to the crystal structure. B, heavy atom distances, where the dark line represents Wat56 O-Asn134 Nδ2, and the gray line represents Wat56 O-Trp132 Nε1.
Fig. 9. Side view (A) and top view (B) of the molecular surface of the binding site of the xenograft antigen in GS-1-B4.
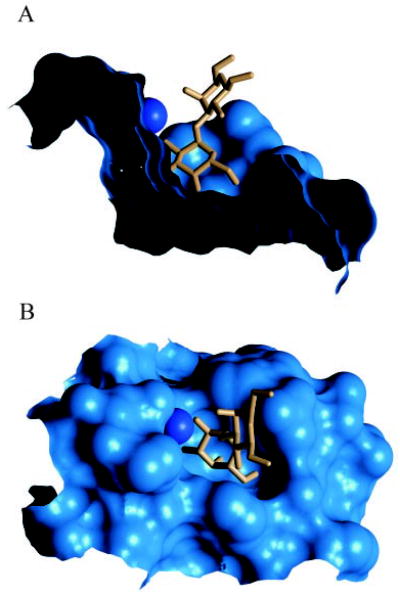
Wat 56 is shown as a dark-blue sphere.
Lectin Specificity
The binding site consists of a deep cavity, which accommodates only the first residue of the disaccharide (see Fig. 7). Modeling indicated that epimerization of C4 in the terminal Galα residue (Galα → Glcα) would result in the loss of a strong interaction between hydroxyl group HO-4 and Asp88 Oδ2. Similarly, epimerization of C2 in the Galα residue would result in the loss of two interactions, namely with Galα O2·Glu106 Oε1 and Galα O2·Wat56. Each of these observations is consistent with experimental data that show this lectin to have the highest binding affinity for oligosaccharides characterized by terminal Galα residues (12). Furthermore, modeling indicated that alteration of the α (1–3) linkage to a β(1–3) linkage would be sterically unfavorable, due to close contacts formed between the reducing end of the disaccharide and Trp47. This is also consistent with experimental data that revealed GS-1-B4 to have a much stronger affinity for Galα conjugated to human serum albumin than for the corresponding Galβ conjugate (12, 46).
Acknowledgments
We thank the National Institutes of Health and the Office of the Vice President for Research at the University of Georgia for financial support. In addition, we are indebted to Dr. Anne Imberty for generously providing the primary sequence of GS-1-B4.
Footnotes
This work was supported by National Institutes of Health Grant GM-55230 and by the Office of the Vice President for Research at the University of Georgia.
The atomic coordinates and structure factors (code IHQL) have been deposited in the Protein Data Bank, Research Collaboratory for Structural Bioinformatics, Rutgers University, New Brunswick, NJ (http://www.rcsb.org/).
The abbreviations used are: GS-1, G. simplicifolia lectin-1; AMBER, assisted model building and energy refinement; CNS, crystallography & NMR system; CRD, carbohydrate recognition domain; Gal, d-galac-topyranosyl; GLYCAM, glycosides and glycoproteins in AMBER; MD, molecular dynamics; NCS, noncrystallographic symmetry; RCSB, Research Collaboratory for Structural Bioinformatics; SANDER, simulated annealing and energy refinement; TIP3P, transferable intermolecular potential −3 point.
References
- 1.Auchincloss H, Sachs DH. Annu Rev Immunol. 1998;16:433–470. doi: 10.1146/annurev.immunol.16.1.433. [DOI] [PubMed] [Google Scholar]
- 2.Platt JL, Bach FH. Curr Opin Immunol. 1991;3:735–739. doi: 10.1016/0952-7915(91)90105-a. [DOI] [PubMed] [Google Scholar]
- 3.Good AH, Cooper DKC, Malcolm AJ, Ippolito RM, Koren E, Neethling FA, Ye Y, Zuhdi N, Lamontagne LR. Transplant Proc. 1992;24:559 –562. [PubMed] [Google Scholar]
- 4.Galili U. Immunol Today. 1993;14:280 –482. doi: 10.1016/0167-5699(93)90261-i. [DOI] [PubMed] [Google Scholar]
- 5.Sandrin MS, Vaughan HA, Dabkowski PL, McKenzie IFC. Proc Natl Acad Sci U S A. 1993;90:11391–11395. doi: 10.1073/pnas.90.23.11391. [DOI] [PMC free article] [PubMed] [Google Scholar]
- 6.Galili U, Clark MR, Shohet SB, Buehler J, Macher BA. Proc Natl Acad Sci U S A. 1987;84:1369 –1373. doi: 10.1073/pnas.84.5.1369. [DOI] [PMC free article] [PubMed] [Google Scholar]
- 7.Greenstein JL, Sachs DH. Nat Biotech. 1997;15:235–237. doi: 10.1038/nbt0397-235. [DOI] [PubMed] [Google Scholar]
- 8.Thall AD, Murphy HS, Lowe JB. Transplant Proc. 1996;28:556 –557. [PubMed] [Google Scholar]
- 9.Tearle RG, Tange MJ, Zannettino ZL, Katerelos M, Shinkel TA, Van Denderen BJW, Lonie AJ, Lyons I, Nottle MB, Cox T, Becker C, Peura AM, Wigley PL, Crawford RJ, Robins AJ, Pearse MJ, D’Apice AJF. Transplantation. 1996;61:13–19. doi: 10.1097/00007890-199601150-00004. [DOI] [PubMed] [Google Scholar]
- 10.Hayes CE, Goldstein IJ. J Biol Chem. 1974;249:1904 –1914. [PubMed] [Google Scholar]
- 11.Murphy LA, Goldstein IJ. J Biol Chem. 1977;252:4739 –4742. [PubMed] [Google Scholar]
- 12.Goldstein IJ, Winter HG. Subcell Biochem. 1999;32:127–140. [PubMed] [Google Scholar]
- 13.Wood C, Kabat EA, Murphy LA, Goldstein IJ. Arch Biochem Biophys. 1979;198:1–11. doi: 10.1016/0003-9861(79)90389-8. [DOI] [PubMed] [Google Scholar]
- 14.Sandrin MS, Vaughan HA, Xing PX, McKenzie IFC. Glycoconj J. 1997;14:97–105. doi: 10.1023/a:1018521217276. [DOI] [PubMed] [Google Scholar]
- 15.Kooyman DL, McCClellan SB, Parker W, Avissar PL, Velardo MA, Platt JL, Logan JS. Transplantation. 1996;61:851–855. doi: 10.1097/00007890-199603270-00001. [DOI] [PubMed] [Google Scholar]
- 16.Vaughan HA, Oldenburg KR, Gallop MA, Atkin JD, McKenzie IFC, Sandrin M. Xenotransplantation. 1996;3:18 –23. [PubMed] [Google Scholar]
- 17.Lemieux RU, Bock K, Delbaere LTJ, Koto S, Rao VS. Can J Chem. 1980;58:631–653. [Google Scholar]
- 18.Bush CA, Yan ZY, Rao BNN. J Am Chem Soc. 1986;108:6168 –6173. [Google Scholar]
- 19.Yan Z-y, Bush AC. Biopolymers. 1990;29:799 –811. doi: 10.1002/bip.360290414. [DOI] [PubMed] [Google Scholar]
- 20.Imberty A, Mikros E, Koca J, Mollicone R, Oriol R, Pérez S. Glycoconj J. 1995;12:331–349. doi: 10.1007/BF00731336. [DOI] [PubMed] [Google Scholar]
- 21.Li J, Ksebati MB, Zhang W, Guo Z, Wang J, Yu L, Fang J, George WP. Carbohydr Res. 1999;315:76 –88. doi: 10.1016/s0008-6215(98)00321-8. [DOI] [PubMed] [Google Scholar]
- 22.Kirschner KN, Woods RJ. Proc Natl Acad Sci U S A. 2001;98:10541–10545. doi: 10.1073/pnas.191362798. [DOI] [PMC free article] [PubMed] [Google Scholar]
- 23.Tempel W, Lipscomb LA, Rose JP, Woods RJ. Acta Crystallogr Sect D Biol Crystallogr. 2001;57:1639 –1642. doi: 10.1107/s0907444901012148. [DOI] [PMC free article] [PubMed] [Google Scholar]
- 24.Otwinowski, Z. (1993) in CCP4 Study Weekend: Data Collection and Processing (Sawyer, L., Isaacs, N., and Bailey, S., eds) pp. 56 –62, SERC Daresbury Laboratory, Warrington, UK
- 25.Brunger AT. Nature. 1992;355:472–474. doi: 10.1038/355472a0. [DOI] [PubMed] [Google Scholar]
- 26.Brunger AT, Adams PD, Clore GM, DeLano WL, Gros P, Grosse-Kunstleve RW, Jiang JS, Kuszewski J, Nilges M, Pannu NS, Read RJ, Rice LM, Simonson T, Warren GL. Acta Crystallogr Sect D Biol Crystallogr. 1998;54:905–921. doi: 10.1107/s0907444998003254. [DOI] [PubMed] [Google Scholar]
- 27.Adams PD, Pannu NS, Read RJ, Brunger AT. Proc Natl Acad Sci U S A. 1997;94:5018 –5023. doi: 10.1073/pnas.94.10.5018. [DOI] [PMC free article] [PubMed] [Google Scholar]
- 28.Delbaere LTJ, Vandonselaar M, Prasad L, Quail JW, Wilson KS, Dauter Z. J Mol Biol. 1993;230:950 –965. doi: 10.1006/jmbi.1993.1212. [DOI] [PubMed] [Google Scholar]
- 29.Jones TA, Zou JY, Cowan SW, Kjeldgaard M. Acta Crystallogr Sect A. 1991;47:110 –119. doi: 10.1107/s0108767390010224. [DOI] [PubMed] [Google Scholar]
- 30.Loris R, Hamelryck T, Bouckaert J, Wyns L. Biochim Biophys Acta. 1998;1383:9 –36. doi: 10.1016/s0167-4838(97)00182-9. [DOI] [PubMed] [Google Scholar]
- 31.Berman HM, Westbrook J, Feng Z, Gilliland G, Bhat TN, Weissig H, Shindyalov IN, Bourne PE. Nucleic Acids Res. 2000;28:235–242. doi: 10.1093/nar/28.1.235. [DOI] [PMC free article] [PubMed] [Google Scholar]
- 32.Laskowski RA, MacArthur MW, Moss DS, Thornton JM. J Appl Crystallogr. 1993;26:283–291. [Google Scholar]
- 33.Ryckaert JP, Ciccotti G, Berendsen HJ. J Comput Phys. 1977;23:327–341. [Google Scholar]
- 34.Case, D. A., Pearlman, D. A., Caldwell, J. W., Cheatham, T. E., III, Ross, W. S., Simmerling, C. S., Darden, T. A., Merz, K. M., Stanton, R. V., Cheng, A. L., Vincent, J. J., Crowley, M., Ferguson, D. M., Radmer, R. J., Seibel, G. L., Singh, U. C., Weiner, P. K., and Kollman, P. A. (1997) AMBER 5.0, University of California, San Francisco, CA
- 35.Woods RJ, Dwek RA, Edge CJ, Fraser-Reid B. J Phys Chem. 1995;99:3832–3846. [Google Scholar]
- 36.Biosym/MSI. (1995) 95.0./3.0.0 Ed., Biosym/MSI, San Diego, CA
- 37.Jorgensen WL, Chandrasekhar J, Madura JD, Impey RW, Klein ML. J Phys Chem. 1983;79:926 –935. [Google Scholar]
- 38.Lamb JE, Goldstein IJ. Arch Biochem Biophys. 1984;229:15–26. doi: 10.1016/0003-9861(84)90125-5. [DOI] [PubMed] [Google Scholar]
- 39.Brunger AT, Adams PD, Rice LM. Structure. 1997;5:325–336. doi: 10.1016/s0969-2126(97)00190-1. [DOI] [PubMed] [Google Scholar]
- 40.Lescar J, Loris R, Mitchell E, Gautier C, Chazalet V, Cox V, Wyns L, Perez S, Breton C, Imberty A. J Biol Chem. 2002;277:6608 –6614. doi: 10.1074/jbc.M109867200. [DOI] [PubMed] [Google Scholar]
- 41.Edelman GM, Cunningham BA, Reecke GN, Becker JW, Waxdal MW, Wang J. Proc Natl Acad Sci U S A. 1972;69:2580 –2584. doi: 10.1073/pnas.69.9.2580. [DOI] [PMC free article] [PubMed] [Google Scholar]
- 42.Strynadka NCJ, James MNG. Ann Rev Biochem. 1989;58:951–998. doi: 10.1146/annurev.bi.58.070189.004511. [DOI] [PubMed] [Google Scholar]
- 43.Otter A, Lemieux RU, Ball RG, Venot AP, Hindsgaul O, Bundle DR. Eur J Biochem. 1999;259:295–303. [PubMed] [Google Scholar]
- 44.Wolfe S, Whangbo MH, Mitchell DJ. Carbohydr Res. 1979;69:1–26. [Google Scholar]
- 45.Jeffrey, G. A. (1997) An Introduction to Hydrogen Bonding: Topics in Physical Chemistry (Truhlar, D G, ed) p 12, Oxford University Press, Oxford
- 46.Kirkeby S, Moe D. Immunol Cell Biol. 2001;79:121–127. doi: 10.1046/j.1440-1711.2001.00992.x. [DOI] [PubMed] [Google Scholar]


