

Abstract
Objective
Identify sociodemographic characteristics and health performance variables associated with frailty in Mexican American older adults.
Design
A prospective population-based survey.
Setting
Homes of older adults living in the Southwest.
Participants
621 non-institutionalized Mexican American men and women aged 70 and older included in the Hispanic Established Population Epidemiological Study of the Elderly (EPESE) participated in a home based interview.
Interventions
None
Measurements
Interviews included information on sociodemographics, self-reports of medical conditions (arthritis, diabetes, heart attack, hip fracture, cancer, and stroke) and functional status. Weight and measures of lower and upper extremity muscle strength were obtained along with information on activities of daily living and instrumental activities of daily living. A summary measure of frailty was created based on weight loss, exhaustion, grip strength and walking speed. Multivariable linear regression identified variables associated with frailty at baseline. Logistic regression examined variables predicting frailty at one year follow-up.
Results
Gender was associated with frailty at baseline (F = 4.28, p = .03). Predictors of frailty in men included upper extremity strength, disability (activities of daily living), comorbidites and mental status scores (Nagelkerke R2 = 0.37). Predictors for women included lower extremity strength, disability (activities of daily living) and body mass index (Nagelkerke R2 = 0.29). At one year follow-up 83% of males and 79% of females were correctly classified as frail.
Conclusion
Different variables were identified as statistically significant predictors of frailty in Mexican American men and women over 70 years of age. The prevention, development and treatment of frailty in Mexican American older adults may require consideration of the unique characteristics of this population.
Frailty is an important health problem associated with institutionalization and mortality in older adults.1-4 A survey of community dwelling older adults revealed rates for frailty ranging from five percent for persons 65 years of age, to 56 percent for persons 90 years and older.5,6 Exact incidence and prevalence values are difficult to determine because of inconsistencies in how frailty is defined.7,8 Fried and colleagues9 argue that the terms frailty, disability and comorbidity are “commonly used interchangeably to identify vulnerable older adults” and this has caused confusion in the professional and research literature.
Defining Frailty
Several comprehensive reviews of frailty have been published.1,3,4,10 Brown and coworkers11 define frailty as “diminished ability to carry out the important practical and social activities of daily living.” Frailty is often described in general terms such as “an excess demand posed upon reduced capacity,”10 “a condition in individuals lacking strength,”12 or “a state that puts the person at risk for adverse health outcomes.”4 These definitions all connote diminished reserve capacity and, thereby, increased risk.13,14
Fried and Walston3 proposed a cycle of frailty and identified operational criteria for assessing frailty. We used a modified version of these criteria15 to examine frailty in Mexican American older adults. They represent the most widely used method to define frailty in the geriatric/gerontology literature.15 We realize, however, that disagreement and inconsistencies exist regarding how to define frailty.1,4,16
Frailty in Minority Populations
The number of Hispanic older adults is expected to grow dramatically over the next two decades. By 2020, the Hispanic older population in the U.S. will grow by 76%, compared to 38% for non-Hispanic White and 34% for African American older adults.17,18 A large portion of this increase will occur in persons 80 years of age and above.
Research on frailty and disability in minority and underserved populations is lacking despite strong evidence of cultural and physiological differences among racial and ethnic groups.19,20 For example, Hispanic older adults have a significantly higher incidence of diabetes and obesity and their access and use of health care services is different than non-Hispanic whites.20,21 A recent meta-analysis of the Frail and Injuries: Cooperative Studies of Intervention Techniques (FICSIT) trials reveals that greater than 90 percent of the participants from four of the seven FICSIT study sites were non-Hispanic white. Only San Antonio had a sample that was less than 80 percent non-Hispanic white (72 percent were non-Hispanic white).22 After reviewing the existing incidence and prevalence estimates for frailty, Bortz1 concluded that “public health implications of these statistics command increasing attention, particularly because frailty has been documented not to be inevitable and is reversible by active intervention strategies.”
The purpose of this study was to provide a systematic examination of frailty in a large, well-defined sample of Mexican American older adults. We hypothesized that increasing age, decreasing muscle strength, and increasing number of comorbid conditions would be significantly associated with increased frailty in Mexican American older adults.
METHODS
Sample and Procedures
The sample for the current study is a subsample from the Hispanic Established Populations for Epidemiologic Study of the Elderly (EPESE). The Hispanic EPESE is a longitudinal study of Mexican Americans aged 65 and over residing in Texas, New Mexico, Colorado, Arizona and California. Subjects were identified by area probability sampling procedures that involved selecting counties, census tracts, and households within defined census tracts. The sampling procedure assured a sample generalizable to approximately 500,000 older Mexican Americans living in the southwest.23,24 Sampling procedures and characteristics have been reported previously.23,24 The response rate at baseline (1993-94) was 83% (n = 2,873 interviews in person; n = 177 interviews by proxy). The subjects were examined in their homes by interviewers trained by Harris Interactive, Inc. staff and by Hispanic EPESE investigators. The interviews were conducted in Spanish or English, depending on the respondent’s preference.
Harris Interactive, Inc. interviewers followed up the original 3,050 subjects at approximately two-year intervals. Live interviews at Wave 2 were conducted with 2,439 of the subjects (80%). Of these, 143 were proxy interviews. At Wave 3, 1,981 respondents were re-interviewed, including 147 proxy interviews. Finally, at Wave 4, 1,683 respondents were re-interviewed with 134 proxies.
Subsample
After Wave 3 data were collected, we created a list of respondents who reported having Medicare coverage at either Wave 1 or Wave 2. This represented approximately 81% of the sample at Wave 3, all of whom were 70 years and older. From this group of respondents, 800 were randomly selected to be the sample for a substudy focusing on the link between acculturation, disability, and health-related quality of life (R01-AG17638). Respondents who had Medicare coverage were chosen due to the intent of the investigators to link the substudy data with Medicare claims data. The substudy “piggy-backed” with the Hispanic EPESE on Wave 4 (2000-2001), where the respondents selected for the substudy had additional measures and interview questions. Of the 800 respondents selected, 621 subjects completed the interviews. The remaining 179 respondents included those who refused to participate and those with proxy interviews. We did not allow proxy interviews due to the physical nature of some of the measurements in the substudy (see description below).25
One year later, the 621 subjects were contacted and re-assessed using the same instruments and interview questions. Five hundred and fifty-one (89%) of the respondents completed the interviews and assessments at one year follow-up. The relationship of the sub-study to the Hispanic EPESE is presented in Figure 1.
Figure 1.
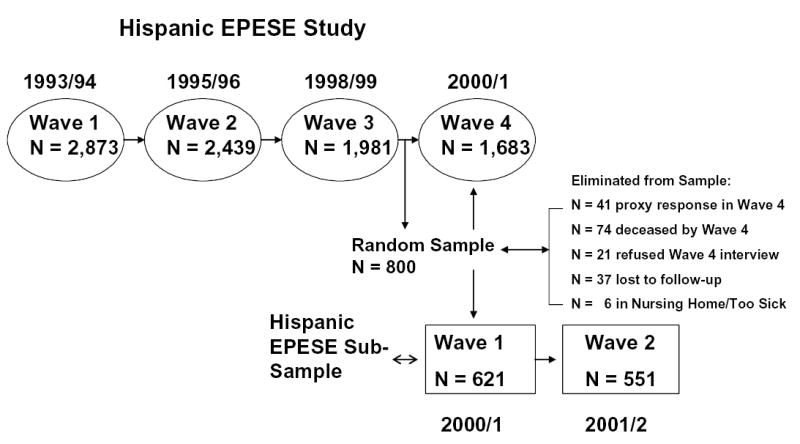
Time-line showing data collection for Hispanic Established Populations for Epidemiologic Study of the Elderly (EPESE) and sub-study.
Dependent Variable
Frailty
Frailty was assessed according to a modified version of the Fried and Walston Frailty Index.3 The modified scale has a range of 0 to 4 and includes weight loss, exhaustion, walking speed, and grip strength. Weight loss was calculated as the difference between weight at the previous interview and current weight. Subjects with unintentional weight loss of > 10 lbs were categorized as positive for the weight loss criterion (score = 1). Exhaustion was assessed using two items from the Center for Epidemiologic Studies - Depression (CES-D) scale -- “I felt that everything I did was an effort” and “I could not get going.” The items asked “How often in the last week did you feel this way?” 0 = rarely or none of the time (<1 day), 1 = some or a little of the time (1-2 days), 2 = a moderate amount of the time (3-4 days), or 3 = most of the time (5-7 days).26 Subjects answering “2” or “3” to either of these two items were categorized as positive for the exhaustion criterion (score = 1). Walking speed was assessed over an 8-foot walk. Subjects unable to perform the walk or who recorded walking speeds of ≥ 9.0 seconds (≥ 75th percentile) were categorized as positive for the short walk criterion (score = 1). Grip strength was assessed by different criteria for men and women. Men and women unable to perform the grip strength test, and those who registered a grip strength of 21 kg or less (≤ 25th percentile) for men or 14 kg or less (≤ 25th percentile) for women were categorized as positive for the grip strength criterion (score = 1). The summary frailty score ranged from 0 to 4 with a higher score indicating increased frailty. Subjects who scored 0 on the summary frailty scale were categorized as not-frail. Subjects scoring 1 were considered pre-frail and those scoring 2, 3 or 4 were categorized as frail. The original frailty scale has shown good predictive validity among older (≥ 65 years of age) white and African American men and women.3 The original scale was predictive of incident outcomes including falls, worsening mobility or ADL function, hospitalization, and death.15
Independent Variables
Muscle strength
Strength measurements were performed using a hand-held device (Nicholas Manual Muscle Tester, Lafayette Instruments, Lafayette, IN) to assess muscle strength. The peak strength (in kilograms) required to break an isometric contraction was measured as the examiner applied force against the subject. This muscle tester is designed to be used with larger muscle groups of the upper and lower extremities. A load cell in the device provides digital output ranging from 0.0 to 199.9kg (equivalent to approximately 440 lbs). The unit is placed between the examiner’s hand and the limb being tested. The intraclass correlation coefficient for muscle strength in this population ranged from 0.83 to 0.96.27 The test was administered by a trained interviewer, and three trials were performed with the highest of the three trials used for analysis. The subjects were tested in three lower extremity positions (hip abduction, hip flexion and knee extension) and two upper extremity positions (shoulder abduction at 0 degrees and 90 degrees). The upper extremity positions tested large muscles in shoulder in contrast to grip strength which is a component of the frailty index. We found low correlations between grip strength and muscle testing of the upper extremity (males, r = 0.16; females, r = 0.14, see additional information in Results section). Details regarding the testing protocol and positions are described in a previous publication.27
Disability (Activities of Daily Living and Instrumental Activities of Daily Living)
Respondents were asked if they needed help doing ADL or IADL tasks from a modified version of the Katz Activities of Daily Living scale, which include bathing, grooming, dressing, eating, transferring from bed to chair, and toileting.28 If respondents indicated that they needed help or were unable to do a task, then they were scored as having an ADL disability. For the IADL items, respondents were asked if they were able to do ten activities based on the OARS Instrumental Activities of Daily Living Scale29 and the Rosow-Breslau scale.30 These activities included using a telephone, driving, shopping, preparing meals, performing light housework, taking medications, handling money, doing heavy housework, walking up and down stairs, and walking half a mile. If respondents were not able to complete any of the tasks, they were coded as having an IADL disability.
A summary score for both ADL and IADL variables was available. The correlation between the ADL and IADL measures was high (r = 0.61). In previous research we found a summary ADL/IADL measure was a sensitive and reliable indicator of disability.31,32 The final disability variable was hierarchical with three levels. A score of 0 indicated no Activity of Daily Living or Instrumental Activity of Daily Living limitation; 1 indicated any IADL limitation (i.e., needing help with instrumental activities such as shopping, taking medication, using transportation) or a mobility-related ADL limitation (e.g., needing help walking across a room); and 2 indicated a basic ADL limitation (i.e., needing help bathing or toileting).
Cognitive Function
The Mini Mental State Examination (MMSE) is a 30-item instrument used to assess cognitive function. It is among the most frequently used cognitive screening measures in studies of older adults.33 The English and Spanish versions of the MMSE were adopted from the Diagnostic Interview Schedule (DIS) and have been used in prior community surveys.34 Scores have a potential range of 0 to 30, with lower scores indicating poorer cognitive ability. MMSE scores were used as a continuous variable (range= 5-30) and as a dichotomized variable (< 21 vs. ≥ 21).20
Body Mass Index (BMI)
Body mass index was calculated in the standard manner by dividing weight in kilograms by height in meters squared.
Sociodemographic Variables
Sociodemographic factors included age, gender, marital status, years of school completed, financial strain, and household size. Age was used as a continuous variable (≥ 70 years). Marital status was coded as married, single (never married), separated, divorced, or widowed, and was recoded into two categories -- currently married and unmarried. Years of schooling completed was used as a continuous variable. Subjects were asked if they ever had a physician diagnosis of heart attack, stroke, arthritis, cancer, hip fracture or diabetes. The number of prevalent medical conditions was summed with a potential range of 0 to 6. We also included measures of financial strain and household structure. Financial strain was based on a question that assessed how much difficulty respondents had in meeting monthly bill payments – 1 indicated a great deal; 2 indicated some; 3 indicated a little; and 4 indicated none. Household structure was measured through household size, with a range of 1 to 5 persons (a few households had more than 5 people but we included these with the 5-person households).
Data Analysis
We examined the distribution of variables for all subjects using descriptive and univariate statistics for continuous variables and contingency tables (chi-square) for categorical variables. All strength measures were first normalized by dividing the absolute measurement by the subject’s weight in kilograms. We created a summary score of the three individual lower extremity strength measures and two upper extremity measures because the individual strength scores were highly correlated (r = 0.84 - 0.96). Previous researchers35,36 have found that summing strength scores gave a statistically better model of the relationship between muscle strength and functional task than using individual scores.
Two multivariable linear regression models were computed to predict frailty score at baseline. The first model included the sociodemographic variables of gender, age, education, marital status, financial strain, and number of persons in the household. In the second model, performance and health status variables were added to the regression equation. These included lower extremity strength, upper extremity strength, total number of comorbid conditions, MMSE, disability (ADL/IADL) score, and BMI. These variables were selected based on clinical importance and previous research with non-Hispanic populations. All variables were entered as a block with criteria of p < .20 selected to identify potential predictor variables. The dependent variable in these regression models (frailty) was entered as a continuous variable.
We computed regression diagnostics for all models.37 A potential limitation of regression analysis is multicollinearity. We computed a covariance matrix including all continuous independent variables. The results of the covariance matrix revealed redundancy between lower and upper extremity strength measures. The correlation was different for males (r = 0.70) and females (r = 0.56 ). We felt it was important to examine the impact of the upper and lower extremity muscle strength on frailty even though these two variables were correlated. We computed different regression models for males and females – one including upper extremity strength and one including lower extremity muscle strength. A final model including both upper and lower extremity strength was also computed for males and females. The order of relationships strength (shared variance) did not differ across the models. We report only the models with both upper and lower extremity strength measures included.
Variables meeting the p < .20 criterion in the multiple regression for baseline measures were used in logistic regression models to predict frailty status at one year follow-up. Participants were categorized as not frail (score = 0), pre-frail (score = 1) or frail (score >1) for the logistic regression at one year follow-up. The logistic regression generated Hosmer-Lemshow goodness-of-fit statistics, Wald values and classification tables. Classification tables were computed using the predicted probabilities for the validation model from the logisitic regression analyses. To improve the sensitivity of the classification analyses only subjects identified as not frail (score = 0) or frail (score > 1) were included in the classification analyses. This also allowed us to maintain the 2x2 tables. Classification tables were computed for males and females and included percentage of persons correctly classified, sensitivity, specificity, and positive predictive value and negative predictive value for males and females.
RESULTS
Information on subject characteristics, sociodemographics, physical performance and frailty related variables is presented in Table 1. Fifty-nine percent of the subjects were female and the average age was 78.1 years (SD = 5.1). Statistically significant differences (p < .05) were found between males and females for lower extremity strength, upper extremity strength, disability, marital status, and frailty category.
Table 1.
Subject characteristics and demographic variables for Mexican American older adults included in the sample.
| Variable | Female | Male | Total |
|---|---|---|---|
| N | 369 (59%) | 252 (41%) | 621 |
| Age (mean,±SD) | 78.1 (5.1) | 78.0 (5.2) | 78.1 (5.1) |
| Education | 5.1 (3.9) | 5.1 (3.8) | 5.1 (3.6) |
| Household | 2.1 (1.1) | 2.3 (1.0) | 2.2 (1.1) |
| LE Strength*(kgs) | 24.6 (8.5) | 34.9 (11.7) | 28.9 (11.1) |
| UE Strength*(kgs) | 12.6 (5.1) | 19.9 (7.4) | 15.6 (7.2) |
| Comorbid | 2.4 (1.2) | 2.1 (1.2) | 2.3 (1.2) |
| MMSE | 23.2 (5.3) | 23.4 (5.4) | 23.3 (5.2) |
| Married (N, %)* | 128 (35%) | 189 (75%) | 317 |
| Disability* | |||
| None | 166 (45%) | 159 (63%) | 325 |
| IADL | 138 (38%) | 68 (27%) | 206 |
| ADL | 64 (17%) | 26 (10%) | 90 |
| BMI | 28.2 (5.7) | 28.0 (5.0) | 28.1 (5.5) |
| Frailty Score (mean, ±SD) | 1.9 (0.9) | 1.7 (0.9) | 1.8 (0.9) |
| Frailty Category* | |||
| Not Frail | 148 (40%) | 125 (50%) | 273 (44%) |
| Pre-Fail | 141 (38%) | 83 (33%) | 224 (36%) |
| Frail | 80 (22%) | 44 (17%) | 124 (20%) |
p < .05
Legend
Education = Years of education
Household = Number of family members in household
UE Strength = Upper extremity strength (shoulder abduction, flexion)
LE Strength = Lower extremity strength (hip abduction, hip flexion, knee extension)
Comorbid = Number of comorbid conditions (heart attack, stroke, cancer, diabetes, arthritis, hip fracture).
MMSE = Mini Mental State Exam provides a general screening for cognitive deficits in memory, awareness, attention or executive function. Score range for sample 5-30.
IADL = Instrumental Activities of Daily Living (e.g. driving, using the telephone, shopping, etc.)
ADL = Activities of Daily Living (e.g. bathing, dressing, eating, etc.)
BMI = Body Mass Index computed as weighted divided by height (BMI = kg/m2)
Figure 2 shows the difference in males and females for a subset of the sample who had disability (> 1 ADL), comorbidity (> 2 diseases/conditions), or were identified as pre-frail or frail (frailty index >= 1). The largest difference occurred in the intersection between disability and comorbidity (25% for males versus 41% females). Females tended to have both more comorbidity (77% versus 62%) and more disability (49% versus 34%) in this sample. Females were also more likely (23% versus 16%) to be in the center of the Venn diagram indicating comorbidity, disability and frailty (see Figure 2). Age did not appear to be a contributing factor in these differences (males mean age = 78.0 years; females = 78.1 years).
Figure 2.
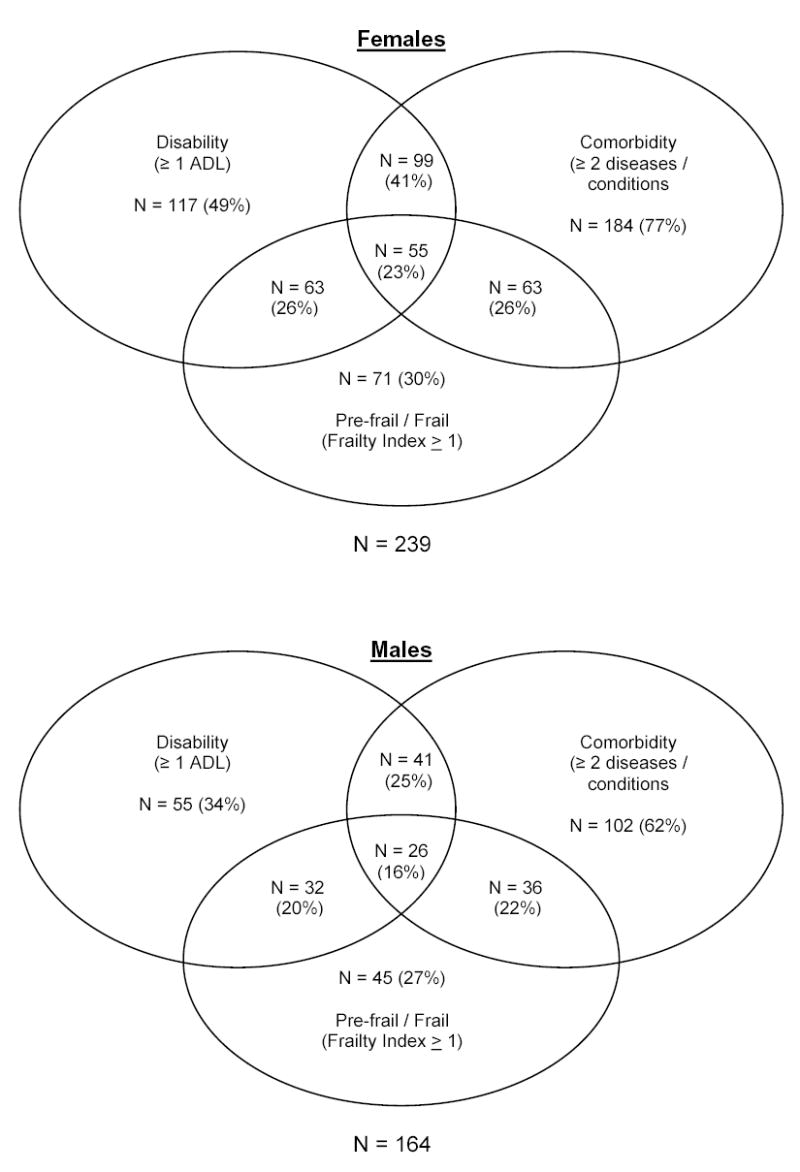
Prevalence and overlaps of frailty, disability and comorbidity among sample of Mexican American older adults
Two regression equations were generated. The first included sociodemographic variables and the second included sociodemographic and performance variables. There were seven variables in Model 2 that met the p < .20 criterion and were considered potential predictor variables for examining frailty at one year follow-up. Gender was a statistically significant variable in Model 1. Based on this finding and the statistically significant difference in frailty category by gender (Table 1), we computed separate logistic regression models for males and females to predict frailty status at one-year follow-up.
Table 2 includes the logistic regression results for males and females. The model for males includes four statistically significant independent variables including disability (ADL/IADL score), upper extremity strength, comorbidity and MMSE. The Nagelkerke R2 for the model was 0.37, suggesting that the combination of statistically significant independent variables explained 37% of the variance in the summary frailty score for males. Lower extremity strength approached statistical significance (p = 0.08) for males. The logistic regression model for females included three statistically significant variables, disability (ADL/IADL), lower extremity strength, and BMI. The Nagelkerke R2 for this model was .29. In the model for females, age (p = 0.06) and MMSE total score (p = 0.09) approached statistical significance.
Table 2.
Variables in logistic regression model to predict frailty at one-year follow-up in Mexican American older adults by gender
| Males |
||||
|---|---|---|---|---|
| Variable | b | SE | Wald | p-value |
| Age | -.04 | .04 | 1.32 | .25 |
| Disability | 1.28 | .30 | 17.86 | <.01 |
| Comorbidity | .28 | .14 | 3.94 | .04 |
| LE Strength | .06 | .02 | 2.91 | .08 |
| UE Strength | -.07 | .03 | 4.51 | .03 |
| MMSE | -.53 | .03 | 3.78 | .05 |
| BMI | .01 | .03 | 0.16 | .81 |
|
Females |
||||
| Age | .06 | .03 | 3.53 | .06 |
| Disability | 1.18 | .23 | 26.50 | <.01 |
| Comorbidity | .05 | .12 | 0.15 | .74 |
| LE Strength | .08 | .04 | 3.95 | .04 |
| UE Strength | .05 | .02 | 0.18 | .71 |
| MMSE | -.05 | .03 | 2.86 | .09 |
| BMI | -.06 | .03 | 5.39 | .02 |
Legend
Disability = Rated as: 0 = no activity of daily living (ADL) or instrumental activity of daily living (IADL) deficit; 1 = any IADL limitation; and 2 = any ADL limitation
Comorbidity = Number of comorbid conditions (heart attack, stroke, cancer, diabetes, arthritis, hip fracture)
MMSE = Total score on Mini Mental State Exam
UE Strength = Upper extremity strength (shoulder abduction and flexion)
LE Strength = = Lower extremity strength (hip abduction, hip flexion, knee extension)
BMI = Body mass index computed by weight divided by height (BMI = kg/m2).
We found differences in the relationship between muscle strength and several variables based on gender. The correlation between lower and upper extremity strength was high in both males and females (0.70 and 0.56, respectively), but there was a significant difference in the correlation between upper extremity strength and frailty in females (-0.07) and males (-0.35).
We also examined the relationship between grip strength and upper and lower extremity muscle strength for males and females. In both males and females, grip strength was weakly correlated with upper extremity muscle strength (males, r = 0.16; females, r = 0.14) and lower extremity muscle strength (males, r = 0.19; females, r = 0.21).
Walking speed was collected as part of the investigation but not included as an independent variable in the regression models because it is a component of the frailty index.3 In a separate analysis, we found that the correlation with walking speed and lower extremity strength was stronger for females (r = 0.26) than for males (r = 0.15).
To further examine the predictive validity of the logistic regression equations, we computed classification tables for subjects at one year follow-up who scored 0 (n = 273) and were classified as not frail, and subjects with scores > 1 (n = 124) who were categorized as frail. Subjects with a score of 1 (pre-frail, n = 154) were not included in this analyses. Table 3 includes the classification results for males and females. The table indicates that 83% of male subjects were correctly classified as frail at one year follow-up. The correct classification rate for females was 79%. The sensitivity, specificity, and positive and negative predictive values are also included in Table 3 for males and females.
Table 3.
Classification results for logistic regression models conducted on males and females to predict frailty at one year follow-up.
|
Males | ||
|---|---|---|
|
Actual Status* |
||
| Predicted Status | Frail | Not Frail |
| Frail | 38 (23%) | 19 (12%) |
| Not Frail | 8 (5%) | 99 (60%) |
| Model correctly classified 83% of cases. Sensitivity = 83%, specificity = 84%, positive predictive value = 66%, negative predictive value = 92%. | ||
|
Females | ||
|
Actual Status* |
||
| Predicted Status | Frail | Not Frail |
| Frail | 48 (21%) | 29 (12%) |
| Not Frail | 20 (9%) | 131 (58%) |
| Model correctly classified 79.0% of cases. Sensitivity = 71%, specificity = 82%, positive predictive value = 62%, negative predictive value = 87%. | ||
Subjects with score of 1 (pre-frail) were not included in the classification analysis.
DISCUSSION
The goal of this investigation was to provide a systematic examination of frailty in a large sample of Mexican American older adults. We hypothesized that older age, lower measures of muscle strength, and increased number of comorbid conditions would be significantly associated with higher rates of frailty in this sample. Age was significant in the model including only sociodemographic variables. When the performance variables were added to the model, age was not statistically significant (Table 2). In the logistic regression models for males and females, age was not statistically significant. The age range of the sample was narrow (72 to 96 years) and the reduced variability may have contributed to the absence of statistical significance.
As hypothesized, measures of muscle strength were significant predictors of frailty. While we expected differences between males and females in muscle strength, we did not expect differences in upper and lower extremity strength related to frailty between males and females. Previous research has frequently identified frailty as being more common in females. In their widely cited study, Fried et al.15 found persons classified as frail in the Cardiovascular Health Study were more likely to be older, female, and have higher rates of disability and comorbidity. In a comprehensive review of criteria for identifying frailty, Hogan and others38 discuss several investigations in which females were more often identified as frail using a number of different, but related definitions. Disability rates are also generally reported as higher in females, even following adjustments for age and comorbidity.39 Few studies have examined the direct relationship between muscle strength and frailty. Evidence relating the loss of muscle mass to functional impairment and physical disability has reported relatively greater loss and impairment in women, particularly in the lower extremities. The connection between muscle loss and objective measures of muscle strength in relation to frailty has not been comprehensively explored, particularly in the Hispanic population.
We found lower extremity strength was a significant predictor of frailty at one year follow-up for females, but not for males. In contrast, upper extremity strength was a statistically significant predictor for males. Syddall 40 found that grip strength was a more sensitive predictor of frailty than age for both males and females, but the relationship between grip strength and frailty was 40% stronger in males. Measures of lower extremity function (balance, chair stands, walking) have previously been shown to demonstrate high correlations with disability, decreased community function and mortality in both Hispanic and non-Hispanic white samples.31,32,39
There are at least three important differences between our study and previous investigations examining predictors of frailty. First, we examined upper extremity strength using a field based muscle test for the larger muscles of the shoulder. Previous studies frequently used grip strength or some form of lifting task. Grip strength was weakly correlated with upper extremity muscle strength as measured in our study, for males r = 0.16, and females r = 0.14. Second, the majority of earlier studies did not examine muscle strength measures as predictors of frailty or disability separately for males and females. Third, most previous studies of frailty have been conducted on samples of non-Hispanic white subjects. We are not aware of any previous study examining muscle strength and frailty in a large sample of Mexican American older adults.
Other significant predictors in the logistic regression models included disability and MMSE total score. Disability, as measured by a summary score of ADL and IADL tasks, was a statistically significant predictor of frailty status at one-year follow-up for males and females. The association between disability and frailty is well established.9,41 The relationship between MMSE and frailty was statistically significant for males, but not for females. Cognitive measures are not usually included in measures of frailty. The Frailty Index15,42 used in this study did not include any direct measure of cognitive function. The Cycle of Frailty proposed by Fried and colleagues15 includes social functions and cognitive ability as elements of the cycle, but these components are not directly assessed in computing the Frailty Index. Other authors have argued that cognitive function and psychosocial attributes are essential components of frailty and should be quantified. For example, Markle-Reid and Browne43 recently reviewed conceptual models of frailty and concluded that there is a need for a broader theoretical approach to studying frailty that includes cognitive, psychological, and environmental factors. Our results suggest the need to consider the impact of frailty on cognitive function, and cognition on frailty.
The final regression equations explained approximately 37% of the variance in frailty scores for males compared to only 29% explained variance for females. Upper extremity muscle strength was an important contributor predicting frailty in males, but not in females; while lower extremity muscle strength was a significant predictor in females, but not males. The finding for lower extremity muscle strength approached statistical significance (p = .08) in males. If the sample size for males (n = 252) were equivalent to that of the females (n = 369), the result for lower extremity muscle strength may have reached statistical significance. Previous examinations of frailty have not reported a distinction between upper and lower extremity strength in examining frailty. The widely used frailty index proposed by Walston and Fried42 includes a measure of grip strength and measure of walking a short distance (16 feet). While walking speed implies some level of lower extremity strength, walking is a complex physical activity involving many factors. One possible interpretation of our results is that walking speed is an important component of lower extremity muscle strength in women, but less so in men. This is an area that requires further investigation.
The number of comorbid conditions was a statistically significant predictor of frailty for males, but not for females in this sample. Persons identified as frail had a mean of 2.6 (SD = 1.3) comorbid conditions and those identified as not frail had a mean of 2.2 (SD = 1.3) comborbid conditions. Females reported more comorbid conditions than males (female mean = 2.4 versus male mean = 2.1) but variability for both males (SD = 1.21) and females (SD = 1.23) were similar. Previous investigators have found comorbid conditions to be associated with increased risk for frailty.15,41,44 These studies did not examine (or report) comorbidities separately for males and females and other studies have used different methods to determine comorbidity. We counted the number of medical conditions reported by the subjects. Previous investigations have assessed comorbidity by obtaining information from medical records or using a standardized instrument to examine health conditions.15,44 In a recent review, Fried and colleagues examined the relationship among disability, frailty and comorbidity. Their analysis of data from the Cardiovascular Heart Study and Women’s Health and Aging Study led them to conclude that frailty is distinct from, but overlapping with both comorbidity and disability. Both frailty and comorbidity predicted disability. It will be important to replicate the finding from this investigation that comorbidity was a significant predictor for frailty in males, but not for females in Mexican American older adults.
The current study has several limitations. First, the database did not have information on activity level, and consequently, our frailty index ranged from 0 to 4 rather than from 0 to 5, as in the original scale.42 As a result, our findings may underestimate the number of subjects classified as frail. Another limitation is our reliance on self-reported data for disability (ADL/IADL) and comorbidities. Hughes et al.45 examined the extent and nature of bias associated with self-reported versus standardized physician examination-based accounts of musculoskeletal and other diseases in a sample of 406 older persons. Overall, their results indicate that self-reports are valid for common medical conditions such as heart attack, stroke, and arthritis experienced by persons greater than 65 years of age.
While our classification analyses (see Table 3) were relatively efficient, correctly identifying approximately 80% of the cases, these analyses did not include persons identified as pre-frail (those with a frailty index score = 1). The sensitivity of the model would have been reduced if these subjects were included in the “not frail” group. Finally, the variance explained in the models is moderate (0.37 for males, 0.29 for females). As noted previously, definitions of frailty are continuing to evolve and as these definitions become refined, researchers will better understand the components of frailty and we expect that the sensitivity of classification analyses and prediction models will improve.
Our study also has several strengths including its large community-based sample, its prospective design, and its use of an operationally defined measure of frailty. Additionally, this study was the first, to our knowledge, to examine the association of frailty, functional status and sociodemogrpahic characteristics in Mexican American older adults.
In summary, we found different combinations of variables were statistically significant predictors of frailty in Mexican American men and women over 70 years of age. Upper extremity strength, comorbidities and MMSE were associated with frailty in men, but not in women. Lower extremity strength, BMI and disability were statistically significant variables in females. Disability (ADL/IADL) was the best single predictor of frailty status at one-year follow-up for both men and women. Mexican American older adults are a rapidly growing population that requires continued investigation to determine optimal strategies for the prevention, identification and treatment of frailty.
Acknowledgments
The research was supported by grants from the National institute on Aging, National Institutes of Health, including R01 AG17638, K02 AG019736 and P60-AG17231 (Ottenbacher), R01 AG10939 (Markides).
Footnotes
Author Contributions: Kenneth J. Ottenbacher -- obtain funding, development of the research design, analyses, inpterpretation and prepararation of drafts.
Glenn V. Ostir -- asist with data analysis, writing of results, review of drafts.
M. Kristen Peek, data collection and training, review and revise drafts.
Soham Al Snih -- assist in writing methods section, interpretation of data analyses.
Mukaila A. Raji -- review and revise drafts, interpretation of data analysis.
Kyriakos S. Markides -- research design, obtaining funding, review and revise drafts.
Financial Disclosure(s): Kenneth J. Ottenbacher No financial interest, stock or derived direct financial benefit.
Glenn V. Ostir No financial interest, stock or derived direct financial benefit.
M. Kristen Peek No financial interest, stock or derived direct financial benefit.
Soham Al Snih No financial interest, stock or derived direct financial benefit.
Mukaila A. Raji No financial interest, stock or derived direct financial benefit.
Kyriakos S. Markides No financial interest, stock or derived direct financial benefit.
Sponsor’s Role: The National Institute on Aging and National Institutes of Health had no direct influence in the design, methods, subject recruitment, data collections, analysis and preparation of the paper.
References
- 1.Bortz WM. A conceptual framework of frailty: a review. J Gerontol A Biol Sci Med Sci. 2002;57:M283–M288. doi: 10.1093/gerona/57.5.m283. [DOI] [PubMed] [Google Scholar]
- 2.Balducci L, Stanta G. Cancer in the frail patient: a coming epidemic. Hematol Oncol Clin North Am. 2000;14:235–50. doi: 10.1016/s0889-8588(05)70286-0. xi. [DOI] [PubMed] [Google Scholar]
- 3.Fried LP, Walston J. Frailty and failure to thrive. In: Hazzard W, Blass J, Ettinger WH, Halter J, Ouslander J, eds. Principles of Geriatric Medicine and Gerontology. New York: McGraw-Hill Professional, 1999: 1387-1402.
- 4.Hamerman D. Toward an understanding of frailty. Ann Intern Med. 1999;130:945–950. doi: 10.7326/0003-4819-130-11-199906010-00022. [DOI] [PubMed] [Google Scholar]
- 5.Brody KK, Johnson RE, Douglas RL. Evaluation of a self-report screening instrument to predict frailty outcomes in aging populations. Gerontologist. 1997;37:182–191. doi: 10.1093/geront/37.2.182. [DOI] [PubMed] [Google Scholar]
- 6.American Medical Association white paper on elderly health. Report of the Council on Scientific Affairs. Arch Intern Med. 1990;150:2459–2472. [PubMed] [Google Scholar]
- 7.Cohen HJ. In search of the underlying mechanisms of frailty. J Gerontol A Biol Sci Med Sci. 2000;55:M706–M708. doi: 10.1093/gerona/55.12.m706. [DOI] [PubMed] [Google Scholar]
- 8.Gillick M. Pinning down frailty. J Gerontol A Biol Sci Med Sci. 2001;56:M134–M135. doi: 10.1093/gerona/56.3.m134. [DOI] [PubMed] [Google Scholar]
- 9.Fried LP, Ferrucci L, Darer J, et al. Untangling the concepts of disability, frailty, and comorbidity: implications for improved targeting and care. J Gerontol A Biol Sci Med Sci. 2004;59:255–263. doi: 10.1093/gerona/59.3.m255. [DOI] [PubMed] [Google Scholar]
- 10.Powell C. Frailty: help or hindrance? J R Soc Med. 1997;90 (Suppl 32):23–26. doi: 10.1177/014107689709032s07. [DOI] [PMC free article] [PubMed] [Google Scholar]
- 11.Brown I, Renwick R, Raphael D. Frailty: constructing a common meaning, definition, and conceptual framework. Int J Rehabil Res. 1995;18:93–102. [PubMed] [Google Scholar]
- 12.Buchner DM, Wagner EH. Preventing frail health. Clin Geriatr Med. 1992;8:1–17. [PubMed] [Google Scholar]
- 13.Karlamangla AS, Singer BH, McEwen BS, et al. Allostatic load as a predictor of functional decline MacArthur studies of successful aging. J Clin Epidemiol. 2002;55:696–710. doi: 10.1016/s0895-4356(02)00399-2. [DOI] [PubMed] [Google Scholar]
- 14.Seeman TE, Singer BH, Rowe JW, et al. Price of adaptation: allostatic load and its health consequences. MacArthur studies of successful aging. Arch Intern Med. 1997;157:2259–2268. [PubMed] [Google Scholar]
- 15.Fried LP, Tangen CM, Walston J, et al. Frailty in older adults: evidence for a phenotype. J Gerontol A Biol Sci Med Sci. 2001;56:M146–M156. doi: 10.1093/gerona/56.3.m146. [DOI] [PubMed] [Google Scholar]
- 16.Brown M, Sinacore DR, Binder EF, et al. Physical and performance measures for the identification of mild to moderate frailty. J Gerontol A Biol Sci Med Sci. 2000;55:M350–M355. doi: 10.1093/gerona/55.6.m350. [DOI] [PubMed] [Google Scholar]
- 17.Day JC. Population projections of the United States, by age, sex, race, and Hispanic origin : 1995 to 2050. Publication P25-1130. 1996. Washington, DC, US Dept. of Commerce, Bureau of the Census. Current population reports.
- 18.Kent MM, Mather M. What drives U.S. population growth? Population Bulletin 57. 2002. Washington, D.C., Population Reference Bureau.
- 19.Dunlop DD, Song J, Manheim LM, et al. Racial disparities in joint replacement use among older adults. Med Care. 2003;41:288–298. doi: 10.1097/01.MLR.0000044908.25275.E1. [DOI] [PubMed] [Google Scholar]
- 20.Gornick ME, Eggers PW, Reilly TW, et al. Effects of race and income on mortality and use of services among Medicare beneficiaries. N Engl J Med. 1996;335:791–799. doi: 10.1056/NEJM199609123351106. [DOI] [PubMed] [Google Scholar]
- 21.Sotomayor M, Garcia A. Elderly Latinos: Issues and Solutions for the 21st Century. Washington, DC: National Hispanic Council on Aging; 1993.
- 22.Province MA, Hadley EC, Hornbrook MC, et al. The effects of exercise on falls in elderly patients: a preplanned metaanalysis of the FICSIT trials. JAMA. 1995;273:1341–1347. [PubMed] [Google Scholar]
- 23.Markides KS, Stroup-Benham CA, Black SA, et al. The health of Mexican American Elderly: selected findings from the Hispanic EPESE. In: Wykle ML, Ford AB, eds. Serving Minority Elders in the Twenty-first Century. New York, NY: Springer Publishing, 1999: 72-90.
- 24.Markides KS, Stroup-Benham CA, Goodwin JS, et al. The effect of medical conditions on the functional limitations of Mexican-American elderly. Ann Epidemiol. 1996;6:386–391. doi: 10.1016/s1047-2797(96)00061-0. [DOI] [PubMed] [Google Scholar]
- 25.Ottenbacher KJ, Gonzales VA, Smith PM, et al. Satisfaction with medical rehabilitation in patients with cerebrovascular impairment. Am J Phys Med Rehabil. 2001;80:876–884. doi: 10.1097/00002060-200112000-00002. [DOI] [PubMed] [Google Scholar]
- 26.Radloff LS. The CES-D Scale: a self-report depression scale for research in the general population. Appl Psychol Meas. 1977;1:385–401. [Google Scholar]
- 27.Ottenbacher KJ, Branch LG, Ray L, et al. The reliability of upper- and lower-extremity strength testing in a community survey of older adults. Arch Phys Med Rehabil. 2002;83:1423–1427. doi: 10.1053/apmr.2002.34619. [DOI] [PubMed] [Google Scholar]
- 28.Hughes SL, Edelman PL, Singer RH, et al. Joint impairment and self-reported disability in elderly persons. J Gerontol. 1993;48:S84–S92. doi: 10.1093/geronj/48.2.s84. [DOI] [PubMed] [Google Scholar]
- 29.Lamb SE, Guralnik JM, Buchner DM, et al. Factors that modify the association between knee pain and mobility limitation in older women: the Women’s Health and Aging Study. Ann Rheum Dis. 2000;59:331–337. doi: 10.1136/ard.59.5.331. [DOI] [PMC free article] [PubMed] [Google Scholar]
- 30.Jette AM, Branch LG, Berlin J. Musculoskeletal impairments and physical disablement among the aged. J Gerontol. 1990;45:M203–M208. doi: 10.1093/geronj/45.6.m203. [DOI] [PubMed] [Google Scholar]
- 31.Markides KS, Black SA, Ostir GV, et al. Lower body function and mortality in Mexican American elderly people. J Gerontol A Biol Sci Med Sci. 2001;56:M243–M247. doi: 10.1093/gerona/56.4.m243. [DOI] [PubMed] [Google Scholar]
- 32.Ostir GV, Markides KS, Black SA, et al. Lower body functioning as a predictor of subsequent disability among older Mexican Americans. J Gerontol A Biol Sci Med Sci. 1998;53:M491–M495. doi: 10.1093/gerona/53a.6.m491. [DOI] [PubMed] [Google Scholar]
- 33.Folstein MF, Folstein SE, McHugh PR. “Mini-mental state”: a practical method for grading the cognitive state of patients for the clinician”. J Psychiatr Res. 1975;12:189–198. doi: 10.1016/0022-3956(75)90026-6. [DOI] [PubMed] [Google Scholar]
- 34.Bird HR, Canino G, Stipec MR, et al. Use of the Mini-mental State Examination in a probability sample of a Hispanic population. J Nerv Ment Dis. 1987;175:731–737. doi: 10.1097/00005053-198712000-00005. [DOI] [PubMed] [Google Scholar]
- 35.Jette AM, Assmann SF, Rooks D, et al. Interrelationships among disablement concepts. J Gerontol A Biol Sci Med Sci. 1998;53:M395–M404. doi: 10.1093/gerona/53a.5.m395. [DOI] [PubMed] [Google Scholar]
- 36.Brown M, Sinacore DR, Host HH. The relationship of strength to function in the older adult. J Gerontol A Biol Sci Med Sci 1995; 50 Spec No:55-59. [DOI] [PubMed]
- 37.Statistical Package for the Social Sciences [Computer program]. Version 11.0. Chicago, Ill: SPSS; 2001.
- 38.Hogan DB, MacKnight C, Bergman H. Steering Committee - Canadian Initiative on Frailty and Aging. Models, definitions, and criteria of frailty. Aging Clin Exp Res. 2003;15 (3 Suppl):1–29. [PubMed] [Google Scholar]
- 39.Guralnik JM, Ferrucci L, Pieper CF, et al. Lower extremity function and subsequent disability: consistency across studies, predictive models, and value of gait speed alone compared with the short physical performance battery. J Gerontol A Biol Sci Med Sci. 2000;55:M221–M231. doi: 10.1093/gerona/55.4.m221. [DOI] [PubMed] [Google Scholar]
- 40.Syddall H, Cooper C, Martin F, et al. Is grip strength a useful single marker of frailty? Age Ageing. 2003;32:650–656. doi: 10.1093/ageing/afg111. [DOI] [PubMed] [Google Scholar]
- 41.Fried LP, Guralnik JM. Disability in older adults: evidence regarding significance, etiology, and risk. J Am Geriatr Soc. 1997;45:92–100. doi: 10.1111/j.1532-5415.1997.tb00986.x. [DOI] [PubMed] [Google Scholar]
- 42.Walston J, Fried LP. Frailty and the older man. Med Clin North Am. 1999;83:1173–1194. doi: 10.1016/s0025-7125(05)70157-7. [DOI] [PubMed] [Google Scholar]
- 43.Markle-Reid M, Browne G. Conceptualizations of frailty in relation to older adults. J Adv Nurs. 2003;44:58–68. doi: 10.1046/j.1365-2648.2003.02767.x. [DOI] [PubMed] [Google Scholar]
- 44.Mulrow CD, Gerety MB, Cornell JE, et al. The relationship between disease and function and perceived health in very frail elders. J Am Geriatr Soc. 1994;42:374–380. doi: 10.1111/j.1532-5415.1994.tb07484.x. [DOI] [PubMed] [Google Scholar]
- 45.Hughes SL, Edelman P, Naughton B, et al. Estimates and determinants of valid self-reports of musculoskeletal disease in the elderly. J Aging Health. 1993;5:244–263. doi: 10.1177/089826439300500206. [DOI] [PubMed] [Google Scholar]