Abstract
A new variant of lipoxygenases, one containing manganese instead of iron, is characterized by electron paramagnetic resonance (EPR) at two frequencies. In the manganous state (Se = 5/2), maganese lipoxygenase (MnLO) yields very broad X-band (9.2 GHz) EPR signals, extending over about 800 mT. In contrast, at W-band (94 GHz), the signal is much simplified, consisting of nested transitions centered near the free electron g-value. Computer simulation has been employed to derive estimates of the zero-field splittings for MnLO, with data from these two EPR frequencies. The general features of both X- and W-band spectra are fit, first, by simulations with Se = 5/2, but no nuclear hyperfine splitting. The simulations are then refined by inclusion of the hyperfine splitting. On the basis of the simulations, the ranges of zero-field splitting parameters are D = +0.07 to +0.10 cm−1, and E/D = 0.13 to 0.23. Comparison of the value of D for MnLO with that of other manganese-containing proteins suggests that MnLO has three N-ligands to the metal center and O-ligands in the remainder of 6 coordination positions. The coordination environment of MnLO is similar to that in iron lipoxygenases.
1 Introduction
Electron paramagnetic resonance (EPR) of metalloproteins in the genome age provides input in the early stages of characterization of newly discovered proteins. Domains in new proteins bearing some homology to known metalloproteins can be examined by spectroscopy for similarities in redox state, for symmetry of the ligands to the metal center, and for interaction of exchangeable ligands with a metal. In the present example, a new member [1] of the lipoxygenase family of enzymes is characterized by EPR at low frequency and a higher frequency.
Lipoxygenases are widely distributed in eukaryotes and are subjects of pharmacological intervention in human diseases involving inflammation [2]. In plants, expression of different lipoxygenases varies with plant development. The roles of lipoxygenase products in normal cell function in plants and animals are under active investigation, especially with regard to signaling pathways [2]. Taken as a family, various lipoxygenases are selective in the positional and stereochemical course of oxidation of unsaturated fatty acids, and different cell functions are associated with the varied products.
Two redox intermediates contribute to the catalytic cycle of lipoxygenases. The reaction catalyzed, peroxidation of a polyunsaturated fatty acid, involves a redox active metal center, the fatty acid substrate, and oxygen. Electronic changes accompanying lipoxygenase redox cycling are not fully understood [3]. Recently, a new lipoxygenase (MnLO) that contains mononuclear manganese, instead of the usual iron, has been characterized enzymatically and by initial X-band EPR studies [4]. Here, we report further studies of MnLO by EPR at two frequencies, 9.26 GHz (X-band) and 94.1 GHz (W-band). Analysis of the spectra yields estimates of the zero-field splitting parameters that characterize the Mn2+ in MnLO. These values can be compared with those of other manganese-containing proteins (e.g., reduced manganese superoxide dismutase [5], α-keto acid-dependent manganese enzymes [6], manganese in concanavalin A [7], p21 Ras-Mn2+-GTP [8, 9]) to provide an estimate of N- vs. O-ligation to the metal. The group of ligands for known iron lipoxygenases includes at least three histidine nitrogens, one carboxyl oxygen, and the oxygen of one water [3]. A remaining coordination site is variably occupied by an O- or N-ligand.
2 Materials and Methods
Manganese lipoxygenase from Gaeumannomyces graminis was prepared as described [4] and was concentrated by ultrafiltration to approximately 0.5 mM. The ultrafiltration buffer was 28% glycerol in 35 mM potassium phosphate (pH 7.3), 0.1 M sodium chloride, 35 mM methylglucopyranoside, 1 mM EDTA, 3 mM sodium azide. The flow-through from ultrafiltration was used as the buffer control for EPR measurements. X-Band EPR spectra were recorded in 0.4 mm outer diameter quartz tubes (Wilmad 707 SQ) and W-band spectra in quartz capillaries (0.9 mm outer diameter, 0.5 mm inner diameter) sealed at both ends. Neither manganese lipoxygenase solutions nor the buffer blanks were deoxygenated for EPR measurement.
W-band EPR measurements were made on a Bruker ELEXSYS E600 continuous-wave (cw) spectrometer, operating, in these experiments, at temperatures from 9 to 80 K. X-band EPR was measured with a Varian E-109 instrument equipped with an Oxford pumped cryostat providing temperatures from 3 K to ambient. Details of the W-band spectrometer were given in ref. 10. Spectra at 94.1 GHz (W-band) were recorded as the average of increasing and decreasing field scans. Small shifts in the baseline crossing points result from increasing and decreasing scans: for instance, when 8 K points were recorded over 1.2 T in 0.746 h, the crossing points differed by 0.3 mT.
Matrix-diagonalization computer simulations including only the Se = 5/2 transitions, but no hyperfine splitting, were performed on an SGI Unix system with the FORTRAN program developed by Gaffney and Silverstone, with input from Yang, Doctor and Maguire, as described [10, 11]. The line shapes for transitions between energy levels that have extended regions of separation equal to the microwave energy took into account the special considerations for “looping” transitions [12]. Other EPR spectra including ones with manganous nuclear hyper-fine splitting were simulated with the XSophe program marketed by Bruker and developed by G. R. Hanson and co-workers [13]. The figure legends indicate cases in which calculations were performed with XSophe. The calculations in all other figures were performed with the Gaffney/Silverstone [10, 11] program.
3 Results
The EPR spectra of manganese lipoxygenase at 9.26 and 94.1 GHz exhibit intensities at completely different effective g-values (Fig. 1a, b). The shift to a nested set of transitions at W-band establishes that the value of the zero-field splitting parameter, D, is somewhat smaller than the X-band quantum (0.3 cm−1), and provides a starting point for assignment of the spectra for the Se = 5/2 electron manifold. The W-band spectrum in Fig. 1b was recorded at a relatively high power (15.8 μW) and has an absorptionlike shape, indicating that the conditions for “rapid passage” [14] through resonance exist. Note that the range of “g”-values covered in the Fig. 1a, b are very different.
Fig. 1.
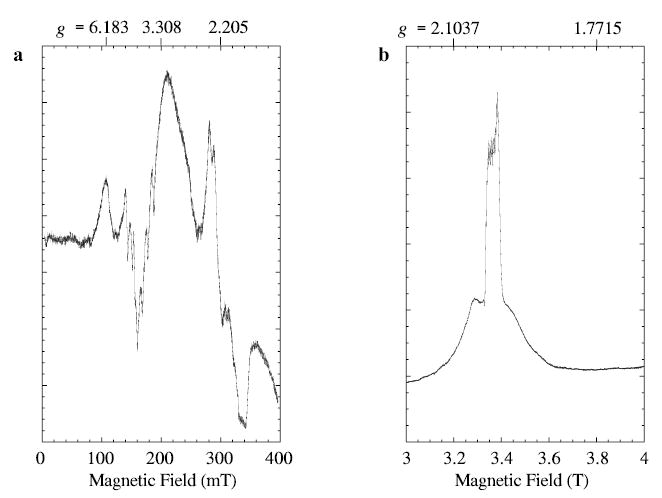
Experimental EPR spectra of 0.5 mM manganese lipoxygenase are shown for a X-band (9.26 GHz) and b W-band (94.094 GHz). Instrumental parameters under which spectrum a was recorded are: 100 kHz field modulation; modulation amplitude, 1.25 mT; microwave power, 20 mW; time constant, 0.25 s; scan rate, 800 mT/h; temperature, 80 K. The W-band spectrum b was recorded under partial-saturation conditions: 100 kHz field modulation; modulation amplitude, 1.0 mT; microwave power, 15.8 μW; time constant, 0.082 s; scan time, 2 T/0.373 h (8192 pts); average of increasing and decreasing field scans (one each); temperature, 20 K.
There is very little evidence of manganese hyperfine splitting in the spectra of Fig. 1. At X-band, some hyperfine splittings are resolved near 160 and 300 mT, but not in the broad features centered at 107 and 200 mT. X-band spectra similar to those shown in Fig. 1 were recorded at temperatures from 3.5 to 120 K, and with various modulation amplitudes and microwave powers. Only minor changes in overall intensity were evident. The optimum temperature range for resolved manganese hyperfine in the X-band spectra was 60–80 K. X-band spectra recorded at 3.5 K had a slightly broader overall line shape and the regions showing nuclear hyperfine splitting were less resolved. To observe the hyperfine features more clearly, W-band spectra were recorded under less saturating conditions than the ones employed for Fig. 1b.
Recording the W-band spectrum, with lower power, narrower modulation amplitude and slower scan of the magnetic field, yields the spectrum in Fig. 2. Note that the magnetic field range shown in Fig. 2 is 3.30 to 3.42 T, but a wider range (3.0 to 4.0 T) was shown in Fig. 1b. The spectrum in Fig. 2 resembles a derivative-of-absorption shape except for the very sharp resonances. The broader sextet has an apparent line width of 3–5 mT and a hyperfine separation of 9.1 mT (0.0086 cm−1) and does not change shape noticeably in the range 10 to 80 K. The sharper signals still have a rapid passage appearance (absorptionlike), under the recording conditions for Fig. 2, but they do exhibit a more normal derivative shape, of width less than 0.05 mT, when they are recorded with even lower power, modulation amplitude and scan rate (not shown). The very sharp resonances of the spectrum in Fig. 2 are tentatively attributed to a small amount of aquo manganese. The appearance of the W-band MnLO spectrum (Fig. 2) did not change with modulation frequency variation in the range 10 to 100 kHz. Regions of the magnetic field from 0 to 5 T were examined for evidence of other transitions outside the ranges shown in Figs. 2 and 1b, but no other transitions were detected.
Fig. 2.
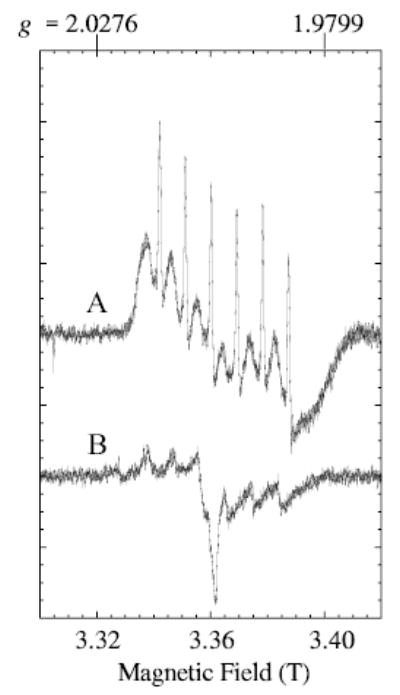
Spectrum A: The central region of experimental W-band EPR spectrum of manganese lipoxygenase was recorded under conditions to minimize saturation: frequency, 94.2197 GHz; field modulation amplitude, 0.3 mT (10 kHz modulation frequency); microwave power, 0.5 μW; time constant, 0.163 s; scan rate, 1.2 T/0.746 h (8192 pts); y-axis is the sum of four magnetic field scans, increasing and decreasing (two each); temperature, 20 K. Spectrum B: The buffer background signal was recorded under the same conditions as those of the sample A, except that only two scans were summed and the frequency was 94.1256 GHz (which accounts for the slight shift to lower field from spectrum A). For presentation in the figure, the buffer signal amplitude was multiplied by two for amplitude comparison with spectrum A.
Assignment of the major features of the spectra shown in Fig. 1 is based on calculations with the usual spin Hamiltonian [1] for the electron spin manifold, Se = 5/2:
| (1) |
The contribution of nuclear hyperfine splitting to the experimental line shapes shown in Fig. 1 is hardly resolved, so it is not included in these first-order line shape simulations. It is reasonable to assign the lowest-field maximum in the X-band spectrum (at 107 mT) to a transition between the lowest pair of energy levels, which is referred to as a 1 → 2 transition, where the energy levels at a particular field are labeled in order from lowest to highest [11]. Figure 3 gives curves showing how the resonance field of the 1 → 2 transition varies with values of the zero-field splitting parameters, E and D. A vertical line is drawn at the resonance field (107 mT) of the low-field maximum in the experimental spectrum shown in Fig. 1a.
Fig. 3.
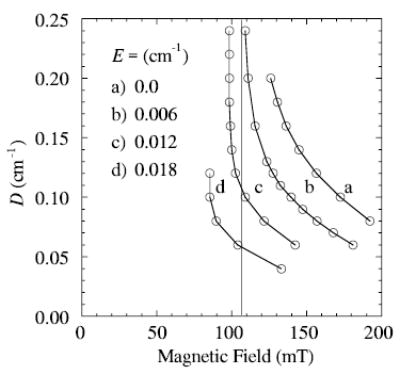
Resonance fields for transitions between the lower two levels (1 → 2 transition) of a Se = 5/2 system are displayed for the various values of zero-field splitting parameters, D and E, shown. The vertical line at 107 mT is at the field corresponding to the top of the lowest field maximum in the experimental spectrum. The frequency used in the simulation was 9.26 GHz.
Figure 4 gives a set of X-band spectra calculated for points on the vertical line at 107 mT in Fig. 3. Spectra B and C, shown in Fig. 4, have maxima and minima that most closely match those of the whole experimental spectrum. These calculations bracket D in the range ~0.07 to 0.10 cm−1 and E to corresponding values of 0.016 to 0.012 cm−1, respectively. The range of E/D in spectra B and C (Fig. 4) is therefore 0.12 to 0.23 (E/D is related to symmetry of the ligand-metal complex). Values of E/D less than 0.06 cm−1 (nearly axially symmetric) would not be consistent with a 1 → 2 transition at about 107 mT.
Fig. 4.
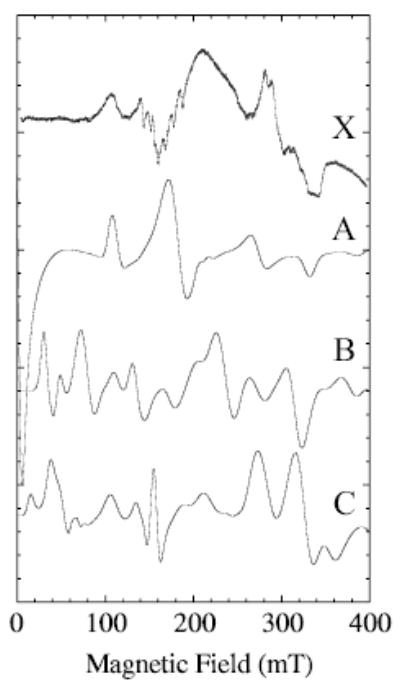
Representative calculated spectra (XSophe) for Se = 5/2 for points along the vertical line at 107 mT in Fig. 3 are compared with the experimental spectrum, X. The zero-field splittings, D and E, used in the calculations are A) 0.15 and 0.009, B) 0.1 and 0.012 and C) 0.07 and 0.016 cm−1, respectively. Other simulation parameters are 308 MHz frequency-swept, Lorentzian line width; microwave frequency, 9.26 GHz; temperature, 80 K; and a calculation covering 800 mT (only 400 mT of which is shown).
A difficult region of the X-band EPR spectrum of MnLO, Fig. 1a, to simulate is the low field region, below 80 mT, where almost no absorption is seen. There are allowed transitions in this region for D = 0.07–0.10 cm−1. For these values of D, most of the fifteen possible transitions between any pair, (ij), of the six levels of the electron manifold do have significant intensity. Focusing on details (not shown) of calculated spectra for D = 0.10 cm−1, the only transitions that do not contribute significantly to an X-band spectrum are those between any of the i levels 1–4 and the sixth j-level, as well as the 1 → 5 and 2 → 5 transitions. Transitions that shift most with variation in the value of D will be most broadened by a distribution in D. The portions of transitions occurring at B0 less than 80 mT, which do have significant intensity, fall into this category, suggesting that a distribution in D, or in E/D, is responsible for the lack of resolved transitions below 80 mT in the experimental spectrum (Fig. 1a).
To illustrate the effects of distributions in D on an X-band spectrum, Fig. 5 compares a calculation with no distribution (Fig. 1a) with one in which a Gaussian distribution of D-values (Fig. 1b) was employed. In this calculation, the central value of D was 0.1 cm−1 and the full-width-at half-maximum was 0.012 cm−1. The step size in D was 0.005 cm−1 and E was held constant at 0.012 cm−1. The broad maximum at ~200 mT arises from parts of the 2 → 3 transition. An artificially broad, Gaussian line shape (300 MHz, frequency-swept) was used in the simulations of Fig. 5 to give a first approximation of the shape that would result if nuclear hyperfine splitting were included. Narrower line shapes reveal the same trends, although then a step size in the D distribution smaller than 0.005 cm−1 is required to give a smooth simulation in the low-field region because the resonant fields for transitions occurring below 80 mT vary strongly with the value of D. Spectrum C in Fig. 5 results from a calculation that includes manganese nuclear hyperfine splitting but no distribution in D-values. Spectrum C (Fig. 5) has many of the features of the experimental spectrum (X), except in the low-field region. The hyperfine splitting near 160 mT is not seen in the calculation shown in Fig. 5 (spectrum C) because a line width on the order of the hyper-fine separation was used to minimize the time (number of steps) taken for this calculation.
Fig. 5.
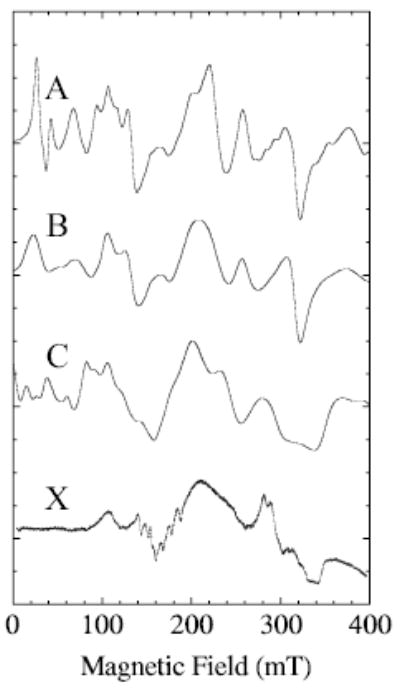
Effects of a distribution in D, or manganese nuclear hyperfine splitting, on calculated spectra are shown for simulations with D and E = 0.1 and 0.013 cm−1 respectively. All calculations have Se = 5/2. Spectrum A was calculated with no distribution in D; spectrum B was calculated with a distribution in D but E held constant; spectrum C was calculated (XSophe) with no distributions but manganese nuclear hyperfine splitting (91 mT, 0.0086 cm−1) was included; spectrum X is the experimental X-band spectrum of MnLO. Other simulation parameters are those given in the Fig. 4 legend, except that the calculation was only over the range 0 to 500 mT and the line shape was Gaussian (300 MHz width). For the distribution, nine spectra were calculated varying D by 0.005 between 0.08 and 0.12 cm−1. The distribution of amplitudes by which the subspectra were multiplied was based on values of D and was Gaussian of full width at half height equal to 0.012 cm−1.
The calculations contributing to the X-band spectra of MnLO can be examined for an explanation of why manganese nuclear hyperfine splitting should be resolved particularly in the magnetic field region centered on 160 mT. Examination of the spectra arising from transitions between each of the 15 ij pairs of levels for Se = 5/2 reveals that the transition that makes the major contributions to the region from 130 to 170 mT is the 3 → 5 transition, for values of D = 0.07 to 0.1 cm−1 and E = 0.016 to 0.013 cm−1. Figure 6 illustrates how the intensity factor for the 3 → 5 transition varies with magnetic field for a selected pair of D- and E-values. The intensity factor for a transition between levels i and j, Eq. (2), is defined as the square of the transition probability times (sin θ), with θ being the usual angle between the external magnetic field, B0, and the z – principal axis of the paramagnetic center in the molecule:
Fig. 6.
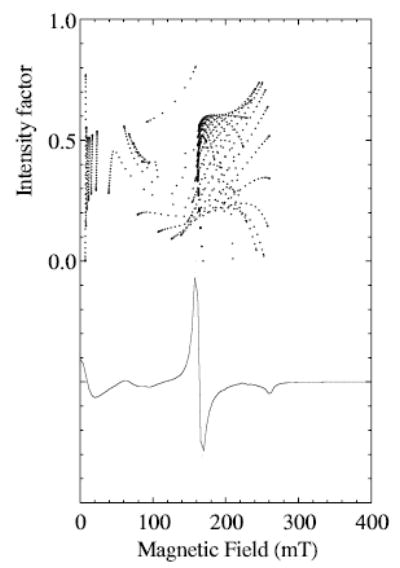
Dependence of the intensity factor [12] on magnetic field for the 3 → 5 transition of Se = 5/2 (upper) is compared with the derivative EPR spectrum calculated for this transition (lower) for a calculation with D and E = 0.08 and 0.015 cm−1, respectively, and microwave frequency of 9.26 GHz. The intensity factor was calculated with Eq. (2) (see text). A dot is shown for the intensity factor at each pair of θ and φ angles calculated every 3° in the range 0 to 90° for both angles (according to Eq. (1), the x-axis corresponds to θ = 90°, φ = 0° and the y-axis to θ = 90°, φ = 90°). A frequency-swept Lorentzian line width of 300 MHz was used to calculate the spectrum and the magnetic field was partitioned into 1 mT bins.
| (2) |
The 3 → 5 transition has unusual magnetic field dependence. There are two or more resonant fields for a single angular orientation, because the separation of the energy levels is a curved function of magnetic field [12]. There is a high density of large intensity factors at magnetic field of about 160 mT, with highest intensities occurring in the molecular yz plane at θ of ~52°. The behavior of the 2 → 4 transition is similar in this magnetic field region. Together, these transitions contribute an off-axis turning point to the experimental spectrum centered near 160 mT. A calculation of the whole spectrum (not shown) including manganese hyperfine splitting, with the zero-field parameters used in Fig. 6 and a line width of 50 G, indeed does give high resolution of hyperfine splitting in the region centered on 160 mT and less indication of hyperfine splitting elsewhere in the spectrum.
The W-band spectrum recorded under partial-saturation conditions (Fig. 1b) provides additional information about the D-value. Although the spectrum is absorptionlike, it contains distortions due to saturation, so it can only serve as a rough indication of the absorption spectrum of broader transitions underlying the central 3 → 4 transition. Only the five transitions between adjacent levels contribute to the W-band spectrum. Figure 7a shows the absorption spectrum from a W-band simulation for D ~ 0.08 cm−1 and E/D = 0.1875, with nuclear hyper-fine splitting. The central, sharp maximum arises from the 3 → 4 transition. Two of the five subtransitions contribute particularly on the low-field side of the spectrum (1 → 2 and 2 → 3 transitions). The remaining transitions (4 → 5 and 5 → 6) are slightly broader mirror images about the magnetic field axis on the high-field side. The slight asymmetry of the experimental W-band line shape, narrower to low field, is consistent with a positive value of D. Figure 7b gives a calculation that includes nuclear hyperfine for the region that corresponds to that shown earlier in nonsaturated experimental spectrum of Fig. 2. Several different calculations are shown in Fig. 7b to illustrate the dependence on D and E/D. Some distribution of D-values within the range shown would account well for the broader component in the experimental W-band spectrum, also shown in Fig. 7b.
Fig. 7.
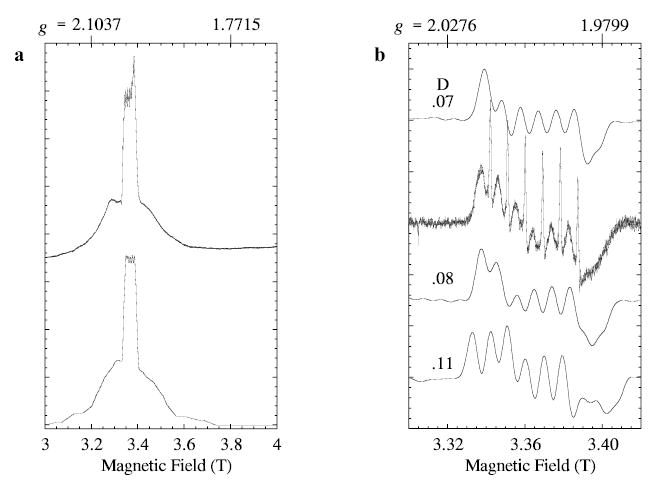
Simulations (XSophe) of W-band EPR spectra of manganous lipoxygenase. a The high-power experimental spectrum (the same as in Fig. 1b) is compared with the calculated absorption spectrum (lower) with D and E = 0.08 and 0.015 cm−1, respectively. b The central region of the low-power experimental spectrum (the same as in Fig. 2) is compared with three simulations for several values of D, as indicated on the figure. In both the a and the b calculations, the microwave frequency is 94.22 GHz, the line width is 84 MHz, the manganese nuclear hyperfine is 0.0086 cm−1 (isotropic) and the g-factor was taken as 2.0 (isotropic). The values of E and (D) for the calculations in b are 0.016 (0.07). 0.015 (0.08), and 0.013 (0.10) cm−1, respectively.
4 Discussion
No single calculated spectrum of those in the range covered in Fig. 4 fits the experimental X-band spectrum completely, even neglecting the omission of nuclear hyperfine splitting from the calculation. The features between 280 and 350 mT are best fit by choosing a small D-value (0.08 cm−1) and an E/D value toward rhombic symmetry (0.19). On the other hand, the large and very broad maximum centered at about 200 mT in the experimental spectrum is a feature appearing in calculations closer to D ~ 0.1 cm−1 and E/D = 0.12. These calculations ascribe the origin of this feature to an interdoublet 2 → 3 transition, which would not be present at all if the D-value were much greater than 0.2 cm−1. Another feature in the experimental spectrum (Fig. 1a) is the near-absence of absorption below 80 mT. The resonance fields of these transitions near zero field are very sensitive to the values of D and E, and probably average away when a distribution of zero-field splittings characterizes the spectrum. This was demonstrated partially in the calculations for Fig. 5, where the effect of a distribution in D is seen. The range of values of zero-field splittings derived by analysis of the X-band spectra are D in the range ~0.07–0.10 cm−1 and E to corresponding values of 0.16 to 0.12 cm−1, respectively. The best fit between simulation and experiment in W-band spectra is provided by D = 0.08 and E = 0.015 cm−1, but some distribution in these values would be consistent with observed spectra. An X-band calculated spectrum with D = 0.08 and E = 0.015 cm−1 has clear hyper-fine in the region centered on 160 mT and a rationale for the resolution in this region is presented in Fig. 6. In X-band spectra, hyperfine splitting near 160 mT becomes less prominent as D increases, but the broad feature near 200 mT is more apparent for D ~ 0.1 cm−1. Overall, the experimental EPR spectra of MnLO appear to arise from some distribution in values of D and E.
It is of interest to compare the zero-field splitting parameters that have been derived by these simulations with those known for other proteins, in order to gain some insight about the nature of the ligands to the metal in MnLO. The zero-field splitting parameters are related to deviations from an octahedrally-symmetric ligand field and depend on a variety of factors including bond lengths, electron delocalization into ligand orbitals and coordination number. For manganese, other proteins, in which there is a mononuclear, nonheme manganese ion with some of the ligands provided by protein side chains and others by small ligands, provide suitable examples for comparison. The best proteins for comparisons with lipoxygenases are mononuclear superoxide dismutases, which are known in both iron and manganese versions also. Both enzymes have +2 and +3 oxidation states of the metal as intermediates in the catalytic cycle. The iron versions of each enzyme have three, or more, histidine N-ligands and two or more O-ligands to iron. The +2 state of manganese and the +3 state of iron have, in the high spin forms, Se = 5/2. An estimate of the zero-field splitting parameter, D, for the hexa-coordinate azide complex of manganous superoxide dismutase (SOD) [5] is <0.3 cm−1and the value for penta-coordinate ferric SOD is D > 1.5 cm−1 [16]. The value of D for ferric lipoxygenase [15, 17] (hexa-coordinate) is in the range 1–2 cm−1. This comparison suggests that Mn2+LO should have a D-value somewhat smaller than 0.3 cm−1 if the ligand environment in MnLO is similar to that of FeLOs. Table 1 compares D- and E-values for bound Mn2+ in several proteins, together with the parameters for iron lipoxygenase from soybean (sbLO) and iron SOD. The calculated D-value for Mn2+LO is slightly lower than the experimental value for MnSOD-azide [5], but greater than the D-value of all the proteins with one or no N-ligands to Mn2+. The entry in Table 1 for MndD [6], a protein in the “facial triad” category, is for the native enzyme, which is probably 5-coordinate. Added inhibitors are thought to give 6-coordinate species and the D-values in these complexes of MndD increase by a factor of about two [6]. MndD has two histidine-N ligands to the bound manganese ion, a carboxylate side chain and two or three O-ligands from small molecules. The manganous proteins in which the ligands to Mn are predominantly O- also have small D-values. For instance, the D-value determined for the Mn2+ in the GDP complex of p21 Ras [8, 9] is about 0.01 cm−1, and that for Mn2+ in concanavalin A [7] is 0.022 cm−1. Comparison of the D-values in Table 1 leads to the prediction that MnLO probably has three N- and some O-ligands to the metal. A recent partial sequence of MnLO confirms that analogs of helices 9 and 18 in the iron sbLO structure [3] can be identified in the MnLO sequence and that the side chains that ligate iron in sbLO are also found in MnLO (C. Su and E. H. Oliw, unpubl.).
Table 1.
Zero-field splittings for some manganese and iron proteins.
| Metal ion | Proteina | Protein ligandsb | D-value (cm−1) | E/D | Method | Reference(s) |
|---|---|---|---|---|---|---|
| Mn2+ | MnLO | unk | +0.10–0.07 | 0.13–0.23 | EPR 94 GHz | This paper |
| Mn2+ | SOD-Az | N3O2(+N) | <0.3 | ~0 | EPR/MCD | 5 |
| Mn2+ | MndD | N2O | <0.033 | <0.05 | EPR | 6 |
| Mn2+ | ConA | N1O3 | 0.022 | 0.185 | EPR 35 GHz | 7 |
| Mn2+ | p21Ras-ADP | O1(+5O) | 0.011 | 0.27 | EPR | 8 |
| Fe3+ | sbLO | N3O3 | +1–2 | 0.01–0.065 | EPR/MCD | 15, 17 |
| Fe3+ | SOD | N3O2 | >1.5 | 0.24 | EPR 35 GHz | 16 |
Abbreviations: LO, lipoxygenase; SOD-Az, superoxide dismutase-azide complex; MndD, a facial triad protein, Mn2+ dependent 3,4-dihydroxyphenylacetate 2,3-dioxygenase; ConA, concanavalin A; Ras, product of ras gene.
Ligands are contributed by both protein side chains, NxOy, and atoms (+N or O) of small molecules that bind the metal center.
Acknowledgments
The authors acknowledge support from the US National Institutes of Health, (grant GM 36232 to BJG) and from the Swedish Medical Research Council (grant 03X-06523 to EHO).
References
- 1.Su C, Oliw EH. J Biol Chem. 1998;273:13072–13079. doi: 10.1074/jbc.273.21.13072. [DOI] [PubMed] [Google Scholar]
- 2.Rowley A.F., Kuhn H., Schewe T.: Eicosanoids and Related Compounds in Plants and Enzymes. London: Portland Press Ltd. 1998.
- 3.Gaffney BJ. Annu Revs Biophys Biomol Struct. 1996;25:431–59. doi: 10.1146/annurev.bb.25.060196.002243. [DOI] [PubMed] [Google Scholar]
- 4.Su C, Sahlin M, Oliw EH. J Biol Chem. 2000;275:18830–18835. doi: 10.1074/jbc.M001408200. [DOI] [PubMed] [Google Scholar]
- 5.Whittaker JW, Whittaker MM. J Am Chem Soc. 1991;113:5528–5540. [Google Scholar]
- 6.Whiting AK, Boldt YR, Hendrich MP, Wackett LP, Que L. Biochemistry. 1996;35:160–170. doi: 10.1021/bi951979h. [DOI] [PubMed] [Google Scholar]
- 7.Meirovitch E, Luz Z, Kalb J. J Am Chem Soc. 1991;96:7538–7542. doi: 10.1021/ja00831a024. [DOI] [PubMed] [Google Scholar]
- 8.Smithers GW, Poe M, Latwesen DG, Reed GH. Biochemistry. 1992;31:4946–4950. doi: 10.1021/bi00136a004. [DOI] [PubMed] [Google Scholar]
- 9.Bellew BF, Halkides CJ, Gerfen GJ, Griffin RG, Singel DJ. Biochemistry. 1996;35:12186–12193. doi: 10.1021/bi960594b. [DOI] [PubMed] [Google Scholar]
- 10.Gaffney BJ, Maguire BC, Weber RT, Maresch GG. Appl Magn Reson. 1999;16:207–222. [Google Scholar]
- 11.Gaffney B.J., Silverstone H.J. in: Biological Magnetic Resonance (Berliner L.J., Reuben J., eds.), vol. 13, pp. 1–57. New York: Plenum 1993.
- 12.Gaffney BJ, Silverstone HJ. J Magn Reson. 1998;134:57–66. doi: 10.1006/jmre.1998.1526. [DOI] [PubMed] [Google Scholar]
- 13.Wang D, Hanson GRJ. J Magn Reson A. 1995;117:1. [Google Scholar]
- 14.Weger M. Bell System Technical J. 1960;39:1013–1112. [Google Scholar]
- 15.Gaffney BJ, Mavrophilipos DV, Doctor KS. Biophys J. 1993;64:773–783. doi: 10.1016/S0006-3495(93)81438-3. [DOI] [PMC free article] [PubMed] [Google Scholar]
- 16.Slykehouse TO, Fee JA. J Biol Chem. 1976;251:5472–5477. [PubMed] [Google Scholar]
- 17.Pavlovsky MA, Zhang Y, Westre TE, Gan QF, Pavel EG, Campochiaro C, Hedman B, Hodgson KO, Solomon EI. J Am Chem Soc. 1995;117:4316–4327. [Google Scholar]


