

Abstract
Earlier data showed that men fasted for 38 h have a reduced rate of chlorzoxazone (CZ) metabolism suggesting a decreased level of cytochrome P450 2E1 (CYP2E1). In contrast, CYP2E1 level in fasted rats has been shown to be elevated. In this study, we investigated whether CZ metabolism in fasted rats was changed by determining the pharmacokinetics of CZ and its metabolite 6-hydroxyCZ (6-OHCZ), as a CYP2E1 probe, and by measuring liver CYP2E1 using immunoblot techniques. CZ was administered both by gavage (50 mg/kg) and by iv (25 mg/kg) to control (9 for oral and 3 for iv) and 24 h-fasted (9 for oral and 4 for iv) male Sprague-Dawley rats. Following sampling of blood through a jugular vein cannula, CZ and 6-OHCZ plasma concentrations were measured by HPLC with ultraviolet detection. Pharmacokinetic parameters for CZ and 6-OHCZ in each treatment group were determined by model fitting and non-compartmental analysis. In parallel with the increased liver CYP2E1 level, the elimination of both CZ and 6-OHCZ was significantly increased in fasted rats in both the oral and iv study. A MANOVA covariance analysis and a multiple regression analysis revealed a significant correlation between 1/t½ and CYP2E1 level and aniline hydroxylase activities. However, the correlations between 1/t½ and pentoxyresorufin O-dealkylase, ethoxyresorufin O-dealkylase and erythromycin N-demethylase were not significant. Therefore the contribution of other P450s to CZ metabolism seemed to be minor in the concentration range that we tested. In conclusion, fasting rats for 24 h causes a measurable induction of CYP2E1 that produces a significant increase in the rate of CZ metabolism and elimination. This is in contrast to the decreased metabolism of CZ reported for 38-hour fasted men (BJ prefers deletion of this sentence here but discussed in Discussion section?).
Keywords: Chlorzoxazone, Pharmacokinetics, Rats, Fasting, CYP2E1, Acetone
Introduction
Cytochrome P450 2E1 (CYP2E1) is one of multigene family enzymes involved in the metabolism of numerous exogenous and endogenous compounds, such as ethanol, long chain fatty acids, certain nitrosamines, and therapeutic agents such as chlorzoxazone (CZ) and acetaminophen (Koop and Coon 1986; Raucy et al 1989;Peter et al 1990). It is also responsible for the toxicity of many compounds by creating highly reactive metabolites (Yang et al 1990; Guengerich et al 1991). Regulation of CYP2E1 has been shown to occur at various levels including gene transcription, mRNA stabilization, and protein stabilization (Song et al 1986;Roberts et al 1995a). Fasting for 24 to 48 hours has been shown to induce both CYP2E1 mRNA and protein concentrations 1.5-fold to 3-fold in the Sprague-Dawley rat (Hong et al 1987).
Since publication of the original report that hydroxylation of CZ was catalyzed specifically by human liver cytochrome P4502E1 (Peter et al 1990), the rate of metabolism of CZ has been increasingly used as a marker for CYP2E1 liver concentrations (Chen and Yang 1996; Lucas et al 1999). In most cases, CZ metabolism has changed in the direction that was expected based on the experimental treatment [e.g. increased during alcohol withdrawal (Dupont et al 1998), decreased following CYP2E1 suicide substrate (Emery et al 1999). However, in a study of men fasted for 36 h, the elimination of CZ was decreased, but not increased as expected (O'Shea et al 1994). Since the human CYP2E1 levels were not determined in the study, the explanation for the decreased CZ metabolism remains unclear. Therefore, we decided to investigate CZ metabolism in fasted rats to see: 1) how CZ metabolism changes in fasted rats. 2) Whether changes in the CYP2E1 liver concentration parallel the changes in CZ metabolism in fasted rats. Although some studies demonstrated that the metabolism of CZ was determined by CYP2E1 level (Peter et al 1990; Lucas et al 1999), others suggested that other P450s such as CYP3A4 and CYP1A can play a role in chlorzoxazone 6-hydroxylation in in vitro studies (Ono et al 1995; Gorski et al 1997; Shimada et al 1999) and doubted the use of CZ as a specific probe for CYP2E1. Therefore, we also determined the correlation of in vivo CZ elimination with some other P450 enzyme activities to determine which P450s may also be related to CZ metabolism.
Methods
Materials
Chlorzoxazone, pentoxifylline, β-glucuronidase (from Helix pomatia),horseradish peroxidase conjugated anti-goat IgG were purchased from Sigma Chemical Co. (St. Louis, MO). 6-Hydroxychlorzoxazone (6-OHCZ) was purchased from RBI (Natick, MA). Acetonitrile was of HPLC grade and obtained from Fisher Scientific (Fair Lawn, NJ). Goat anti-rat CYP2E1 polyclonal antibody was purchased from Gentest (Woburn, MA). All other chemicals and solvents were of the highest grade of commercially available materials.
Animals and treatment
Male, Sprague-Dawley rats (340–420 g) with jugular cannula were obtained from Taconic Farms (Germantown, NY) and maintained according to NIH Animal Care and Use Guidelines. All procedures were approved by the NIAAA Animal Care and Use Committee. The jugular cannula was secured using a head cap. Rat chow and tap water were available ad libitum. All rats were maintained on a standard 12-h light and dark cycle. The animals were acclimated for a minimum of 3 days in a cage with bedding before being randomly assigned to either the control or fasted group. At approximately 8:30 AM, food was removed from the control group 4 h before CZ administration. For the fasted group, food was removed at approximately 8:30 AM the day before CZ administration.
Chlorzoxazone (10 mg/ml) was dissolved in saline by the aid of 0.1 N NaOH. Oral doses were given by gavage. Intravenous doses were given through the jugular cannula; after dosing the tubing attached to the head cap was removed and replaced with fresh tubing for sampling. CZ doses were administered at about 1 PM, about 15 min after the rats were given 8 units of heparin (iv). For oral administration, blood samples (0.25 ml) were taken from the jugular cannula at 0, 10, 15, 20, 30, 40, 60, 75, 90, 120 and 140 minutes; approximately the same volume of saline was used to clear the tubing. For iv administration, blood samples were taken at 0, 15, 30, 45, 60, 75, 90, 100, 120, 140, and 160 minutes. In the oral study, a blood sample (1.5 ml) was also taken close to the last time point and was used for the assay of β-hydroxybutyrate and acetone. Blood samples were collected into heparinized tubes (Sarstedt microvette CB 300, Numbrecht, Germany) and centrifuged at 3,000 x g for 10 min. The resultant plasma was stored in −80 ºC until assay Following decapitation after the oral study, the liver was removed. The large lobe was used to freshly prepare microsomes (Roberts et al 1995b); the microsomes were stored at −80 ºC until assay.
Seven rats were used for the iv study (one dose of 25 mg/kg, 3 for control and 4 for fasted rats) and the oral study (one dose of 50 mg/kg, 3 for control and 4 for fasted rats, same as in the iv study) of CZ. After the iv study, rats were re-fed for at least two days to wash-out any remaining CZ before the oral study was conducted; the blood sampling schedule was the same as was used for the iv study. Another 11 animals were used only for the oral study (6 for control group and 5 for fasted rats). The other experimental conditions were the same as mentioned above.
Analysis of chlorzoxazone and 6-hydroxychlorzoxazone
Fifty microliters of plasma was added to a 1.5 ml microcentrifuge tube containing 60 μl of a buffer containing 40 μl of 0.2 M acetate buffer (pH 4.75), 10 μl of 50 μg/ml pentoxifylline and 10 μl β-glucuronidase (10,120 units/ml in 0.2% NaCl) (Lucas et al 1993). The plasma mixture was incubated at 37 ºC for 3 hr and then 100 μl acetonitrile was added, vortexed and centrifuged at 15,300 x g for 10 min. One hundred microliters of supernatant was transferred to a second microfuge tube and 100 μl of 10% trichloroacetic acid and 200 μl of water were added. This tube was vortexed and centrifuged at 15,300 x g for 10 min. An aliquot of the supernatant, 200 μl, was filtered through a Microcon YM-10 from Millipore Co. (Bedford, MA) by centrifugation at 15,300 x g for 25 min. Fifty microliters of the eluant was injected onto the HPLC. The Waters HPLC system consisted of a Model 600E pump, a Model 715 Ultra WISP autoinjector and a Model 486 Absorbance Detector set at 284 nm. Data acquisition and analysis was performed using the Dynamax system with the MacIntegrator II program (Varian, Walnut Creek, CA). Separation was accomplished at 35 ºC on a Nova-Pak C-18 column (3.9 x 150 mm I.D.) by Waters (Milford, MA). The mobile phase consisted of 86% water containing 0.15% ammonium acetate (pH 4.7 with glacial acetic) and 14% acetonitrile by pump mix with a flow rate of 1.1 ml/min. Retention times for 6-OHCZ, pentoxifylline (IS), and CZ were at 3.5, 6.9 and 19.8 min, respectively. Linear calibration curves (r>0.99) were obtained for both compounds in plasma over the concentration range from 1 to 50 μg/ml. For the two concentrations tested, 6.25 and 12.5 μg/ml, the intra-assay coefficients of variation were less than 5% and 6% for 6-OHCZ and CZ, respectively; the inter-assay coefficients of variation were less than 6% and 7% for 6-OHCZ and CZ, respectively. The limits of detection were estimated to be 0.05 μg/ml for both compounds.
Acetone analysis
The plasma (75 μl) was transferred to a gas-tight headspace vial. The samples were heated for 15 min at 70 ºC prior to analysis. The gas phase of the samples was analyzed with a gas chromatograph (Carlo Erba FTV 2350) as described previously (Ernstgård et al. 1999), equipped with a headspace sampler (Hewlett Packard, HP7694) using a nonpolar capillary column (Poraplot Q, Chrompack 25 m, 0.53 mm inner diameter, 20 μm phase thickness), nitrogen as carrier gas and flame ionization detection. Injection and detection temperatures were 175 ºC and 275 ºC, respectively. The column temperature was 130 ºC and the retention time of acetone was 3.7 min. Calibration standards of acetone (99% purity, Merck, Germany) were prepared using Millipore water. The detection limit was about 2 μmol/L.
Immunoblot analyses
Liver CYP2E1 level was determined by immunoblot analysis. After the microsomal protein (2.5 μg/lane) was resolved by gel electrophoresis (8% TG 1.0 gel by NOVEX), the protein was transferred to PVDF membranes. Following incubation with blocking buffer (5 g non-fat dry milk and 20 mg NaN3 in 100 ml 1X physiologic buffered saline (PBS) for 2 hours, the membranes were then incubated with primary antibody (1:1000 dilution in the same blocking buffer) (Roberts et al 1995a) overnight. After washing with wash solution (15 ml 5 M NaCl, 25 ml 1 M Tris-HCl (pH 7.4), 460 ml water, 3 X 10 min), they were incubated with secondary antibody (1:1000 dilution) in 5% non-fat dry milk in 1XPBS for 1 hour. The membranes were then washed 3 times for 10 minutes in wash solution and the membrane then placed into 50 ml 0.01M Tris-HCL (pH 7.4) containing 30 mg 3,3'-diaminobenzidine tetrahydrochloride dihydrate and 15 mg cobaltous chloride hexahydrate (Fluka, Buchs, Switzerland). The antigen protein bands were visualized by adding 15 μl of 30% hydrogen peroxide. Immunoblots were quantitated by scanning them into Adobe Photoshop (Macintosh) and using NIH Image 1.61 to estimate the density of each band. In each blot, the average densitometric value from control rats was used as baseline, and the ratio of densitometric value from each individual band to the baseline was taken as the result.
Enzyme assays
Aniline hydroxylase (AH) activity was measured according to Roberts et al. (1995b) except that the final aniline concentration was 1 mM. Erythromycin N-demethylase (ERNd) activity was determined as described (Wang et al 1997) with the following modifications: microsomes (0.5 mg/ml) were incubated with 500 μM erythromycin in 0.25 M Tris buffer (pH 7.4) with 6 mM MgCl2, an NADPH generating system consisting of 1.2 mM NADP+, 10 mM isocitrate, and 0.24 units isocitrate dehydrogenase; reactions were performed at 37 ºC for 15 minutes. Ethoxyresorufin O-dealkylase (EROD) and pentoxyresorufin O-dealkylase (PROD) activities were assayed as described by Burke et al. (1985). Plasma β-hydroxybutyrate (HB) concentrations were measured using kits from Sigma (St. Louis, MO). Protein concentrations were determined by Pierce BCA protein assay kit (Rockford, IL).
Pharmacokinetic analysis
To estimate the rate of CZ and 6-OHCZ elimination from the body, the iv CZ and 6-OHCZ data were sequentially fitted (Statistica 3.0b for the Macintosh) using equation 1 and equation 2, respectively. These equations were generated by Laplace transformation as described by Chen and Yang (1996). The molar concentration was used only here for fitting purposes.
| Equation 1 |
| Equation 2 |
Where Cp (μmol/ml) was the plasma concentration of CZ and Cm the concentration of the 6-OHCZ metabolite. Other parameters were dose (D, μmol/kg), apparent distribution volume (Vp, ml/kg), the rate of elimination of CZ through all pathways (k, min−1), the rate of formation of 6-OHCZ (kf, min−1), the rate constant for 6-OHCZ elimination (km min−1). Chen and Yang (1996) also defined k as being equal to kf + ke, where ke is rate of elimination of CZ through any other pathway.
In a non-compartmental analysis, the area under the plasma concentration-time curve (AUC∞) was determined by the linear trapezoidal rule with extrapolation to infinity by use of a log-linear estimation of the terminal elimination constant (λz). The Volume steady-state (Vss, ml/kg) of CZ following intravenous administration was calculated by the equation: CL*MRT. The half-life (t½) for each compound was obtained from the ratio 0.693/λz. The oral CZ absorption fraction (F) was calculated according to equation 3.
| Equation 3 |
The oral clearance (CL/F, ml/min) of CZ was calculated from Dose(po)/AUC∞(po).
Statistical analysis
Data are presented as mean ± SD. The Student t test (Statistica 3.0b) was used to assess the significance of differences (p<0.05) between the values in two treatment groups. To estimate the correlation of variables (AH, EROD, ERNd, PROD activities and CYP2E1 level) to CZ elimination parameters (1/t½), an analysis of covariance was used in a MANOVA test. A multiple regression was also used to determine the correlation of above mentioned independent variables to 1/t½ for CZ.
Results
Effects of fasting on CZ metabolism Intravenous study
Plots of average CZ and 6-OHCZ plasma concentrations following intravenous administration to control and fasted rats are shown in Figures 1A and 1B, respectively. Parameters for the fit of Equations 1 and 2 to CZ and 6-OHCZ concentrations are shown in Table 1.
Fig. 1.

Time-dependent changes in plasma concentrations of CZ and 6-OHCZ after oral administrations of CZ in control and fasted rats. Upper panels: Plasma concentration versus time curve of chlorzoxazone (CZ) (A) and 6-hydroxychlorzoxazone (6-OHCZ) (B) after a 25 mg/kg iv bolus dose of CZ to control (square) and fasted (triangle) rats. Lower panel: Plasma concentration versus time curve of CZ (C) and 6-OHCZ (D) after a 50 mg/kg oral dose of CZ; the symbols for groups are the same as above.
Table 1.
Parameters Obtained from the Sequential Fit of Plasma Chlorzoxazone and 6-Hydroxychlorzoxazone Concentrations, Following a 25 mg/kg Intravenous Dose, to Equations 1 and 2, see Methods.
| Treatment | k x 10−3 min−1 | kf x 10−3 min−1 | ke x 10−3 min−1 | km x 10−3 min−1 | Vp ml/kg | Vm ml/kg |
|---|---|---|---|---|---|---|
| Control (n=3) | 19.9 ± 1.9 | 9.9 ± 1.7 | 10.0 ± 0.06 | 52.6 ± 2.3 | 519 ± 117 | 423 ± 3 |
| Fasted (n=4) | 31.8 ± 5.1a | 22.2 ± 5.0a | 9.6 ± 4.3 | 81.6 ± 5.6a | 508 ± 65 | 384 ± 25 |
p <0.05 when compared with control rats.
Pharmacokinetic parameters for CZ and 6-OHCZ calculated by noncompartmental analysis are shown in Table 2. The CZ elimination rate constant k, determined by fitting Equation 1, was increased 1.6 times by fasting (p<0.05); λz was increased 1.5-fold. This is in line with the immunoblot result which shows fasting increased the CYP2E1 level by 1.76-fold (Fig. 2, Table 4). The rate constants for 6-OHCZ formation and elimination, kf and km, were also increased by fasting (p<0.05). The excellence of curve fitting was confirmed by visual inspection of the plot, also the values of k and kf in control rats were similar to those reported by Chen and Yang. (1996). The apparent distribution volume of CZ (ml/kg) was the same in two groups; there was no difference between fitted Vp and Vd determined by non-compartmental analysis.
TABLE 2.
Pharmacokinetic Parameters of Chlorzoxazone and 6-Hydroxychlorzoxazone Following a 25 mg/kg Intravenous Dose of Chlorzoxazone to Male Sprague-Dawley Rats
| Chlorzoxazone
|
6-Hydroxychlorzoxazone
|
||||||||
|---|---|---|---|---|---|---|---|---|---|
| Treatment | C0 (μ g/ml) | λz (x 103 min−1) | t½ (min) | AUC ∞ (μ g/ml*min) | CL ml/min/kg | Vss* ml/kg | λz (x 103 min−1) | t½ (min) | AUC ∞ (μ g/ml*min) |
| Control (n=3 | 63.9 ± 16.9 | 31.4 ± 3.5 | 22.2 ± 2.6 | 2013 ± 325 | 12.6 ± 1.9 | 403 ± 71 | 19.9 ± 3.5 | 35.5 ± 6.7 | 592 ± 64 |
| Fasted n=4 | 51.7 ± 5.8 | 43.7 ± 4.9a | 16.0 ± 1.7a | 1196 ± 207a | 21.3 ± 3.3a | 491 ± 80 | 37.4 ± 3.5a | 18.6 ± 1.9a | 579 ± 107 |
p<0.05 when compared with control rats.
Vss= Cl*MRT
Fig. 2.
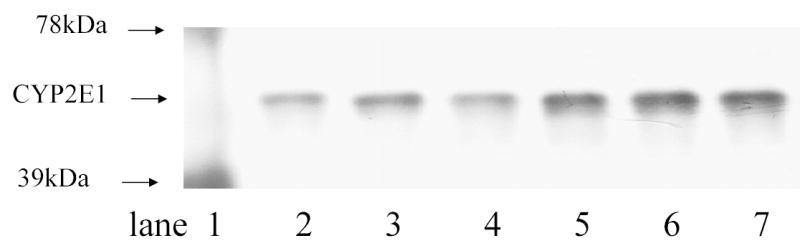
Immunoblot analysis of microsomal CYP2E1 contents in control and fasted rats. After the microsomal protein (2.5 μg/lane) was resolved by gel electrophoresis (8% TG 1.0 gel by NOVEX), the protein was transferred to PVDF membranes, and subjected to immunoblot analysis as detailed in the Method section. Lane 1: molecular marker; lanes 2–4: control; lanes 5–7: fasted rats.
TABLE 4.
Liver CYP2E1Level and Microsomal Activities in Control and Fasted Male Sprague-Dawley Rats
| Treatment | CYP2E1 | Aniline hydroxylase (nmol/min/mg) | Ethoxyresorufin O-dealkylase (nmol/min/mg) | Pentoxyresorufin O-dealkylase (pmol/min/mg) | Erythromycin N-demethylase (nmol/min/mg) |
|---|---|---|---|---|---|
| Control (n=9) | 1.00 ± 0.22 | 0.42 ± 0.07 | 0.47 ± 0.13 | 39 ± 8 | 2.01 ± 0.13 |
| Fasted (n=9) | 1.76 ± 0.33 a | 0.62 ± 0.13a | 0.42 ± 0.14 | 52 ± 8 a | 1.96 ± 0.16 |
p<0.05 when compared with control rats.
The AUC of 6-OHCZ was unchanged by fasting even though the 6-OHCZ concentration and the 6-OHCZ/CZ ratio were 2–3 times higher in fasted rats compared to those in control rats from 15 to 75 min (see Figure 1B). This should be caused by increased production rate and elimination rate of 6-OHCZ by fasting. Although we used small number of animals in each group, the very small standard deviation (Fig. 1) indicates that the results were consistently reproducible and we therefore were able to find the significant difference.
Oral study
Plots of average CZ and 6-OHCZ plasma concentrations following oral administration to control and fasted rats are shown in Figures 1C and 1D, respectively. Fasting significantly decreased the AUC and increased the plasma clearance of CZ (Table 3, Fig. 1C). It appears that the value of F (Table 3) in fasted rats is higher than that in control rats but the difference is not significant. The CL/F of CZ was increased 1.6 times by fasting (p<0.05); t½ was also decreased 1.6-fold (p<0.05). This is in line with the immunoblot result which shows fasting increased the CYP2E1 level by 1.76-fold. The t½ of 6-OHCZ was faster in fasted rats, which is consistent with the iv study. The 6-OHCZ concentration and the ratio of 6-OHCZ /CZ at 15 min were increased in fasted animals.
TABLE 3.
Pharmacokinetic Parameters of Chlorzoxazone and 6-Hydroxychlorzoxazone (6-OHCZ) Following a 50 mg/kg Oral Dose of Chlorzoxazone to Male Sprague-Dawley Rats
| Chlorzoxazone
|
6-Hydroxychlorzoxazone
|
||||||||||
|---|---|---|---|---|---|---|---|---|---|---|---|
| Treatment | λz (x 103 min−1) | t½ (min) | CL/F* (ml/min/kg) | AUC *∞ (μ g/ml*min ) | F‡ | λz (x 103 min−1) | t½ (min) | AUC∞* (μ g/ml*min ) | 6-OHCZ(15)# (μ g/ml) | Ratio(15)† | |
| Control (n=9) | 13.1 ± 3.8 | 57.8 ± 19.4 | 10.5 ± 2.9 | 1946 ± 547 | 0.46 ± 0.06 | 10.1 ± 3.2 | 74.3 ± 20.4 | 1028 ± 276 | 5.7 ± 1.8 | 0.37 ± 0.09 | |
| Fasted (n=9) | 21.5 ± 9.a | 35.9 ± 10.8a | 16.4 ± 6.9a | 1272 ± 568a | 0.59 ± 0.12 | 15.1 ± 6.2 | 51.5 ± 16.7a | 1136 ± 429 | 9.6 ± 2.9a | 0.72 ± 0.26a | |
Due to incomplete early time curves, this parameter could not be calculated for all animals, therefore, n=7 for control, n=7 for fasted rats.
Oral bioavailability, n=3 for controls, n=4 for fasted.
6-OHCZ(15) indicates the value of 6-OHCZ concentration at 15 min.
Ratio(15) indicates the ratio of 6-OHCZ to CZ at 15 min.
p<0.05 when compared with control rats
Effect of fasting on liver CYP2E1 level and microsomal activities
Liver CYP2E1 levels and microsomal enzyme activities are shown in Table 4 and Fig. 2. Fasting increased the activities of AH and PROD, and the immunoreactive CYP2E1 level.
Biochemical changes following fasting treatment
Fasting for 24 hours increased plasma HB concentrations (from 0.17 ± 0.10 to 1.01 ± 0.29 mM) significantly. Fasting also increased acetone concentration 2.6-fold (from 223 ± 126 to 591 ± 209 μM). As shown in Fig.3, the correlation between liver CYP2E1 level and activity or plasma acetone concentration was significant (r=0.76, p<0.001 and r=0.68, p<0.001, respectively). Although the correlation between 1/t½ and plasma acetone concentration was somewhat weak despite its significance (r=0.59, p<0.05), plasma HB concentration significantly correlated with the liver CYP2E1 level, activity and 1/t½ as well (r=0.87, p<0.001; r=0.66, p<0.001 and r=0.633, p<0.005, respectively; Fig.4. right panel). The correlation between the plasma HB and acetone concentrations were also significant (r=0.79, p<0.001).
Fig. 3.
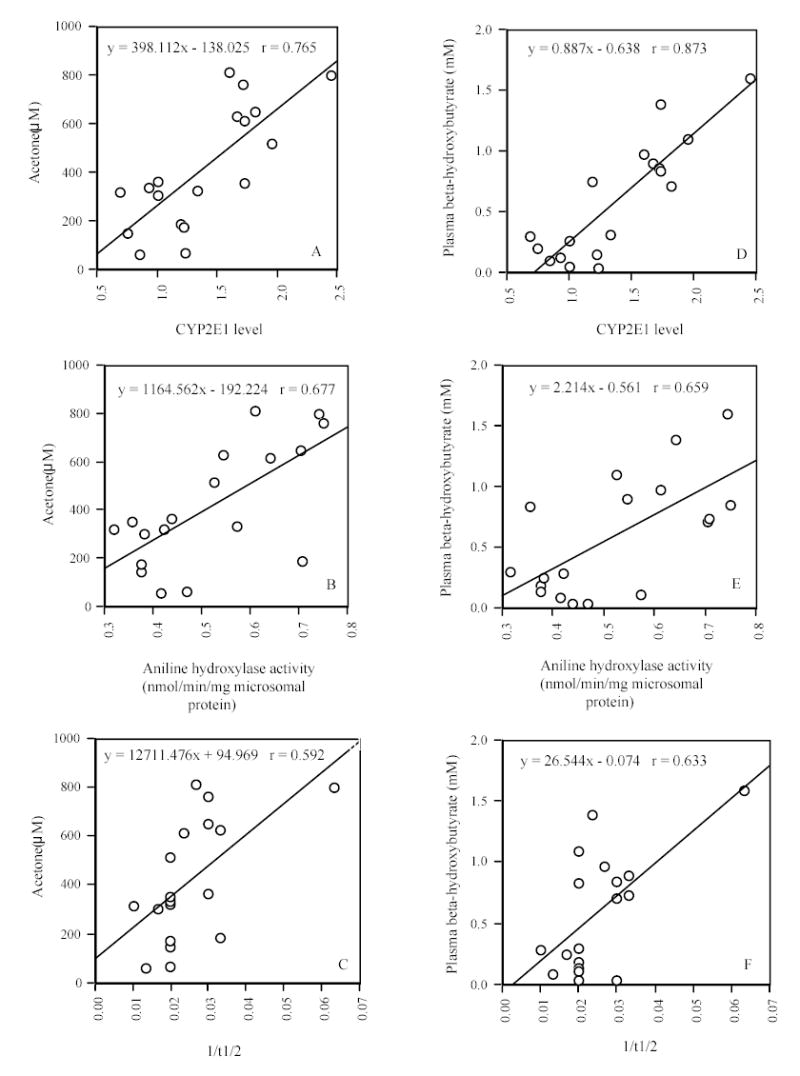
Correlation between plasma acetone or β-hydroxybutyrate and the levels of CYP2E1 contents, activity, or CZ t½. Left panels: Correlation between plasma acetone concentration and liver CYP2E1 level (A), liver CYP2E1 activity (B) and CZ t½ (C) in the oral study. Right panels: Correlation between plasma β-hydroxybutyrate concentration and liver CYP2E1 level (D), liver CYP2E1 activity (E) and CZ t½ (F) in the oral study.
Fig. 4.
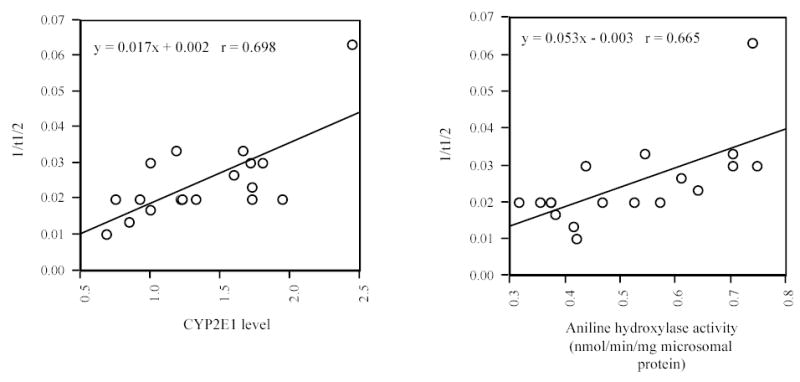
Correlation between CZ t½ and the levels of CYP2E1 content or its activity. Left panel: Correlation between CZ t½ and liver CYP2E1 level. Right panel: Correlation between CZ t½ and liver CYP2E1 activity in the oral study.
Analysis of covariance
The value of 1/t½ for CZ was significantly linearly correlated with CYP2E1 level (r=0.698, p<0.05, Fig. 4. left panel) and liver aniline hydroxylase activity (r=0.665, p<0.05, Fig. 4. right panel), and the value of CL/F for CZ was also significantly correlated with CYP2E1 level (r=0.63, p<0.05). In the MANOVA analysis using 1/t½ as a dependent variable and grouped for two treatments, five variables were selected as simultaneous covariates: AH, EROD, ERNd, PROD activities and CYP2E1 level. The value of 1/t½ was found to significantly correlate to CYP2E1 level (t=2.56, p<0.05) and AH enzyme activities (t=2.66, p<0.05). None of the remaining variables was significantly correlated to 1/t½ (p>0.2). After using AH activity or CYP2E1 level along for covariate, the difference in adjusted means between groups became insignificant (p>0.6). Compatible with covariate analysis, when multiple regression was used with AH, EROD, ERNd, PROD activities and CYP2E1 level as independents, AH and CYP2E1 were found to significantly correlate with 1/t½ (p<0.05), but none of the remaining variables was significantly correlated to 1/t½ (p>0.15).
Discussion
We investigated the effects of fasting on the pharmacokinetics of CZ following both oral and iv administration. Although the iv method is more suitable for determination of the terminal elimination rate, we also investigated the rate of CZ elimination after oral administration to compare the CZ pharmacokinetics parameters with the liver CYP2E1 level or activities, since oral doing is more frequently used especially in humans. We found that fasting rats for 24 hours significantly increased CZ elimination as judged by both t½ and CL/F in both studies, where the changes in in vivo CZ metabolism positively corresponded with the level of CYP2E1 determined by immunoblot analysis. This is opposite to the finding of O'Shea et al (1994) who reported that the value of t½ was increased and the oral systemic clearance of CZ was reduced in 38-hour fasted men. We also found that the induced clearance of CZ was associated with the increased production rate of 6-OHCZ (see Table 3, last column). The observed difference in CZt½ between the oral and IV study is probably caused by the absorption rate in oral study.
Our different finding in rats indicates that interspecies differences may exist in the fasting-induced change in CZ metabolism. In other fasting studies, changes in plasma β-hydroxybutyrate (HB) concentrations have been used as a marker of the extent of fasting (O'Shea et al 1994; Yun et al 1992). In our rat study, HB concentrations increased 6-fold. In the O’Shea et al study, HB concentrations were increased 23-fold following 38 hours of fasting (20 ± 14 to 463 ± 212 μM). Based on this marker and high correlation between blood HB and acetone concentrations, it would be conceivable that liver CYP2E1 should have been induced in humans since acetone is known to increase CYP2E1 level (Song et al 1989), or CYP2E1 was likely induced by endogenously produced HB and/or its closely related compound acetoacetate (Yun et al., 1992). Since insulin concentration is also known to play a role in the down regulation of CYP2E1 and it can be decreased by fasting (Woodcroft and Novak 1997), it may be that insulin concentrations may be another key determinant of whether CYP2E1 induction is likely to occur.
Although fasting produces more acetone, acetone is also a competitive inhibitor of CYP2E1 (Yoo et al 1987; Bondoc et al 1999). In our study, control animals had a mean acetone concentration of 223 μM and fasted animals had a mean concentration of 591 μM. But much lower concentrations of acetone appeared to inhibit CZ metabolism in humans. When CZ was administered to humans concurrently inhaling acetone (Ernstgård et al 1999), CZ concentrations at 3 hr were 50.6 μM compared to 26.8 μM for control subjects (p=0.06) and the 6-OHCZ/CZ ratios were lower than that for control subjects; peak acetone concentrations at 2–3 hours were approximately 250 μM compared to 20 μM in baseline. Since it has been reported that blood acetone concentrations can be as high as 760 μM following 3 days of fasting (Reichard et al 1979), high concentration acetone inhibition of CZ metabolism cannot be excluded as a possible mechanism behind the reduced clearance observed by O’Shea et al. (1994). Based on our rat data that the plasma acetone concentration was positively correlated with 1/t½ and the liver CYP2E1 activity, we believe that the inhibition of CZ metabolism by acetone should be minor due to relatively low acetone concentrations in the fasted rats. However, we can not exclude a possibility of competitive inhibition of CZ 6-hydroxylation by a much higher acetone concentration produced after an extended period of fasting, although CYP2E1 may be continuously induced as well (Hong et al., 1987).
The dose we chose was similar to that used by other scientists (Chen and Yang 1996) who reported that CZ 6-hydroxylation in vivo can readily reflect CYP2E1 induction or inhibition. As the apparent Km of CZ 6-hydroxylation is 40–70 μM in human (Lucas 1999), the catalytic activity of CYP2E1 might be reflected more accurately at these plasma concentrations (assuming a plasma/liver partition coefficient of 1). The maximal plasma concentrations in the study of O’Shea et al. (1994), who used a 250 mg dose of CZ, were less than 35 μM. In addition, CYP2E1 in rats and humans is known to be regulated in a similar manner. For instance, rat CYP2E1 was shown to be induced by alcohol and in fasting, diabetic, or obese condition (Hong et al 1987; Song et al 1987; Raucy et al 1991). Human CYP2E1 was thought to be induced in these conditions as well (Lucas et al 1995). In this regard, it may be of interest that a higher dose of CZ such as 500 mg (Lucas et al 1999) given to fasted humans would show different results.
Our CZ peak concentrations in control rats were similar to those published by Kaneko et al. (1990), who also used a 25 mg/kg dose. However, our control CZ AUC was a little higher than their results of 1629 μg/ml·min. This difference may result from a different fasting period before CZ administration. Kaneko et al fasted the rats only overnight (>10 h) before dosing, this will probably only slightly induce CYP2E1. Our fitted k and kf values were similar to those reported by Chen and Yang (1996) although they used a slightly larger dose (about 25.4 mg/kg). Fasting significantly increased the 6-OHCZ elimination in rats based on the fitted km of 6-OHCZ, suggesting a possible increase of renal clearance of conjugated 6-OHCZ since 6-OHCZ is excreted in the urine primarily as a glucuronide conjugate (Conney et al 1960). This result also suggests that caution must be taken when 6-OHCZ/CZ is used at certain time points such as 2 hours after doing as an index for phenotyping CYP2E1 in humans with certain physiological conditions such as fasting, and diabetes possibly due to altered 6-OHCZ elimination, although this index was successfully used in many other studies (Lucas et al 1999; Ernstgård L et al 1999). When CZ is used as a tool to phenotype CYP2E1 in humans with starvation or diabetes, it might be appropriate to use CL and t½ of CZ as indexes following a larger oral dose such as 500 or 750 mg.
For orally dosed animals, the value of CL/F could not be calculated for 4 rats because an accurate AUC could not be determined due to technical difficulties at early sampling times. Due to smaller sample size and F varied individually, it is unacceptable to use CL/F for correlation analysis. In the MANOVA (ANOVA?) analysis and regression analysis, we used the reciprocal of t½ of CZ (1/t½) as the dependent variable because 1/t½ is linearly related to CL via the following relationship: t½ = 0.693·F·V/CL. Because we were able to determine the value of CL/F for all animals, we used this value instead. After using both MANOVA (ANOVA) covariate analysis and regression analysis, the value of 1/t½ was found to significantly correlate with liver CYP2E1 level and aniline hydroxylase (CYP2E1) activity. Therefore, our results suggest that CYP2E1 was the predominant enzyme in catalyzing CZ biotransformation in vivo. Our results are consistent with the findings by others (Yamazaki et al 1995; Chen and Yang 1996; Lucas et al 1999) who demonstrated that the role of other P450s in CZ metabolism in vivo is minor. Specifically, Lucas et al. (1999) reported that cigarette smoking, a CYP1A inducer, and grapefruit juice, a CYP3A inhibitor, both failed to modify the CZ metabolic ratio in human subjects. They estimated that the contributions of CYP1A and CYP3A to CZ 6-hydroxylation activity as approximately 0.5% and 2.5% of total activity, respectively. In contrast, other scientists suggested that CYP3A and CYP1A might play significant role in CZ metabolism in human, despite being less important as compared to CYP2E1 (Ono et al 1995; Shimada et al 1999). It was found that CYP4A was induced by starvation (Kroetz et al 1998), but it was possibly not involved in CZ 6-hydroxylation (Hanioka et al 1998). Shimada et al (1999) reported that CYP2B6 had a considerable activity in CZ 6-hydroxylation in vitro, however, it should play a relatively minor role in vivo because of its low expression in the liver.
In agreement with the findings of Fry et al. (1999) and Brown et al. (1995), our data show that CYP2B activity was increased and CYP1A activity was unchanged by fasting. However, in contrast with the finding by Fry et al. (1999), we did not observe an increase in CYP3A activity. The reason for this discrepancy is not clear.
Conclusions
In general, the present study clearly shows that fasting for 24 hours induced CZ metabolism in male Sprague-Dawley rats. This is in contrast to the decreased metabolism of CZ reported for 38-hour fasted men. The in vivo CZ elimination parameter 1/t½ was significantly correlated with liver CYP2E1 level, and the contribution of other P450s to CZ metabolism might be minor in the concentration range that we tested in rats.
Acknowledgments
We would like to thank Robert Rawlings and Dr. Paolo DePetrillo for their helpful comments. This work was supported by the Intramural research fund of the National Institute on Alcohol Abuse and Alcoholism.
References
- Bondoc FY, Bao ZP, Hu WY, Gonzalez FJ, Wang YY, Yang CS, Hong JY. Acetone catabolism by cytochrome P450 2E1: Studies with CYP2E1-null mice. Biochem Pharmacol. 1999;58:461–463. doi: 10.1016/s0006-2952(99)00111-2. [DOI] [PubMed] [Google Scholar]
- Brown BL, Allis JW, Simmons JE, Barrow DE. Fasting for less than 24 hours induces cytochrome P450 2E1 and 2B1/2 activities in rats. Toxicol Lett. 1995;81:39–44. doi: 10.1016/0378-4274(95)03407-2. [DOI] [PubMed] [Google Scholar]
- Burke MD, Thompson S, Elcombe CR, Halpert J, Haaparantaand T, Mayer RT. Ethoxy-, pentoxy-and benzyloxyphenoxazones and homologues: a series of substrates to distinguish between different induced cytochromes P-450. Biochem Pharmacol. 1985;34:3337–3345. doi: 10.1016/0006-2952(85)90355-7. [DOI] [PubMed] [Google Scholar]
- Chen LS, Yang CS. Effects of cytochrome P450 2E1 modulators on the pharmacokinetics of chlorzoxazone and 6-hydroxychlorzoxazone in rats. Life Sci. 1996;58:1575–1585. doi: 10.1016/0024-3205(96)00132-4. [DOI] [PubMed] [Google Scholar]
- Conney AH, Burns JJ. Physiological disposition and metabolic fate of chlorzoxazone (paraflex) in man. J Pharmacol Exp Ther. 1960;128:340–343. [PubMed] [Google Scholar]
- Dupont I, Lucas D, Clot P, Menez C, Albano E. Cytochrome P4502E1 inducibility and hydroxyethyl radical formation among alcoholics. J Hepatol. 1998;28:564–567. doi: 10.1016/s0168-8278(98)80279-1. [DOI] [PubMed] [Google Scholar]
- Emery MG, Jubert C, Thummel KE, Kharasch ED. Duration of cytochrome P-450 2E1 (CYP2E1) inhibition and estimation of functional CYP2E1 enzyme half-life after single-dose disulfiram administration in humans. J Pharmacol Exp Ther. 1999;291:213–219. [PubMed] [Google Scholar]
- Ernstgård L, Gullstrand E, Johanson G, Lof A. Toxicokinetic interactions between orally ingested chlorzoxazone and inhaled acetone or toluene in male volunteers. Toxicol Sci. 1999;48:189–196. doi: 10.1093/toxsci/48.2.189. [DOI] [PubMed] [Google Scholar]
- Fry JR, Sinclair D, Piper CH, Townsend SL, Thomas NW. Depression of glutathione content, elevation of CYP2E1-dependent activation, and the principal determinant of the fasting-mediated enhancement of 1,3-dichloro-2-propanol hepatotoxicity in the rat. Food Chem Toxicol. 1999;37:351–355. doi: 10.1016/s0278-6915(99)00012-5. [DOI] [PubMed] [Google Scholar]
- Gorski JC, Jones DR, Wrighton SA, Hall SD. Contribution of human CYP3A subfamily members to the 6-hydroxylation of chlorzoxazone. Xenobiotica. 1997;27:243–256. doi: 10.1080/004982597240578. [DOI] [PubMed] [Google Scholar]
- Guengerich FP, Kim DH, Iwasaki M. Role of human cytochrome P450IIE1 in the oxidation of many low molecular weight cancer suspects. Chem Res Toxicol. 1991;4:168–179. doi: 10.1021/tx00020a008. [DOI] [PubMed] [Google Scholar]
- Hanioka N, Jinno H, Tanaka T, Nishimura H, Ando M. Change in rat liver cytochrome P450 enzymes by atrazine and simazine treatment. Xenobiotica. 1998;28:683–698. doi: 10.1080/004982598239263. [DOI] [PubMed] [Google Scholar]
- Hong JY, Pan J, Gonzalez FJ, Gelboin HV, Yang CS. The induction of a specific form of cytochrome P-450 (P450j) by fasting. Biochem Biophys Res Commun. 1987;142:1077–1083. doi: 10.1016/0006-291x(87)91525-7. [DOI] [PubMed] [Google Scholar]
- Kaneko I, Fukumori Y, Fukuda T, Takeuchi Y. Relation of disposition kinetics to pharmacological effect of intravenous administration of chlorzoxazone in rats. J Pharmacobiodyn. 1990;13:367–373. doi: 10.1248/bpb1978.13.367. [DOI] [PubMed] [Google Scholar]
- Koop DR, Coon MJ. Ethanol oxidation and toxicity: roles of alcohol-P450 oxygenase. Alcoholism Clin Exp Res. 1986;10:44–54. doi: 10.1111/j.1530-0277.1986.tb05179.x. [DOI] [PubMed] [Google Scholar]
- Kroetz DL, Yook P, Coster P, Bianchi P, Pineau T. Peroxisome proliferator activated receptor alpha controls the hepatic CYP4A induction adaptive response to starvation and diabetes. J Biol Chem. 1998;273:31581–31589. doi: 10.1074/jbc.273.47.31581. [DOI] [PubMed] [Google Scholar]
- Lucas D, Berthou F, Girre C, Poitrenaud F, Menez JF. High-performance liquid chromatographic determination of chlorzoxazone and 6-hydroxychlorzoxazone in serum: a tool for indirect evaluation of cytochrome P4502E1 activity in humans. J Chromatogr. 1993;622:79–86. doi: 10.1016/0378-4347(93)80252-y. [DOI] [PubMed] [Google Scholar]
- Lucas D, Menez C, Girre C, Bodenez P, Hispard E, Menez JF. Decrease in cytochrome P450 2E1 as assessed by the rate of chlorzoxazone hydroxylation in alcoholics during the withdrawal phase. Alcoholism Clin Exp Res. 1995;19:362–366. doi: 10.1111/j.1530-0277.1995.tb01516.x. [DOI] [PubMed] [Google Scholar]
- Lucas D, Ferrara R, Gonzalez E, Bodenez P, Albores A, Manno M, Berthou F. Chlorzoxazone, a selective probe for phenotyping CYP2E1 in humans. Pharmacogenetics. 1999;9:377–388. doi: 10.1097/00008571-199906000-00013. [DOI] [PubMed] [Google Scholar]
- Ono S, Hatanaka T, Hotta H, Tsutsui M, Satoh T, Gonzalez FJ. Chlorzoxazone is metabolized by human CYP1A2 as well as by human CYP2E1. Pharmacogenetics. 1995;5:143–150. doi: 10.1097/00008571-199506000-00002. [DOI] [PubMed] [Google Scholar]
- O'Shea D, Davis SN, Kim RB, Wilkinson GR. Effect of fasting and obesity in humans on the 6-hydroxylation of chlorzoxazone: a putative probe of CYP2E1 activity. Clin Pharmacol Ther. 1994;56:359–367. doi: 10.1038/clpt.1994.150. [DOI] [PubMed] [Google Scholar]
- Peter R, Bocker R, Beaune PH, Iwasaki M, Guengerich FP, Yang CS. Hydroxylation of chlorzoxazone as a specific probe for human liver cytochrome P450IIE1. Chem Res Toxicol. 1990;3:566–573. doi: 10.1021/tx00018a012. [DOI] [PubMed] [Google Scholar]
- Raucy JL, Lasker JM, Lieber CS, Black M. Acetaminophen activation by human liver cytochrome P450IIE1 and P450IA2. Arch Biochem Biophys. 1989;271:270–283. doi: 10.1016/0003-9861(89)90278-6. [DOI] [PubMed] [Google Scholar]
- Raucy JL, Lasker JM, Kraner JC, Salazar DE, Lieber CS, Corcoran JB. Induction of cytochrome P450 IIE1 in the obese overfed rat. Mol Pharmacol. 1991;39:275–280. [PubMed] [Google Scholar]
- Reichard GA, Jr, Haff AC, Skutches CL, Paul P, Holroyde CP, Owen OE. Plasma acetone metabolism in the fasting human. J Clin Invest. 1979;63:619–626. doi: 10.1172/JCI109344. [DOI] [PMC free article] [PubMed] [Google Scholar]
- Roberts BJ, Song BJ, Soh Y, Park SS, Shoaf SE. Ethanol induces CYP2E1 by protein stabilization. J Biol Chem. 1995a;270:29632–29635. doi: 10.1074/jbc.270.50.29632. [DOI] [PubMed] [Google Scholar]
- Roberts BJ, Shoaf SE, Song BJ. Rapid changes in cytochrome P4502E1 activity and other P450 isozymes following ethanol withdrawal in rats. Biochem Pharmacol. 1995b;49:1665–1673. doi: 10.1016/0006-2952(95)00098-k. [DOI] [PubMed] [Google Scholar]
- Shimada T, Tsumura F, Yamazaki H. Prediction of human liver microsomal oxidations of 7-ethoxycoumarin and chlorzoxazone with kinetic parameters of recombinant cytochrome P-450 enzymes. Drug Metab Dispos. 1999;27:1274–1280. [PubMed] [Google Scholar]
- Song BJ, Gelboin HV, Park SS, Yang CS, Gonzalez FJ. Complementary DNA and protein sequences of ethanol-inducible rat and human P450s: transcriptional and post-transcriptional regulation of the rat enzyme. J Biol Chem. 1986;261:16689–16697. [PubMed] [Google Scholar]
- Song BJ, Matsunaga T, Hardwick JP, Park SS, Veech RL, Yang CS, Gelboin HV, Gonzalez FJ. Stabilization of cytochrome P450j messenger ribonucleic acid in the diabetic rat. Mol Endocrinol. 1987;1:542–547. doi: 10.1210/mend-1-8-542. [DOI] [PubMed] [Google Scholar]
- Song BJ, Veech RL, Park SS, Gelboin HV, Gonzalez FJ. Induction of rat hepatic N-nitrosodimethylamine demethylase by acetone is due to protein stabilization. J Biol Chem. 1989;264:3568–3572. [PubMed] [Google Scholar]
- Wan J, Bae MA, Song BJ. Acetoaminophen-induced oxidative DNA damage through reduction of Ogg1 DNA repair enzyme in C6 glioma cells. Exp Mol Med. 2004;36:71–77. doi: 10.1038/emm.2004.10. [DOI] [PubMed] [Google Scholar]
- Wang RW, Newton DJ, Scheri TD, Lu AYH. Human cytochrome P450 3A4-catalyzed testosterone 6β-hydroxylation and erythromycin N-demethylation. Drug Metab Dispos. 1997;25:502–507. [PubMed] [Google Scholar]
- Woodcroft KJ, Novak RF. Insulin effects on CYP2E1, 2B, 3A, and 4A expression in primary cultured rat hepatocytes. Chem-Biol Interact. 1997;107:75–91. doi: 10.1016/s0009-2797(97)00075-6. [DOI] [PubMed] [Google Scholar]
- Yamazaki H, Guo ZY, Guengerich FP. Selectivity of cytochrome P4502E1 in chlorzoxazone 6-hydroxylation. Drug Metab Dispos. 1995;23:438–440. [PubMed] [Google Scholar]
- Yang CS, Yoo JSH, Ishizaki H, Hong J. Cytochrome P450IIE1, roles in nitrosamine metabolism and mechanism of regulation. Drug Metab Rev. 1990;22:147–159. doi: 10.3109/03602539009041082. [DOI] [PubMed] [Google Scholar]
- Yoo JSH, Cheung RJ, Patten CJ, Wade D, Yang CS. Nature of N-Nitrosodimethylamine demethylase and its inhibitors. Cancer Res. 1987;47:3378–3383. [PubMed] [Google Scholar]
- Yun YP, Casazza JP, Sohn DH, Veech RL, Song BJ. Pretranslational activation of cytochrome-P450IIE during ketosis induced by high fat diet. Mol Pharmacol. 1992;41:474–479. [PubMed] [Google Scholar]