

Abstract
Background
The Growth, Exercise and Nutrition Epidemiological Study in preSchoolers (GENESIS) attempts to evaluate the food and nutrient intakes, as well as growth and development of a representative sample of Greek toddlers and preschool children. In the current work the study design, data collection procedures and some preliminary data of the GENESIS study are presented.
Methods
From April 2003 to July 2004, 1218 males and 1156 females 1 to 5 years old, stratified by parental educational level (Census 1999), were examined from 105 nurseries in five counties. Approximately 300 demographic, lifestyle, physical activity, dietary, anthropometrical and DNA variables have been recorded from the study population (children and parents).
Results
Regarding anthropometrical indices, boys were found to be taller than girls at all ages (P < 0.05) and heavier only for the age period from 1 to 3 years old (P < 0.05). No significant differences were found between genders regarding the prevalence of at risk of overweight (16.5% to 18.6% for boys and 18.5 to 20.6 % for girls) and overweight (14.0% to 18.9% for boys and 12.6% to 20.0% for girls). Additionally, boys older than 2 years of age were found to have a higher energy intake compared to girls (P < 0.05). A similar tendency was observed regarding the mean dietary intake of fat, saturated fat, carbohydrates and protein with boys exhibiting a higher intake than girls in most age groups (P < 0.05).
Conclusion
The prevalence of overweight in the current preschool population is considerably high. Future but more extensive analyses of the GENESIS data will be able to reveal the interactions of the parameters leading to this phenomenon.
Background
Infancy and early childhood are both critical periods of rapid physical growth, cognitive and emotional development [1]. Food intake and lifestyle parameters have a central role in this process since they could ensure optimum growth and development on the one hand but also set the basis for a healthy transition through adulthood with lower predisposition for chronic diseases. Several studies have indicated that the roots of chronic disease, both the clinical manifestation of the diseases as well as certain lifestyle patterns and food preferences, may be set in childhood and track into adulthood [2-5].
The realization that the adoption of these health related behaviours may set early in life and is very much determined by internal (i.e family) and external (i.e health professionals, media, food industry) to the child's environment parameters [6], has underlined the need for nutritional surveys in childhood. These surveys are aiming to examine the health and nutritional status of children as well as all the parameters involved in this process, including the health knowledge and practices of parents and caregivers. Expanding our knowledge and understating of the interactions of all these parameters will help and guide public health authorities in developing effective directions both towards the food industry but also towards health promoting bodies, including the family itself.
Several national epidemiological surveys have been conducted so far in industrialized countries, aiming to achieve this goal. Typical examples of such studies are the National Health and Nutrition Examination Surveys (NHANES) I, II and III [7], the Continuing Survey of Food Intakes by Individuals (CSFII) [8] and the 1987–1988 Nationwide Food Consumption Survey (NFCS) [9]. Similar surveys have been conducted in Europe either at a pan European [10] or a country level, using nationally representative samples [11-15] or just small regional cohorts of preschoolers [16-19]. In Greece similar data are only scarce, while probably the most comprehensive data are those provided by Roma-Giannikou et al. [20] on a stratified multiform sample of 2–14 years old children conducted about ten years ago.
The Growth, Exercise and Nutrition Epidemiological Study in preSchoolers (GENESIS) is a large-scale epidemiological study conducted in Greece, attempting to assess growth, development and nutritional status of preschool children. The current paper attempts to provide some information on the study design and data collection procedures, sample's characteristics, as well as some first descriptive results.
Methods
Sampling
The study was carried out from April 2003 to July 2004. A representative number of randomly selected public and private nurseries as well as day-care centers within municipalities in five counties (namely Attica, Aitoloakarnania, Thessalonica, Halkidiki and Helia) were invited to participate in the study. All nurseries invited to participate responded positively. Furthermore, an extended letter explaining the aims of the current study and a consent form was provided to each parent or guardian having a child in these nurseries. Those parents agreed to participate in the study had to sign the consent form and provide their contact details. Signed parental consent forms were collected for 2518 children, aged 1 to 5 years old (Response rate 75%). From the total number of positive responses complete data became available for 2374 children with participation rate varying from 54% to 95%, reaching the highest rates in rural areas and the lowest ones in urban areas.
These counties are widely scattered over the Greek dominion (Figure 1) while their overall local population comprises about 70% of the total Greek population (Census 1999). Among the total number of nursery schools studied (n = 105), 63 were in Attica, 8 were in Thessalonica, 12 were in Halkidiki, 22 were in Aitoloakarnania and 7 were in Helia. The sampling of the nurseries was random, multistage and stratified by the total population of children, according to data provided by the National Statistical Service of Greece (Census 1999).
Figure 1.
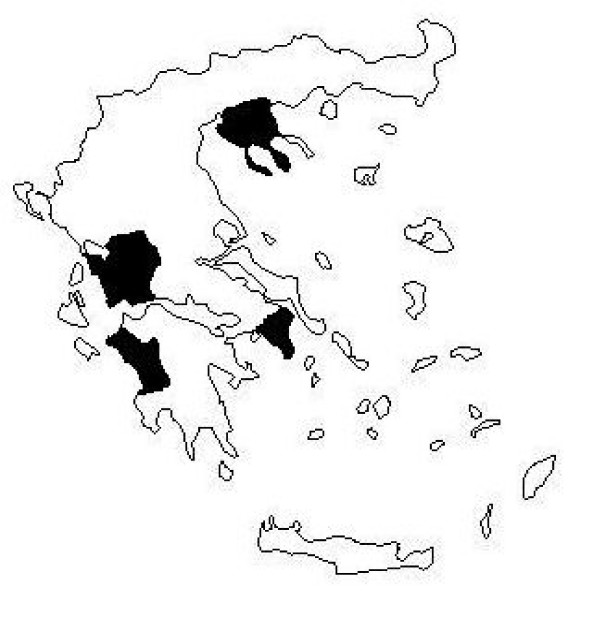
Counties of Greece studied.
The participating regions were grouped based on their population in "Large Urban Areas", with a population size greater than 1,000,000; "Urban Areas" with a population size ranging from 10,000 to 100,000; and "Rural Areas and Small Towns" with a population size less than 10,000 inhabitants. The aforementioned classification stems from a particularity of the population distribution in Greece, according to which there are plenty of "Rural Areas and Small Towns", as well as "Urban" areas but only two "Large Urban" areas of approximately 1,200,000 and 4,500,000 citizens, respectively.
Approval to conduct the study was granted by the Ethical Committee of Harokopio University of Athens and by all municipalities invited to participate in the study.
Anthropometrical Measurements
All study sites used the same measuring equipment and procedures. The instruments needed to be highly accurate and precise, yet portable enough to be carried to the nursery schools, where the measurements took place. Measurements were taken and recorded by two well-trained team members, which are referred as "leading" and assisting" observer, respectively. The role of the "assisting" observer was to help position the child correctly to the instruments, while the "leading" observer recorded the measurements.
Body weight was recorded to the nearest 10 gr with the use of a Seca digital scale and with subjects standing without shoes in the minimum clothing possible, i.e. underwear. Recumbent length was measured for all subjects to the nearest 0.1 cm with a portable measuring wooden board that had a stationary head piece, a sliding vertical foot piece and a horizontal back piece with a measure tape mounted on it. Further to recumbent length, standing height was also measured to the nearest 0.1 cm in children older than two years of age, with the use of a commercial stadiometer (Leicester Height Measure). The measurement of height was conducted without shoes and with children keeping their shoulders in a relaxed position, their arms hanging freely and with their head aligned in Frankfurt plane. Body Mass Index (BMI) was calculated by dividing weight (Kg) with standing height squared (m2).
Head, waist, hip and right arm circumferences were measured to the nearest 0.1 cm with the use of a non-elastic tape (Hoechstmass, Germany) and with the subject at a standing position. More specifically, head circumference was measured to the nearest 0.1 cm after aligning the head in Frankfurt plane and passing the measure tape around the head, just above the eyebrows, above the ears on each side and over the occipital prominence at the back of the head to its maximal circumference. Waist circumference was measured at the end of a gentle expiration after placing the measuring tape in a horizontal plane around the trunk, at the level of umbilicus midway between the lower rib margin and the iliac crest. Hip circumference was measured at the point yielding the maximum circumference over the buttocks. Right arm circumference was measured at the mid-upper-arm point, which is half the distance between the acromion and the olecranon.
The thickness of four skinfolds (triceps, biceps, subscapular and suprailiac) was measured to the nearest 0.1 mm to the right side of the body with a Lange skinfold caliper (Cambridge, Maryland). Each skinfold was grasped gently, in order to avoid causing any unnecessary discomfort to the child. Triceps and biceps skinfold thickness was measured with the right arm hanging relaxed at the side of the body while the skinfold was picked up about 1 cm bellow the midpoint mark over the triceps and biceps muscle respectively. Measurement of the subscapular skinfold thickness was performed while the child stood with shoulders relaxed and after identifying the inferior angle of the scapula. The skinfold was picked up 1 cm below the subscapular mark. Suprailiac skinfold was measured just above the iliac crest, along the axis of the anterior line. In each case the caliper was applied to the "neck" of the fold just above the finger and thumb, for two repeated measurements.
Dietary Assessment
Dietary intake data was obtained for 3 days (2 consecutive weekdays and 1 weekend day) using a combination of techniques comprising the weighed food records (during nursery hours) and 24 h recall or food diaries (outside nurseries, under parents/guardians supervision). More specifically, during the two weekdays, and while the child was at the nursery, a team member weighed and recorded all foods consumed by each child. Information on the food consumed outside the nursery was obtained during a prearranged meeting with the parent or guardian at the following day. During the interview each parent or guardian was familiarized with portion sizes and the relevant procedures in order to successfully complete a food record at home in the forthcoming weekend day, most preferably Sunday. Parents were advised to return the food diaries at the nursery on Monday morning, where a team member received and checked the records for any miss-recorded or missing information.
Food intake data were analyzed using the Nutritionist V diet analysis software (First Databank, San Bruno, CA), which was extensively amended to include traditional Greek foods and recipes, as described in Food Composition Tables and Composition of Greek Cooked Food and Dishes [21,22]. Furthermore, the databank was updated with nutritional information of chemically analyzed commercial food items widely consumed by the preschool and infant population of Greece. The distribution of usual intakes was estimated by using the National Research Council method (NRC method) [23], which attempts to remove the effects of day-to-day variability (within subject) in dietary intakes. More specifically, the equation used for the calculation of adjusted (usual) intake was the following:
[(Subject's mean - group mean) × SDbetween-person/SDobserved] + group mean
Physical activity assessment
Information on children's physical activity was obtained by the parent/guardian during the interview conducted with the assistance of a valid, structured questionnaire [24]. Guardians were asked to provide information of the child's participation in outdoor organized or non-organized physical activities while a research team member was recording this information on this proxy questionnaire. Emphasis was placed on Light to Vigorous Physical Activities (L-VPA) with intensity higher than 4 Metabolic Equivalents (METs). Typical L-VPAs for the younger age groups were playground recreational activities and taking walks with parents while sports participation, such as soccer, swimming, ballet, gymnastics etc were more commonly reported for the older age group. In general L-VPA consisted of all outdoor activities that cause heavy breathing to the child and that have a duration longer than 20 minutes, taking occasional breaks. This approach is not as strict as in adults and older children, which requires 30 minutes of continuous activity, causing heavy breathing and sweating.
Additional information obtained by parents
During the morning interview at the nursery, additional information were obtained by the guardians concerning (a) demographic characteristics, such as parent's age, employment status and years of education; (b) anthropometrical data, such as current height and body weight of both parents and of child's siblings, as well as a weight history of mother's before conception, before and after child-birth; (c) medical history for siblings, parents and grandparents; (d) smoking and alcohol consumption during pregnancy and breastfeeding, as well as vitamins and/or minerals supplements used during pregnancy; (e) children's feeding patterns from birth to six months of age; (f) parent's perceptions and concerns regarding their children's current eating behaviors, weight status, growth and physical activity levels. Furthermore, parents were asked to bring with them the medical record of their child from where information on child's weight, length and head circumference for the first 12 months of life were copied. Additional information on child's medical history, infections, health problems and intolerances were also recorded.
DNA sample collection
Buccal cells were collected with a non-invasive and completely painless method, by twirling a sterilized swab on the child's inner cheek for about 10 seconds. The head of the swab was then immersed in a 2 ml microcentrifuge tube, whereas the collected buccal cells would be further isolated for DNA extraction.
Definition of overweight
The Nutstat module of EpiInfo [25] was used to determine the age and sex-specific percentiles for weight, length and BMI, according to the Centers for Disease Control (CDC) 2000 Growth Charts [26]. Using the CDC weight-for-length growth charts children up to 24 months of age were classified as underweight (≤ 5th percentile) and overweight (≥ 95th percentile). For children older than 24 months, the CDC BMI-for-age growth charts were used for their categorization as underweight (≤ 5th percentile), at risk of overweight (85th–95th percentile) and overweight (≥ 95th percentile).
Statistical Analysis
Descriptive statistics of continuous variables were expressed as Mean ± Standard Deviation (SD) and as proportions for categorical ones. Non-normally distributed variables were logarithmically transformed prior to the analysis. Differences between males and females were evaluated with the unpaired Student's t-test for normally distributed variables and with the non-parametric univariate Mann-Whitney test for skewed variables. Furthermore the chi-square test was used to compare proportions between sexes. The statistical analysis was carried out using the SPSS 11.0 statistical software package for Windows. The level of significance was set at p ≤ 0.05.
Results
The mean age of all children surveyed was 41.4 ± 11.0 months. The main demographic characteristics of the under study population and the total number of children examined by region of residence is presented in Table 1. Gender was equally distributed in all age groups and regions or residence. Still more subjects were recruited from Large Urban areas reflecting the distribution of the overall population in Greece.
Table 1.
Description of the study population by gender, age group and region of residence.
| Boys | Girls | |||
| n | % | n | % | |
| Age Group | ||||
| First (1–2 yrs old) | 100 | 8.2 | 107 | 9.3 |
| Second (2–3 yrs old) | 274 | 22.5 | 226 | 19.6 |
| Third (3–4 yrs old) | 488 | 40.1 | 434 | 37.5 |
| Fourth (4–5 yrs old) | 356 | 29.2 | 389 | 33.7 |
| Region of Residence | ||||
| Rural Areas & Small Towns | 261 | 21.4 | 247 | 21.4 |
| Urban Areas | 281 | 23.1 | 252 | 21.8 |
| Large Urban Areas | 676 | 55.5 | 657 | 56.8 |
| Total | 1218 | 1156 | ||
The study population could be considered representative at a county level, since parental distribution by age and educational level was similar to that reported by the National Statistical Service (Census 1999) for the overall population of the respective county (Table 2). Based on this finding and in agreement with the National Statistical Service the prevalence of highly educated parents is higher in "Large Urban Areas" compared to "Urban Areas" and "Rural Areas and Small Towns".
Table 2.
Parental educational level by county
| Counties | ||||||||||
|
Attica* (n = 1257) |
Etoloakarnania† (n = 449) |
Halkidiki† (n = 319) |
Helia† (n = 155) |
Thessalonica* (n = 194) |
||||||
| n | (%) | n | (%) | n | (%) | n | (%) | n | (%) | |
| Father's educational level | ||||||||||
| Illiterate- elementary | 35 | (2.7) | 43 | (9.6) | 32 | (10.1) | 7 | (4.4) | 5 | (2.5) |
| Junior high school | 57 | (4.5) | 62 | (13.7) | 60 | (18.7) | 31 | (20.3) | 25 | (13.1) |
| High school | 450 | (35.8) | 186 | (41.5) | 114 | (35.9) | 59 | (38.0) | 62 | (31.7) |
| Further education | 715 | (56.9) | 158 | (35.2) | 113 | (35.3) | 55 | (37.3) | 102 | (52.8) |
| Mother's educational level | ||||||||||
| Illiterate- elementary | 19 | (1.5) | 29 | (6.5) | 7 | (2.1) | 7 | (4.5) | 9 | (4.5) |
| Junior high school | 50 | (4.0) | 44 | (9.8) | 40 | (12.6) | 14 | (8.9) | 16 | (8.5) |
| High school | 370 | (29.4) | 178 | (39.7) | 116 | (36.5) | 53 | (34.4) | 48 | (24.5) |
| Further education | 818 | (65.1) | 198 | (44.0) | 156 | (48.8) | 81 | (52.2) | 121 | (62.5) |
The sampling was random, multistage and stratified by parental educational level according to data provided by the National Statistical Service of Greece (Census of 1999).
*: "Large Urban Areas"
†: "Urban Areas" and "Rural Areas and Small Towns"
Table 3 shows some anthropometric characteristics of the study sample, by gender and age group. According to these data, male subjects in all age groups were found to be significantly taller (P < 0.05) compared to their female counterparts. Mean weight was found to be higher for boys compared to girls for the first and second age groups (P < 0.001 and P = 0.018 respectively) while no such differences were observed in the other age groups. The prevalence of "overweight" for the first age group was found to be 16.8% and 12.6% for boys and girls respectively (Table 3). For older children the overall prevalence of "at risk of overweight" and "overweight" showed an increasing tendency with age (from 32.6% to 35.4% for boys and from 32.6% to 40.5% for girls). No differences were found between genders regarding mean BMI values and the prevalence of "at risk of overweight" and "overweight" for all age groups.
Table 3.
Descriptive statistics of important anthropometric, dietary and behavioral variables tested, by age group.
| Variables | First Age Group (12–24 months old) | ||||
| Boys | Girls | P-value | |||
| Anthropometrical | Mean ± s.d | Mean ± s.d | |||
| Weight§(Kg) | 12.7 ± 1.8 | 11.7 ± 1.8 | <0.001 | ||
| Height† (cm) | 85.4 ± 5.8 | 82.6 ± 4.8 | <0.001 | ||
| BMI (Kg/m2) | - | - | - | ||
| n | % | n | % | ||
| Underweight | 1 | 1.0 | 2 | 2.1 | 0.573 |
| At risk of overweight | - | - | - | - | - |
| Overweight | 16 | 16.8 | 12 | 12.6 | 0.380 |
| Nutrient Intake | Mean ± s.d | Mean ± s.d | |||
| Energy§ (MJ/day) | 5.35 ± 0.88 | 5.22 ± 0.75 | 0.312 | ||
| (Kcal/day) | 1277.4 ± 211.3 | 1246.9 ± 178.5 | |||
| Total Fat§ (gr/day) | 53.0 ± 13.4 | 51.4 ± 11.6 | 0.394 | ||
| Total Fat (% of Energy) | 37.1 ± 5.2 | 36.9 ± 5.3 | 0.772 | ||
| Saturated Fat§ (gr/day) | 19.9 ± 7.4 | 19.3 ± 5.2 | 0.672 | ||
| Saturated Fat§ (% of Energy) | 13.8 ± 3.3 | 13.8 ± 2.7 | 0.910 | ||
| Carbohydrates§ (gr/day) | 154.0 ± 26.5 | 151.2 ± 24.9 | 0.472 | ||
| Carbohydrates§ (% of Energy) | 48.4 ± 5.3 | 48.6 ± 5.5 | 0.792 | ||
| Protein§ (gr/ day) | 52.2 ± 10.7 | 50.5 ± 9.6 | 0.287 | ||
| Protein§ (% of Energy) | 16.3 ± 1.8 | 16.2 ± 1.7 | 0.597 | ||
| Behavioral | Mean ± s.d | Mean ± s.d | |||
| TV watching (hrs/day)* | 0.55 ± 0.88 | 0.46 ± 0.80 | 0.671 | ||
| L-VPA (hrs/week)* | 1.45 ± 3.15 | 1.05 ± 2.29 | 0.498 | ||
| Variables | Second Age Group (25–36 months old) | ||||
| Boys | Girls | P-value | |||
| Anthropometrical | Mean ± s.d | Mean ± s.d | |||
| Weight§(Kg) | 15.2 ± 2.5 | 14.7 ± 2.2 | 0.018 | ||
| Height† (cm) | 95.4 ± 4.5 | 94.1 ± 4.5 | 0.008 | ||
| BMI (Kg/m2) | 17.2 ± 2.4 | 17.0 ± 2.0 | 0.208 | ||
| n | % | n | % | ||
| Underweight | 9 | 3.5 | 7 | 3.3 | 0.919 |
| At risk of overweight | 48 | 18.6 | 39 | 18.5 | 0.973 |
| Overweight | 36 | 14.0 | 32 | 15.2 | 0.711 |
| Nutrient Intake | Mean ± s.d | Mean ± s.d | |||
| Energy§ (MJ/day) | 5.84 ± 0.95 | 5.61 ± 0.91 | 0.007 | ||
| (Kcal/day) | 1394.9 ± 227.5 | 1338.0 ± 218.6 | |||
| Total Fat§ (gr/day) | 62.5 ± 13.6 | 59.3 ± 13.8 | 0.008 | ||
| Total Fat (% of Energy) | 40.2 ± 4.4 | 39.7 ± 4.9 | 0.238 | ||
| Saturated Fat§ (gr/day) | 23.1 ± 6.3 | 21.6 ± 5.9 | 0.004 | ||
| Saturated Fat§ (% of Energy) | 14.8 ± 2.7 | 14.4 ± 2.7 | 0.075 | ||
| Carbohydrates§ (gr/day) | 157.5 ± 29.6 | 152.5 ± 27.2 | 0.085 | ||
| Carbohydrates§ (% of Energy) | 45.2 ± 5.0 | 45.8 ± 5.2 | 0.264 | ||
| Protein§ (gr/ day) | 57.8 ± 11.7 | 55.2 ± 12.6 | 0.013 | ||
| Protein§ (% of Energy) | 16.6 ± 2.1 | 16.5 ± 2.3 | 0.465 | ||
| Behavioral | Mean ± s.d | Mean ± s.d | |||
| TV watching (hrs/day)* | 1.20 ± 1.20 | 1.18 ± 1.23 | 0.527 | ||
| L-VPA (hrs/week)* | 1.51 ± 2.63 | 1.21 ± 2.41 | 0.377 | ||
| Variables | Third Age Group (37–48 months old) | ||||
| Boys | Girls | P-value | |||
| Anthropometrical | Mean ± s.d | Mean ± s.d | |||
| Weight§(Kg) | 17.3 ± 2.5 | 17.0 ± 2.7 | 0.098 | ||
| Height† (cm) | 103.0 ± 4.7 | 102.1 ± 4.6 | 0.003 | ||
| BMI (Kg/m2) | 16.8 ± 1.8 | 16.6 ± 1.8 | 0.307 | ||
| n | % | n | % | ||
| Underweight | 15 | 3.2 | 12 | 2.9 | 0.808 |
| At risk of overweight | 79 | 17.0 | 84 | 20.6 | 0.173 |
| Overweight | 90 | 19.4 | 62 | 15.2 | 0.106 |
| Nutrient Intake | Mean ± s.d | Mean ± s.d | |||
| Energy§ (MJ/day) | 6.04 ± 0.99 | 5.78 ± 0.99 | <0.001 | ||
| (Kcal/day) | 1442.4 ± 237.1 | 1379.0 ± 237.3 | |||
| Total Fat§ (gr/day) | 65.1 ± 14.3 | 62.3 ± 14.2 | 0.004 | ||
| Total Fat (% of Energy) | 40.4 ± 4.5 | 40.5 ± 4.6 | 0.857 | ||
| Saturated Fat§ (gr/day) | 23.5 ± 6.3 | 22.5 ± 6.3 | 0.024 | ||
| Saturated Fat§ (% of Energy) | 14.6 ± 2.8 | 14.6 ± 2.8 | 0.779 | ||
| Carbohydrates§ (gr/day) | 161.9 ± 30.1 | 154.6 ± 29.2 | <0.001 | ||
| Carbohydrates§ (% of Energy) | 45.0 ± 4.8 | 45.0 ± 4.8 | 0.991 | ||
| Protein§ (gr/ day) | 59.8 ± 12.7 | 56.9 ± 12.6 | <0.001 | ||
| Protein§ (% of Energy) | 16.6 ± 2.2 | 16.5 ± 2.1 | 0.505 | ||
| Behavioral | Mean ± s.d | Mean ± s.d | |||
| TV watching (hrs/day)* | 1.89 ± 1.53 | 1.81 ± 1.32 | 0.780 | ||
| L-VPA (hrs/week)* | 1.27 ± 2.52 | 1.09 ± 2.09 | 0.851 | ||
| Variables | Fourth Age Group (49–60 months old) | ||||
| Boys | Girls | P-value | |||
| Anthropometrical | Mean ± s.d | Mean ± s.d | |||
| Weight§(Kg) | 19.6 ± 3.2 | 19.2 ± 3.4 | 0.116 | ||
| Height† (cm) | 109.8 ± 4.8 | 108.8 ± 5.3 | 0.006 | ||
| BMI (Kg/m2) | 16.6 ± 1.9 | 16.6 ± 2.0 | 0.889 | ||
| n | % | n | % | ||
| Underweight | 11 | 3.3 | 8 | 2.2 | 0.371 |
| At risk of overweight | 55 | 16.5 | 75 | 20.5 | 0.166 |
| Overweight | 63 | 18.9 | 73 | 20.0 | 0.704 |
| Nutrient Intake | Mean ± s.d | Mean ± s.d | |||
| Energy§ (MJ/day) | 6.18 ± 0.12 | 5.92 ± 0.11 | 0.009 | ||
| (Kcal/day) | 1474.9 ± 295.8 | 1414.1 ± 259.7 | |||
| Total Fat§ (gr/day) | 66.3 ± 17.1 | 63.9 ± 15.5 | 0.081 | ||
| Total Fat (% of Energy) | 40.2 ± 5.0 | 40.5 ± 5.0 | 0.593 | ||
| Saturated Fat§ (gr/day) | 23.8 ± 7.2 | 22.7 ± 6.5 | 0.070 | ||
| Saturated Fat§ (% of Energy) | 14.5 ± 2.9 | 14.4 ± 2.9 | 0.948 | ||
| Carbohydrates§ (gr/day) | 167.6 ± 44.3 | 158.9 ± 39.2 | 0.014 | ||
| Carbohydrates§ (% of Energy) | 45.2 ± 6.4 | 44.8 ± 6.5 | 0.344 | ||
| Protein§ (gr/ day) | 60.5 ± 15.2 | 57.8 ± 13.7 | 0.028 | ||
| Protein§ (% of Energy) | 16.4 ± 2.5 | 16.3 ± 2.3 | 0.784 | ||
| Behavioral | Mean ± s.d | Mean ± s.d | |||
| TV watching (hrs/day)* | 2.31 ± 1.55 | 2.16 ± 1.45 | 0.167 | ||
| L-VPA (hrs/week)* | 1.10 ± 2.42 | 1.17 ± 2.13 | 0.092 | ||
†: The variable "Height" presented in the Table corresponds to recumbent length for children 1 to 2 years old and to standing height for children older than 2 years.
§: Parameter was log-transformed
*: The level of statistical significance was estimated with the non-parametric Mann-Whitney test
Mean values of certain behavioural and lifestyle characteristics of the study population are further presented in Table 3. Regarding nutrients intake no significant differences between genders were observed for the first age group. In all other age groups, although total and saturated fat, protein and carbohydrates intake were all higher in boys than girls (P < 0.05), there was no difference between genders in the percentage of energy derived from these macronutrients. Regarding time devoted to L-VPA and TV watching, the current analysis revealed no significant differences between genders as well as that most of the very young children examined didn't devote any time to L-VPA.
Discussion
In the current paper the study design, data collection procedures and some descriptive data of the GENESIS study are presented. Males in almost all age groups had higher mean values for weight, recumbent length and height, compared to their female counterparts. Furthermore, the mean values obtained for these anthropometrical indices by sex and age group were similar to those reported by national surveys from other developed countries [10,27], indicating similar growth patterns of preschoolers in the developed world. However, and in agreement with other national studies [7,12,14], no differences were detected between genders in BMI values for all age groups, indicating a parallel age-related rise of weight and height in both sexes at preschool years.
The current study is the first to report on the prevalence of overweight on a representative population sample of Greek preschoolers, revealing an increased prevalence of "at risk of overweight" (16.5% to 18.6% for boys and 18.5 to 20.6 % for girls) and "overweight" (14.0% to 18.9% for boys and from 12.6% to 20.0% for girls) (Table 3). The magnitude of these figures can be better assessed when compared with those obtained from a representative US population with similar age (11.0% and 9.9% of boys as well as 9.4% and 11% of girls were found to be at "risk for overweight" and "overweight" respectively) [28,29], indicating a much higher prevalence of "at risk of overweight" and "overweight" among Greek preschoolers. The alarming rate of these finding can be easily realized when considering that currently obesity among adults in the US and Greece are comparable [30], while an increasing rate of obesity among children and adolescents has been recorded in Greece over the last two decades [31,32]. Taking into account recent studies suggesting that childhood obesity in most cases tracks into adulthood [2,4,33,34], the current findings are indicating an increased risk for even higher rates of obesity in adolescence and adulthood in the near future exceeding those currently reported for the US and Greek adult populations.
Overweight and obesity is the outcome of a positive energy balance over a long period of time, i.e. higher energy intake versus lower energy expenditure. Although several recent studies conducted in the developed world have indicated that the increased prevalence of obesity among both children and adults is primarily due to reduced levels of physical activity [35-37] , little is known about preschool years [38]. In the current study both energy intake as well as time spent in physical activity were assessed in order to provide some information on those behavioural parameters related to the increased prevalence of obesity recorded among GENESIS subjects. Mean daily intake of energy and macronutrients was found to be increasing with age for both genders. No differences were observed in these variables between boys and girls at the first age group while from the second age group onwards there was a significantly higher intake for boys compared to girls. Due to the scarcity of relevant epidemiological data among preschool children and toddlers in Greece, no comparisons or conclusive remarks can be reached. Still in the study of Roma-Giannikou et al. [20] similar intakes of energy and macronutrients were reported, indicating that possibly no major changes have taken place in the past ten years. When comparing the current data with those obtained by the NHANES III study [39] for similar age groups, American preschoolers were found to have higher mean energy intake but at the same time lower mean fat and saturated fat intakes compared to the current population. Nevertheless, the percentage of energy derived from total and saturated fat in the GENESIS study (approximately 40.0% and 14.5%, respectively) considerably exceeded those reported for American preschoolers (32.8% and 13.0%, respectively) [39].
In addition to high-energy intake, low levels of physical activity is the other major factor contributing in the development of obesity in both adults and children [35,40]. Still this remains unproven for preschool years [36], probably due to the fact that physical activity may have smaller variations in children compared to adults, thus not providing the significant correlations observed in adults. The present study revealed that most of the children surveyed were not considerably active, since the time spent in L-VPA did not exceed the recommended levels of 30 minutes participation in organized sports and/or free play per day [41]. Furthermore time spent on sedentary activities, such as TV watching and playing video games showed an increasing tendency with age for both genders. These observations are comparable with those reported for preschool children in other developed countries [36], where high rates of childhood obesity co-exist.
The primary aim of the current paper was to present the study design and data collection procedures and also to provide some preliminary crude/ descriptive findings of the GENESIS study. The data presented have indicated an increasing tendency with age regarding the overall prevalence of at risk of overweight and overweight. Future but more extensive analyses of the GENESIS data will be able to provide more evidence on the behavioural parameters related to these increased rates. Most importantly however, a more thorough analysis of the available data will try to highlight the cultural, parental and socio-economic indices, leading to the unfavourable behavioural parameters related to this phenomenon. Expanding the knowledge and understanding of the interactivity of these parameters will assist Public Health Bodies in developing appropriate health and nutrition guidelines for Health Educators and Health Professionals but also provide guidance for the food industry, parents and guardians. This approach could lead to maximizing the efficiency of health promotion strategies, both towards the direction of preventing chronic disease but also achieving optimum growth and development for preschool children.
Pre-publication history
The pre-publication history for this paper can be accessed here:
Acknowledgments
Acknowledgements
The GENESIS study was supported with a Research Grant from Friesland-Foods Hellas. Special thanks go to Eva Grammatikaki, George Moschonis, Evdokia Oikonomou, Vivian Detopoulou, Anastasia Anastasiadou, Christine Kortsalioudaki, Elina Ioannou, Margarita Bartsota, Thodoris Liarigkovinos, Manolis Birbilis, Katerina Kondakis, Elina Dimitropoulou, Nikoleta Vidra, Theodoros Athanasoulis, Pari Christofidou, Lilia Charila, Sofia Tzitzirika and Christos Vassilopoulos for their valuable contribution to the completion of the study.
References
- Bellisle F. Effects of diet on behaviour and cognition in children. Br J Nutr. 2004;92 Suppl 2:S227–32. doi: 10.1079/BJN20041171. [DOI] [PubMed] [Google Scholar]
- Whitaker RC, Wright JA, Pepe MS, Seidel KD, Dietz WH. Predicting obesity in young adulthood from childhood and parental obesity. N Engl J Med. 1997;337:869–873. doi: 10.1056/NEJM199709253371301. [DOI] [PubMed] [Google Scholar]
- Godfrey KM, Barker DJ. Fetal nutrition and adult disease. Am J Clin Nutr. 2000;71:1344S–52S. doi: 10.1093/ajcn/71.5.1344s. [DOI] [PubMed] [Google Scholar]
- Wright CM, Parker L, Lamont D, Craft AW. Implications of childhood obesity for adult health: findings from thousand families cohort study. Bmj. 2001;323:1280–1284. doi: 10.1136/bmj.323.7324.1280. [DOI] [PMC free article] [PubMed] [Google Scholar]
- Martin RM, Holly JM, Smith GD, Ness AR, Emmett P, Rogers I, Gunnell D. Could associations between breastfeeding and insulin-like growth factors underlie associations of breastfeeding with adult chronic disease? The Avon Longitudinal Study of Parents and Children. Clin Endocrinol (Oxf) 2005;62:728–737. doi: 10.1111/j.1365-2265.2005.02287.x. [DOI] [PubMed] [Google Scholar]
- Patrick H, Nicklas TA. A review of family and social determinants of children's eating patterns and diet quality. J Am Coll Nutr. 2005;24:83–92. doi: 10.1080/07315724.2005.10719448. [DOI] [PubMed] [Google Scholar]
- Flegal KM, Ogden CL, Wei R, Kuczmarski RL, Johnson CL. Prevalence of overweight in US children: comparison of US growth charts from the Centers for Disease Control and Prevention with other reference values for body mass index. Am J Clin Nutr. 2001;73:1086–1093. doi: 10.1093/ajcn/73.6.1086. [DOI] [PubMed] [Google Scholar]
- Kranz S, Siega-Riz AM, Herring AH. Changes in diet quality of American preschoolers between 1977 and 1998. Am J Public Health. 2004;94:1525–1530. doi: 10.2105/ajph.94.9.1525. [DOI] [PMC free article] [PubMed] [Google Scholar]
- Ganji V, Betts N, Whitehead D. Nutrient intakes of 1-3, 4-6 and 7-10 year age group children: analysis of diet reported in 1987-88 Nationwide Food Consumption Survey. Nutr Res. 1995;15:623–631. doi: 10.1016/0271-5317(95)00030-M. [DOI] [Google Scholar]
- Haschke F, van't Hof MA. Euro-Growth references for length, weight, and body circumferences. Euro-Growth Study Group. J Pediatr Gastroenterol Nutr. 2000;31 Suppl 1:S14–38. doi: 10.1097/00005176-200007001-00003. [DOI] [PubMed] [Google Scholar]
- Serra-Majem L, Garcia-Closas R, Ribas L, Perez-Rodrigo C, Aranceta J. Food patterns of Spanish schoolchildren and adolescents: The enKid Study. Public Health Nutr. 2001;4:1433–1438. doi: 10.1079/PHN2001234. [DOI] [PubMed] [Google Scholar]
- Gregory JR, Collins DL, Davies PSW, Hughes J, Clarke P. National Diet and Nutrition Survey: Children aged 1.5 to 4.5 years. Vol. 1. Report of the Diet and Nutrition Survey. London: HMSO. 1995.
- Cacciari E, Milani S, Balsamo A, Dammacco F, De Luca F, Chiarelli F, Pasquino AM, Tonini G, Vanelli M. Italian cross-sectional growth charts for height, weight and BMI (6-20 y) Eur J Clin Nutr. 2002;56:171–180. doi: 10.1038/sj.ejcn.1601314. [DOI] [PubMed] [Google Scholar]
- Kalies H, Lenz J, von Kries R. Prevalence of overweight and obesity and trends in body mass index in German pre-school children, 1982-1997. Int J Obes Relat Metab Disord. 2002;26:1211–1217. doi: 10.1038/sj.ijo.0802013. [DOI] [PubMed] [Google Scholar]
- Andersen NL, Fagt S, Groth MV, Hartkopp HB, Moller A, Ovesen NL, Warming DL. Dietary intakes for the Danish population 1995. The National Food Agency of Denmark. 1996.
- Alexy U, Kersting M, Sichert-Hellert W, Manz F, Schoch G. Macronutrient intake of 3- to 36-month-old German infants and children: results of the DONALD Study. Dortmund Nutritional and Anthropometric Longitudinally Designed Study. Ann Nutr Metab. 1999;43:14–22. doi: 10.1159/000012762. [DOI] [PubMed] [Google Scholar]
- Celi F, Bini V, De Giorgi G, Molinari D, Faraoni F, Di Stefano G, Bacosi ML, Berioli MG, Contessa G, Falorni A. Epidemiology of overweight and obesity among school children and adolescents in three provinces of central Italy, 1993-2001: study of potential influencing variables. Eur J Clin Nutr. 2003;57:1045–1051. doi: 10.1038/sj.ejcn.1601640. [DOI] [PubMed] [Google Scholar]
- Herpertz-Dahlmann B, Geller F, Bohle C, Khalil C, Trost-Brinkhues G, Ziegler A, Hebebrand J. Secular trends in body mass index measurements in preschool children from the City of Aachen, Germany. Eur J Pediatr. 2003;162:104–109. doi: 10.1007/s00431-002-1056-z. [DOI] [PubMed] [Google Scholar]
- Sepp H, Lennernas M, Pettersson R, Abrahamsson L. Children's nutrient intake at preschool and at home. Acta Paediatr. 2001;90:483–491. doi: 10.1080/080352501750197593. [DOI] [PubMed] [Google Scholar]
- Roma-Giannikou E, Adamidis D, Gianniou M, Nikolara R, Matsaniotis N. Nutritional survey in Greek children: nutrient intake. Eur J Clin Nutr. 1997;51:273–285. doi: 10.1038/sj.ejcn.1600388. [DOI] [PubMed] [Google Scholar]
- University of Crete Food Composition Tables. nutrition.med.uoc.gr/GreekTables. 1991.
- Trichopoulou A. Composition tables of foods and Greek dishes. School of Medicine: Department of Hygiene and Epidemiology. Athens, Greece, ; 2004. [Google Scholar]
- National Research Council (U.S.). Coordinating Committee on Evaluation of Food Consumption Surveys. Subcommittee on Criteria for Dietary Evaluation. Nutrient adequacy : assessment using food consumption surveys. Washington, D.C., National Academy Press; 1986. p. xi, 146. [Google Scholar]
- Manios Y, Kafatos A, Markakis G. Physical activity in 6-year-old children: validation of two proxy reports. Pediatr Exerc Sci. 1998;10:176–188. [Google Scholar]
- Division of Public Health Surveillance and Informatics. Centers for Disease Control and Prevention (CDC) EpiInfo-Database and Statistics Software for Public Health Professionals. 2004.
- National Center for Health Statistics CDC growth charts: United States. 2000.
- McCarthy HD, Jarrett KV, Emmett PM, Rogers I. Trends in waist circumferences in young British children: a comparative study. Int J Obes Relat Metab Disord. 2005;29:157–162. doi: 10.1038/sj.ijo.0802849. [DOI] [PubMed] [Google Scholar]
- Ogden CL, Flegal KM, Carroll MD, Johnson CL. Prevalence and trends in overweight among US children and adolescents, 1999-2000. Jama. 2002;288:1728–1732. doi: 10.1001/jama.288.14.1728. [DOI] [PubMed] [Google Scholar]
- Jolliffe D. Extent of overweight among US children and adolescents from 1971 to 2000. Int J Obes Relat Metab Disord. 2004;28:4–9. doi: 10.1038/sj.ijo.0802421. [DOI] [PubMed] [Google Scholar]
- International Obesity Task Force Global prevalence of obesity. 2005.
- Krassas GE, Tzotzas T, Tsametis C, Konstantinidis T. Prevalence and trends in overweight and obesity among children and adolescents in Thessaloniki, Greece. J Pediatr Endocrinol Metab. 2001;14 Suppl 5:1319–26; discussion 1365. [PubMed] [Google Scholar]
- Magkos F, Manios Y, Christakis G, Kafatos AG. Secular trends in cardiovascular risk factors among school-aged boys from Crete, Greece, 1982-2002. Eur J Clin Nutr. 2005;59:1–7. doi: 10.1038/sj.ejcn.1602023. [DOI] [PubMed] [Google Scholar]
- Field AE, Cook NR, Gillman MW. Weight status in childhood as a predictor of becoming overweight or hypertensive in early adulthood. Obes Res. 2005;13:163–169. doi: 10.1038/oby.2005.21. [DOI] [PMC free article] [PubMed] [Google Scholar]
- Freedman DS, Khan LK, Serdula MK, Dietz WH, Srinivasan SR, Berenson GS. Inter-relationships among childhood BMI, childhood height, and adult obesity: the Bogalusa Heart Study. Int J Obes Relat Metab Disord. 2004;28:10–16. doi: 10.1038/sj.ijo.0802544. [DOI] [PubMed] [Google Scholar]
- Andersen RE, Crespo CJ, Bartlett SJ, Cheskin LJ, Pratt M. Relationship of physical activity and television watching with body weight and level of fatness among children: results from the Third National Health and Nutrition Examination Survey. Jama. 1998;279:938–942. doi: 10.1001/jama.279.12.938. [DOI] [PubMed] [Google Scholar]
- Slyper AH. The pediatric obesity epidemic: causes and controversies. J Clin Endocrinol Metab. 2004;89:2540–2547. doi: 10.1210/jc.2003-031449. [DOI] [PubMed] [Google Scholar]
- Trost SG, Kerr LM, Ward DS, Pate RR. Physical activity and determinants of physical activity in obese and non-obese children. Int J Obes Relat Metab Disord. 2001;25:822–829. doi: 10.1038/sj.ijo.0801621. [DOI] [PubMed] [Google Scholar]
- Trost SG, Sirard JR, Dowda M, Pfeiffer KA, Pate RR. Physical activity in overweight and nonoverweight preschool children. Int J Obes Relat Metab Disord. 2003;27:834–839. doi: 10.1038/sj.ijo.0802311. [DOI] [PubMed] [Google Scholar]
- Troiano RP, Briefel RR, Carroll MD, Bialostosky K. Energy and fat intakes of children and adolescents in the united states: data from the national health and nutrition examination surveys. Am J Clin Nutr. 2000;72:1343S–1353S. doi: 10.1093/ajcn/72.5.1343s. [DOI] [PubMed] [Google Scholar]
- Haslam DW, James WP. Obesity. Lancet. 2005;366:1197–1209. doi: 10.1016/S0140-6736(05)67483-1. [DOI] [PubMed] [Google Scholar]
- Washington RL, Bernhardt DT, Gomez J, Johnson MD, Martin TJ, Rowland TW, Small E, LeBlanc C, Krein C, Malina R, Young JC, Reed FE, Anderson S, Bolduc S, Bar-Or O, Newland H, Taras HL, Cimino DA, McGrath JW, Murray RD, Yankus WA, Young TL, Fleming M, Glendon M, Harrison-Jones L, Newberry JL, Pattishall E, Vernon M, Wolfe L, Li S. Organized sports for children and preadolescents. Pediatrics. 2001;107:1459–1462. doi: 10.1542/peds.107.6.1459. [DOI] [PubMed] [Google Scholar]