

Abstract
Purpose
Primary open-angle glaucoma (POAG) is a complex inherited disorder. It has been demonstrated in other complex disorders that phenotypic heterogeneity may be the result of genetic heterogeneity and that stratification analysis can be used to increase the power of detection. Ordered subset analysis (OSA) is a recently described method that utilizes the variability of phenotypic traits to determine underlying genetic heterogeneity.
Methods
Eighty-six multiplex families with POAG were clinically ascertained for genetic analysis. Age at diagnosis (AAD) was used as a surrogate for age of onset in affected family members. Nine genetic markers within the 15q11–13 interval on chromosome 15 were used for OSA analysis.
Results
An 11-cM linkage interval with a peak LOD score of 3.24 centered at the GABRB3 locus (P = 0.013 by permutation test) was identified in a subset of 15 families, which represents 17% of the total dataset (15/86 families). The mean AAD for the affected OSA families was 44.1 ± 9.1 years (SD). The mean AAD for the complementary group was 61.3 ± 10.4 years. African-American and white families were well represented in the OSA subset.
Conclusions
Linkage was identified for POAG to an 11-cM region on chromosome 15, designated GLC1I. This result provides further evidence that AAD and other phenotypic traits can be used as stratification variables to identify genes in complex disorders such as POAG and suggests that the 15q11–13 locus is one of the largest genetic contributors to POAG identified to date.
Primary open-angle glaucoma (POAG) is a complex inherited disorder. At least eight loci have been defined for POAG using family-based linkage studies and a small number of pedigrees (GLC1A-GLC1H) (Wirtz MK, et al. IOVS 1998;39: ARVO Abstract 512).1–3 Mutations in genes located in the GLC1A, GLC1E, and GLC1G loci have been identified in families with POAG. Mutations in MYOC (GLC1A) are associated with approximately 3% to 5% of adult-onset POAG and 10% to 20% of cases of the autosomal dominant juvenile-onset form of POAG.4 Mutations in OPTN (GLC1E) have been found in kindreds in which most family members have an autosomal dominant form of normal-tension glaucoma, a variant of POAG in which statistically elevated intraocular pressure (IOP) is not present.5 In a recent study, mutations in WDR36, a gene located on the long arm of chromosome 5 (GLC1G), have been reported to cause adult-onset POAG.6 Sequence variations of WDR36 were identified in approximately 5% of familial and sporadic cases of POAG. Additional regions of interest have emerged from genome-wide scans using nonparametric methods, completed for mainly white patients with POAG7 and African-Caribbean patients in Barbados.8 These studies have identified nine genomic regions that may harbor POAG-susceptibility genes. Two of these chromosomal regions, 14q11 and 15q11–13 have continued to show evidence of POAG-susceptibility loci after follow-up studies, using additional sibling pairs and additional makers in the regions of interest (Wiggs JL et al., manuscript in preparation).
One method used to address genetic heterogeneity and strengthen linkage findings is to incorporate phenotypic subsetting of the data. Most phenotypic stratification approaches require that subsets be identified before linkage studies. An alternative to traditional stratification approaches for incorporating a trait-related covariate is ordered subset analysis (OSA).9 This method provides maximum evidence of linkage, by using the covariate without a priori specification of families to a subset. With this approach, families are ordered by a phenotypic variable (e.g., age of onset, cup-to-disc ratio, or IOP). Linkage analysis with a specific genetic marker set is performed on the first family in the list and then repeated, adding one family each time. In this way, the subset of families with the greatest evidence of linkage can be determined. The goal of OSA is to identify regions of increased linkage in a subset of families. By increasing genetic homogeneity, OSA can also reduce the linkage interval. Subsets with evidence of increased linkage can be used for candidate gene analysis. This approach has been successfully used to confirm and narrow the area of proposed linkage, as well as to define novel regions of linkage in several complex traits, including diabetes,10 Alzheimer disease,11 autism,12 and macular degeneration.13
The age of onset of POAG is difficult to determine because of the absence of symptoms in the early stages of the disease; however, it is well known that the prevalence of POAG is low in persons younger than 50 years and increases dramatically after age 70.14–16 There is some evidence that the age at diagnosis (AAD) has a genetic contribution in POAG. For example, POAG associated with myocilin mutations is frequently diagnosed between 20 and 40 years of age,17 whereas that associated with optineurin mutations is diagnosed at an average of 44 years of age.5
In this report we discuss the use of OSA using age at diagnosis as a covariate in a large POAG multiplex family dataset to identify linkage to a locus on the long arm of chromosome 15, region 11–13, originally identified in a genome-wide scan.7
METHODS
Family Dataset
The original study dataset consisted of 86 multiplex families containing two or more affected members and represents the dataset described in our genomic screen of POAG.7 The myocilin and optineurin genes were sequenced in these families. Five families were excluded from further analysis with known disease-associated mutations in myocilin (Glu368STOP in three families, Thr377Met in one family, and Glu352Lys in one family). No families had mutations in optineurin. The remaining 81 multiplex families contained 370 genotyped individuals, 227 of whom were affected. The relative pair counts were 535 sib pairs and 259 avuncular pairs. Pair counts by affected status were 182 sib pairs and 32 avuncular pairs. Of the 81 families in the original dataset 69 were white, 10 were African-American, and 2 were Hispanic. Race and ethnicity were self-identified.
Clinical Ascertainment
Family members were ascertained through the Departments of Ophthalmology at the Duke University Medical Center, the Tufts New England Medical Center, and the Massachusetts Eye and Ear Infirmary.7 In cases in which family members were unable to come to one of the primary examination centers, clinical information was forwarded to study investigators (RRA, JLW) and used for ascertainment. Predominately, families identified were from the Southeast and New England.
Informed consent was obtained from all participating family members. This study adhered to the tenets of the Declaration of Helsinki and was reviewed and approved by the Institutional Review Boards of the Duke University Medical Center, the New England Medical Center, and the Massachusetts Eye and Ear Infirmary.
Clinic-based ascertainment was performed on all subjects. Examination included a review of ocular and medical history, visual acuity, applanation tonometry, gonioscopy, slit lamp examination, optic disc examination, fundus examination, and visual field assessment. Visual fields were scored with a modified six-stage system adapted from that published by Quigley et al.18: level 0, meets no criteria; level 1, three non–rim-contiguous points with reduction ≥5 dB or two contiguous points with reduction ≥10 dB; level 2, three non–rim-contiguous points ≥10 dB; level 3, three non–rim-contiguous points ≥10 dB, either above or below the horizontal meridian; level 4, three non–rim-contiguous points ≥10 dB, both above and below the meridian; and level 5, central island <20° or temporal island. All clinical data have been entered into the Duke University Center for Human Genetics Pedigene database for analysis.19
Ascertainment criteria were as follows: Probands had an age of onset of ≥35 years and met the following three criteria: (1) IOP ≥ 22 or ≥ 19 mm Hg, measured by applanation tonometry in both eyes on two glaucoma medications; (2) glaucomatous optic neuropathy in both eyes; and (3) visual field loss consistent with optic nerve damage in at least one eye. Affecteds (other than proband) had to exhibit two of the three ocular criteria, whereas glaucoma suspects either had IOP ≥ 22 mm Hg or optic nerve heads that appeared glaucomatous to the examiner. Visual field perimetry was performed on all family members with elevated IOP or optic nerves that were suspicious for glaucoma. Unaffected individuals had IOP in the normal range (<22 mm Hg) and normal-appearing optic nerves. The disease status of individuals with histories of ocular injury or secondary forms of glaucoma was designated unknown.
Age at diagnosis was defined as the date the initial diagnosis of glaucoma was made in the medical record or conveyed to the patient by his or her treating physician. If no information was available, AAD data were not recorded or used for analysis.
Genetic Markers and Genotyping Methodology
The 15q11-13 region had been identified as a candidate region for POAG in a previous genome-wide screen.7 Nine markers were genotyped in this region: D15S122, GABRB3, GABRA5, D15S822, D15S975, D15S219, D15S217, D15S1233, and D15S165. Genomic DNA was extracted from whole blood (Puregene; Gentra Systems, Minneapolis, MN). Microsatellite marker genotyping was performed by using the FASST method.20 Markers were selected on the basis of heterozygosity, location, and PCR performance and were PCR amplified from patient DNA, electrophoresed on 6% polyacrylamide slab gels, stained (Sybrgold; Molecular Probes, Eugene, OR), and scanned on a fluorescence laser scanner (FMBIO II; Hitachi, San Jose, CA). Gel images were downloaded to a networked computer system for image analysis and allele size determination on computer (BioImage, Ann Arbor, MI).
Ordered Subset Analysis
Mean family age at diagnosis was used as the covariate in this analysis. To take advantage of the extended pedigree structure, multipoint information LOD* scores were calculated with GeneHunter-Plus software.21 The OSA program was used to rank-order families by mean age at diagnosis.22
The OSA method was applied as follows:
Families were ranked by the mean specific covariate value for familial age at diagnosis in both ascending and descending order.
Family-specific LOD* scores using GeneHunter-Plus were added one by one by, according to the covariate rank order, until all families were included.
Once a family was added, a maximum LOD* score was determined and stored for that subset.
The “optimal-slice” option of OSA was used to determine the subset of any size of adjacent families in covariate distribution (not necessarily including the endpoints) that yielded the maximum LOD score. To adjust for the use of two independent ranking orders (ascending, descending), a nominal significance level of 0.025 (0.05/2) was used. As OSA results for the “optimal-slice” option correlate highly with those for ascending and descending rankings and are not used to determine whether a subset exists but to identify the best subset, no correction was made for the optimal-slice ranking. The optimal-slice subset with the highest LOD* score was identified as the overall OSA LOD score.
An empiric probability was calculated to assess the OSA LOD score by using a permutation test on the basis of randomizing the order of the families 5000 times, to determine the proportion of families that gave an LOD* score greater than the OSA LOD score. This permutation test examines the hypothesis that the covariate-defined subset yields a significantly different LOD score than in the randomly assigned family subset.
This procedure was used to examine mean AAD as a covariate, in both ascending and descending order. Other covariates tested were mean family IOP and minimum AAD within a family.
The values of five phenotypic measures (age at diagnosis, frequency of glaucoma-related blindness, degree of visual field loss, maximum recorded IOP, and the need for laser or surgical intervention) were compared between the OSA family subset and the remaining POAG families. Data were analyzed with statistical software (SAS System for Windows; SAS, Cary, NC). Statistical analysis using descriptive statistics, the t-test, and the χ2 test were used to compare the OSA groups and the clinical variables.
RESULTS
OSA analysis was performed on the overall dataset using mean family age of onset as the covariate. The peak OSA LOD score reached a maximum of 3.24 in a subset of 15 families, ascending or descending (Fig. 1) with a family-specific mean age at diagnosis of ≤45 years at the GABRB3 locus (located at 6.3 cM, P = 0.013 by permutation test). Examining the OSA subset of families reduced the minimum candidate interval (1 LOD-unit down method) from 24 cM to approximately 11 cM (Fig. 2).
Figure 1.
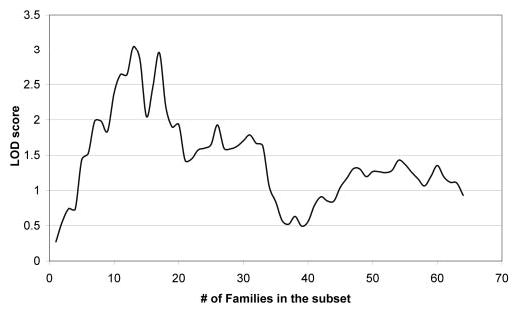
Identification of a genetically homogeneous subpopulation of POAG families within an 81-family dataset. Families are ranked by age at diagnosis, and added sequentially to the linkage analysis. The maximum LOD* score of 3.05 is obtained with a 15-family subset.
Figure 2.
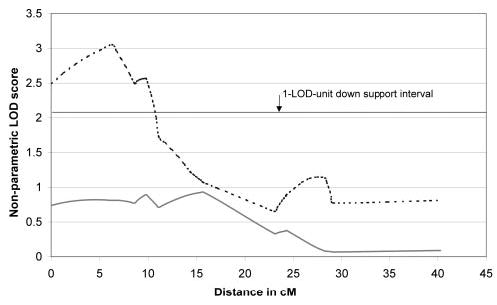
The 15q linkage peak in a subset of families with an early-onset form of POAG. Solid line: the linkage peak in all 81 multiplex families analyzed; broken line: the linkage peak in the 15-family OSA subset. The OSA linkage peak was centered at 6.3 cM, with a minimum candidate interval (1 LOD-unit down method) of approximately 11 cM.
The family-specific mean ages at diagnosis ranged from 39 to 49 years. The overall mean age of the OSA individuals across families was 44.1 ± 9.1 years (SD). The range of individual ages at diagnosis in this group was 33 to 64 years. The mean age at diagnosis for the complementary group of 70 families was 61.3 ± 10.4 years. The range of individual ages at diagnosis was 38 to 84 years. The OSA family dataset consisted of 11 white families with 35 affected individuals and 4 African-American families with 12 affected individuals. There were no Hispanic families in the OSA subset. Neither of the other two covariates tested by OSA (mean family IOP and minimum AAD within a family) identified genetically homogeneous subsets of patients. The values of five phenotypic measures (age at diagnosis, frequency of glaucoma-related blindness, degree of visual field loss, maximum recorded IOP, and the need for laser or surgical intervention) were compared between the OSA family subset and the remaining POAG families. Other than age at diagnosis (P < 0.001), no significant phenotypic differences were observed between the OSA early-onset and the complementary older-onset subsets.
The values of five phenotypic measures (age at diagnosis, frequency of glaucoma-related blindness, degree of visual field loss, maximum recorded IOP, and the need for laser or surgical intervention) were compared between the OSA family subset and the remaining POAG families. Other than age at diagnosis (P < 0.001), no significant phenotypic differences were observed between the OSA early-onset and the complementary older-onset subsets.
DISCUSSION
We have identified an 11-cM region for POAG with age-dependent evidence for linkage to a locus at 15q11–13. This locus has been designated GLC1G by the HUGO Genome Nomenclature Committee (gene.ucl.ac.uk/nomenclature; hosted by the University College London, London, UK). These data provide further evidence that AAD can be a useful stratification variable for identifying genes in complex disorders such as POAG. Reducing phenotypic heterogeneity through stratification can enhance identification of homogeneous genetic subpopulations, thereby enhancing the power to detect linkage. Using this approach we successfully established linkage to the 15q11–13 locus in a subset of families with an early-onset form of POAG. This early-onset OSA subset of families represents 17% of the total family dataset. The contribution of this locus in the older-onset POAG families is unknown. This result indicates that the 15q11–13 locus may represent one of the largest genetic contributions to POAG identified to date.
The mode of inheritance of this locus is not known with certainty and in fact is most likely complex (a combination of genes and environmental factors and their potential interactions) with several confounding factors including incomplete penetrance, variable expression, and the presence of pheno-copies (disease caused by other mechanisms) also contributing to the disease expression. For this reason, the precise boundaries of the linkage region cannot be determined through traditional haplotyping methods and the direct examination of recombination events. In fact, applying this approach to individual pedigrees can lead to an under- or overestimation of the size of the interval. The boundaries of the locus can best be described by the one-LOD unit down interval surrounding the peak marker of GABRB3 (bounded proximally by the centromere and distally by D15S822), or a two-LOD unit down interval bounded proximally by the centromere and distally by D15S975.
Hall et al.23 successfully used stratification by age of onset to identify an early-onset subset of families with breast cancer. The use of this method ultimately led to their identifying BRCA1 as a genetic source of breast cancer. Using OSA, a method that exploits variability of phenotype as a marker for underlying genetic heterogeneity, researchers have successfully identified linkage for many disorders, including diabetes,10 Alzheimer disease,11 autism,12 and macular degeneration.13
Since the early stages of POAG are asymptomatic, the actual age of onset cannot be known. Therefore, we used AAD as our variable for analysis. Even this surrogate measure of age of onset has its pitfalls. Elevation of IOP may precede optic nerve damage by years or, in some cases, decades. In cases in which individuals have moved periodically, medical records used for data collection may be incomplete. In addition, patients may not remember when the diagnosis was made. These factors can reduce the power to stratify families accurately. Despite these confounding factors, we were able to use this variable successfully to stratify our families with POAG.
It is interesting that despite an earlier AAD, other major phenotypic traits did not differ between affected members of the early-onset OSA families and the older-onset family dataset. Traits examined included maximum measured IOP, optic nerve damage, visual field loss, history of glaucoma surgery, and degree of vision loss. Therefore, it appears that the gene or genes on 15q primarily act on age of onset, not on clinical severity or other phenotypic traits. This is in contrast to the POAG phenotype found in individuals affected by mutations in myocilin, which is characterized by high IOP and an aggressive clinical course that often necessitates surgical intervention,17 or individuals with mutations in optineurin who frequently have a normal-tension variant of POAG.5
The 15q11–13 region contains gene loci for autism, Prader-Willi, and Angelman syndrome (MIM 176270) and is considered highly complex in genomic function and stability.24 There are several intriguing candidate genes in this region, including three receptors for GABAA: GABRβ3 GABRα5, and GABRγ3. A definitive feature of POAG is the death of retinal ganglion cells. Of interest, GABAA receptors are found in the human brain, and the GABRβ3 and GABRα5 receptors are expressed in the retina.25 Amyloid precursor binding protein (APBA2) is located within this region and is also expressed in the retina. As the name implies, APBA2 binds to amyloid precursor protein (APP), which is involved in the pathogenesis of Alzheimer disease. Tight junction protein (TJP1), also known as ZO-1, is a component of endothelial cell junctions in Schlemm’s canal within the trabecular meshwork, the primary site for the draining of aqueous humor from the eye. Exposure to glucocorticoids increases expression of TJP1 in cell culture and is believed to play a role in causing steroid-induced elevation of IOP.26 Analysis of these and other genes within this region is in progress.
Footnotes
Supported by National Eye Institute Grant R01 EY10086 (JLW), granted to Janey L. Wiggs, and R01 EY 015543 (RRA), the Glaucoma Research Foundation, Research to Prevent Blindness; the American Health Assistance Foundation; and the Barkhouser Glaucoma Research Fund.
Disclosure: R.R. Allingham, None; J.L. Wiggs, None; E.R. Hauser, None; K.R. Larocque-Abramson, None; C. Santiago-Turla, None; B. Broomer, None; E.A. Del Bono, None; F.L. Graham, None; J.L. Haines, None; M.A. Pericak-Vance, None; M.A. Hauser, None
References
- 1.Stoilova D, Child A, Trifan OC, et al. Localization of a locus (GLC1B) for adult-onset primary open angle glaucoma to the 2cen-q13 region. Genomics. 1996;36:142–150. doi: 10.1006/geno.1996.0434. [DOI] [PubMed] [Google Scholar]
- 2.Trifan OC, Traboulsi EI, Stoilova D, et al. The third locus (GLC1D) for adult-onset primary open-angle glaucoma maps to the 8q23 region. Am J Ophthalmol. 1998;126:17–28. doi: 10.1016/s0002-9394(98)00073-7. [DOI] [PubMed] [Google Scholar]
- 3.Samples JR, Kitsos G, Economou-Petersen E, et al. Refining the primary open-angle glaucoma GLC1C region on chromosome 3 by haplotype analysis. Clin Genet. 2004;65:40–44. doi: 10.1111/j..2004.00182.x. [DOI] [PubMed] [Google Scholar]
- 4.Stone EM, Fingert JH, Alward WLM, et al. Identification of a gene that causes primary open angle glaucoma. Science. 1997;275:668–670. doi: 10.1126/science.275.5300.668. [DOI] [PubMed] [Google Scholar]
- 5.Rezaie T, Child A, Hitchings R, et al. Adult-onset primary open-angle glaucoma caused by mutations in optineurin. Science. 2002;295:1077–1079. doi: 10.1126/science.1066901. [DOI] [PubMed] [Google Scholar]
- 6.Monemi S, Spaeth G, Dasilva A, et al. Identification of a Novel adult-onset primary open angle glaucoma (POAG) gene on 5q22.1. Hum Mol Genet. 2005;14:725–733. doi: 10.1093/hmg/ddi068. [DOI] [PubMed] [Google Scholar]
- 7.Wiggs JL, Allingham RR, Hossain A, et al. Genome-wide scan for adult onset primary open angle glaucoma. Hum Mol Genet. 2000;9:1109–1117. doi: 10.1093/hmg/9.7.1109. [DOI] [PubMed] [Google Scholar]
- 8.Nemesure B, Wu SY, Hennis A, Leske MC. Factors related to the 4-year risk of high intraocular pressure: the Barbados Eye Studies. Arch Ophthalmol. 2003;121:856–862. doi: 10.1001/archopht.121.6.856. [DOI] [PubMed] [Google Scholar]
- 9.Hauser ER, Watanabe RM, Duren WL, et al. Ordered subset analysis in genetic linkage mapping of complex traits. Genet Epidemiol. 2004;27:53–63. doi: 10.1002/gepi.20000. [DOI] [PubMed] [Google Scholar]
- 10.Ghosh S, Watanabe RM, Valle TT, et al. The Finland-United States investigation of non-insulin-dependent diabetes mellitus genetics (FUSION) study. I. An autosomal genome scan for genes that predispose to type 2 diabetes. Am J Hum Genet. 2000;67:1174–1185. [PMC free article] [PubMed] [Google Scholar]
- 11.Scott WK, Hauser ER, Schmechel DE, et al. Ordered-subsets linkage analysis detects novel Alzheimer disease loci on chromosomes 2q34 and 15q22. Am J Hum Genet. 2003;73:1041–1051. doi: 10.1086/379083. [DOI] [PMC free article] [PubMed] [Google Scholar]
- 12.Shao Y, Cuccaro ML, Hauser ER, et al. Fine mapping of autistic disorder to chromosome 15q11–q13 by use of phenotypic subtypes. Am J Hum Genet. 2003;72:539–548. doi: 10.1086/367846. [DOI] [PMC free article] [PubMed] [Google Scholar]
- 13.Schmidt S, Scott WK, Postel EA, et al. Ordered subset linkage analysis supports a susceptibility locus for age-related macular degeneration on chromosome 16p12. BMC Genet. 2004;5:18. doi: 10.1186/1471-2156-5-18. [DOI] [PMC free article] [PubMed] [Google Scholar]
- 14.Tielsch JM, Sommer A, Katz J, et al. Racial variation in the prevalence of primary open-angle glaucoma: The Baltimore Eye Survey. JAMA. 1991;266:369–374. [PubMed] [Google Scholar]
- 15.Klein BE, Klein R, Sponsel WE, et al. Prevalence of glaucoma. The Beaver Dam Eye Study. Ophthalmology. 1992;99:1499–1504. doi: 10.1016/s0161-6420(92)31774-9. [DOI] [PubMed] [Google Scholar]
- 16.Leske MC, Connell AM, Schachat AP, Hyman L. The Barbados Eye Study: prevalence of open angle glaucoma. Arch Ophthalmol. 1994;112:821–829. doi: 10.1001/archopht.1994.01090180121046. [DOI] [PubMed] [Google Scholar]
- 17.Alward WL, Fingert JH, Coote MA, et al. Clinical features associated with mutations in the chromosome 1 open-angle glaucoma gene (GLC1A) N Engl J Med. 1998;338:1022–1027. doi: 10.1056/NEJM199804093381503. [DOI] [PubMed] [Google Scholar]
- 18.Quigley HA, Tielsch JM, Katz J, Sommer A. Rate of progression in open-angle glaucoma estimated from cross-sectional prevalence of visual field damage. Am J Ophthalmol. 1996;122:355–363. doi: 10.1016/s0002-9394(14)72062-8. [DOI] [PubMed] [Google Scholar]
- 19.Haynes C, Speer MC, Peedin M, et al. PEDIGENE: A comprehensive data management system to facilitate efficient and rapid disease gene mapping. Am J Hum Genet. 1995;57:A193. [Google Scholar]
- 20.Vance JM, Ben Othmane K. Methods of genotyping. In: Haines JL, Pericak-Vance MA, eds. Approaches to Gene Mapping in Complex Human Diseases. New York: Wiley-Liss, 1998:213–228.
- 21.Kong A, Cox NJ. Allele-sharing models: LOD scores and accurate linkage tests. Am J Hum Genet. 1997;61:1179–1188. doi: 10.1086/301592. [DOI] [PMC free article] [PubMed] [Google Scholar]
- 22.Hauser ER, Watanabe RM, Duren WL, Boehnke M The Fusion Study Group. Stratified linkage analysis of complex genetic traits using related covariates (abstract) Am J Hum Genet. 1998;63:A45. [Google Scholar]
- 23.Hall JM, Lee MK, Newman B, et al. Linkage of early-onset familial breast cancer to chromosome 17q21. Science. 1990;250:1684–1689. doi: 10.1126/science.2270482. [DOI] [PubMed] [Google Scholar]
- 24.Nicholls RD, Knepper JL. Genome organization, function, and imprinting in Prader-Willi and Angelman syndromes. Annu Rev Genomics Hum Genet. 2001;2:153–175. doi: 10.1146/annurev.genom.2.1.153. [DOI] [PubMed] [Google Scholar]
- 25.Sharon D, Blackshaw S, Cepko CL, Dryja TP. Profile of the genes expressed in the human peripheral retina, macula, and retinal pigment epithelium determined through serial analysis of gene expression. Proc Natl Acad Sci USA. 2002;99:315–320. doi: 10.1073/pnas.012582799. [DOI] [PMC free article] [PubMed] [Google Scholar]
- 26.Underwood JL, Murphy CG, Chen J, et al. Glucocorticoids regulate transendothelial fluid flow resistance and formation of intercellular junctions. Am J Physiol. 1999;277:C330–C342. doi: 10.1152/ajpcell.1999.277.2.C330. [DOI] [PubMed] [Google Scholar]