Abstract
The ecosystem characteristics of soil microorganism and the nutrient uptake of irrigated rice were investigated in a split-block experiment with different fertilization treatments, including control (no fertilizer application), PK, NK, NP, NPK fertilization, in the main block, and conventional rice and hybrid rice comparison, in the sub block. Average data of five treatments in five years indicated that the indigenous N supply (INS) capacity ranged from 32.72 to 93.21 kg/ha; that indigenous P supply (IPS) capacity ranged from 7.42 to 32.25 kg/ha; and that indigenous K supply (IKS) capacity ranged from 16.24 to 140.51 kg/ha, which showed that soil available nutrient pool depletion might occur very fast and that P, K deficiency has become a constraint to increasing yields of consecutive crops grown without fertilizer application. It was found that soil nutrient deficiency and unbalanced fertilization to rice crop had negative effect on the diversity of the microbial community and total microbial biomass in the soil. The long-term fertilizer experiment (LTFE) also showed that balanced application of N, P and K promoted microbial biomass growth and improvement of community composition. Unbalanced fertilization reduced microbial N and increased C/N ratio of the microbial biomass. Compared with inbred rice, hybrid rice behavior is characterized by physiological advantage in nutrient uptake and lower internal K use efficiency.
Keywords: Rice, Nutrient uptake, Fertilization, Soil microorganism, Diversity
INTRODUCTION
China is one of the main countries producing rice (Oryza sativa L.) in the world. The demand for rice continues to increase owing to continued growth of population. It is predicted that a 50% to 60% increase in rice production will be required to meet demand from population growth by 2025. Rice yield increases are likely to occur through fine-tuning of crop management. Nitrogen supply commonly limits grain yield in irrigated rice systems. The demand of the rice plant for other macronutrients mainly depends on the N supply (Dobermann et al., 1998). On the other hand, the average plant recovery of fertilizer N is only about 30% (Dobermann, 2000), although much knowledge has been gained about the nitrogen cycle in lowland rice environments. Environmental pollution by nutrient leaching or runoff from rice fields has become another concern (Ahmad et al., 1996; Zhang et al., 1988). Application of other macronutrients such as potassium has lagged behind, leading to imbalanced plant nutrition and negative potassium input-output balances in many parts of Asia (Dobermann et al., 1998)
Due to negative nutrient balances, significant depletion of soil nutrients such as K or P seems to occur in irrigated rice areas of tropical Asia (Dobermann et al., 1996). However, most current knowledge about nutrient balances and soil fertility status in irrigated rice systems is based on data from a few long-term experiments. There are considerable uncertainties about crop N, P and K requirements because the internal efficiencies vary greatly depending on variety, nutrient supply, crop management and climatic conditions. Several investigators suggested that genetic variation in internal efficiency of P and K may exist in rice (Fageria et al., 1988), but systematic studies are few.
Soil microorganisms are an important part of the soil. Recognition of the importance of soil microorganisms has led to increased interest in measuring the nutrients held in their biomass (Jenkinson and Powlson, 1976). Soil microbial biomass is considered to act both as the agent of biochemical changes in soil and as a repository of plant nutrients such as nitrogen (N) and phosphorus (P) in agricultural ecosystems (Jenkinson and Ladd, 1981). In paddy fields, in which N fertility had been sustained over a long period of time, about 60%–70% of N absorbed by rice plants was derived from native soil N rather than fertilizer N. A few studies revealed that microbial biomass was an important source of mineralizable soil organic N in paddy soils (Jenkinson and Ladd, 1981; Marumoto, 1984). The composition of the microbial community, in particular the proportion of bacteria and fungi, may also influence C and N turnover of soil, although the microbial characteristics of paddy soils have been little investigated.
This research focused attention on crop nutrient requirements, assessment of soil nutrient supplying capacity, and characteristics of soil microorganisms in a long-term fertilization experiment based on nutrient balance concepts. Furthermore, the relationships between the microbial biomass and chemical properties of the soil, such as available N, P and K contents were investigated. The investigation aimed at analyzing the effects of fertility on soil microbial biomass and soil nutrient supplying capacity, and at considering implications for the long-term management of paddy soil fertility.
MATERIALS AND METHODS
Description of the long-term fertilization experiment
The experimental field located near the suburb of Jinhua City, Zhejiang Province. Soil at the study site is alluvial soil. The experiment was conducted on late rice (LR) of 1998 to early rice (ER) of 2003. Before the experiment, initial soil samples were collected in the spring of 1998 to determine general soil properties at 0.0 to 0.15 m depth (Table 1). The experiment was arranged as a split-block with three replicates in all treatments, including control (CK, no fertilizer application), PK (only P and K were applied), NK (only N and K were applied), NP (only N and P were applied) and NPK (N, P, and K were applied) fertilization, in the main block, and inbred rice and hybrid rice comparison in the sub block. ER and LR of inbred rice were Jia293 and Xiushui11, respectively. ER and LR of hybrid rice were Weiyou402 and Xieyou46, respectively. Plot size was 45 m2. Nitrogen was applied as urea at before transplanting (75 kg N/ha), early tillering (37.5 kg N/ha) and panicle initiation (37.5 kg N/ha). Phosphorus (25 kg P/ha) as single super phosphate was applied before transplanting. Potassium was applied as KCl before transplanting (50 kg K/ha) and at panicle initiation (50 kg K/ha).
Table 1.
Physical-chemical properties of testing soil
| pH (H2O:soil=1:1) | 4.8 |
| Total N (%) | 0.27 |
| Olsen’s-P (mg/kg) | 16.5 |
| Available-K (mg/kg) | 54.6 |
| Sand (g/kg) | 278 |
| Silt (g/kg) | 562 |
| Clay (g/kg) | 160 |
Plant sampling procedures followed a standard procedure in all treatments (Witt et al., 1999). A 12-tiller plant sample was collected at physiological maturity to determine nutrient concentrations in plant tissue. Grain yields were obtained from a central 5-m2. Nitrogen concentrations in grain and straw were measured by micro-kjeldahl digestion, distillation, and titration (Bremmer and Mulvaney, 1982). Tissue P was measured by the molybdenum-blue colorimetric method and tissue-K by atomic adsorption spectrophotometry after wet digestion (Walinga et al., 1995).
Soil microbial biomass determination
After the late rice of 2002 was harvested, samples were collected from all treated soils. The moist field soils were first dried partly to pass through a 2 mm mesh sieve, then adjusted to about 60% of full water holding capacity, and conditioned for 7–10 d at 25 °C.
Soil microbial biomass was measured using the fumigation extraction method (Brookes et al., 1985). Fifteen grams moist soil were extracted immediately after sampling by shaking for 30 min with 60 ml of 0.5 mol/L K2SO4 and 15 g were fumigated for 24 h with ethanol-free chloroform and then extracted as described above. Microbial biomass C (MBC) was determined using a Shimadzu TOC-5000 analyzer and soil microbial biomass nitrogen (MBN) was determined by kjeldahl digestion (Brookes et al., 1985). MBC was estimated as MBC=EC/0.45 (Wu and Joergensen, 1990), where EC (extractable carbon) is the difference between carbon extracted from fumigated and un-fumigated sample, MBN was estimated as MBN=EN/0.54 (Brookes et al., 1985), where EN (extractable nitrogen) is the difference between N extracted from fumigated and un-fumigated samples.
Soil microbial communities determination
Patterns of potential C source utilization by microbial communities of paddy soil with different fertilization treatments can be readily generated from direct incubation of environmental samples in BIOLOG micro-plates (Zak, 1994). The BIOLOG Gram-negative (GN) micro-plates used in this study rely on redox dye tetrazolium violet to detect respiration of sole carbon sources. The 96-well GN micro-plate consisted of 95 substrate-containing wells and a control well without a carbon source. Fifteen grams of soil sample (prepared as described above) were diluted to a 10−4 solution, and inoculated with a multipipettor into the plates kept at room temperature (25 °C). Color formation in micro-plate wells (absorbance at 405 nm) was analyzed using a Biotek EL 320 micro-plate reader with automated stracker-loader cassette.
Overall color development in BIOLOG plates was expressed as average well color development (AWCD). AWCD was derived from the mean difference among gray scale values of the 95 response wells (containing sole carbon source), R, and the gray scale value of the control well without a carbon source), C: [∑(C−R)]/95. We used two forms of ordination-principal component analysis (PCA), and canonical variate analysis (CVA), to visualize the relationships among samples by Genstat 5.3 (NAG Ltd., Oxford, UK) (Yao et al., 2000).
RESULTS
Yields and indigenous nutrient supply
Nutrient uptake of rice influences yields directly. To get more knowledge about nutrient uptake in rice, we studied yields for 5 consecutive years of planted rice with different fertilization treatments. There were marked differences only between applied-N treatments and no applied-N treatments during the first season (1998LR), and no significant difference between other treatments could be detected (at the 0.05 P-level). The grain yield was 4043 kg/ha in the PK treatment, compared to 3647 kg/ha in the CK treatment, which indicated that fertilizer P and K began to show efficiency from the fifth season (2000LR). Compared with NPK, yields of NP and NK began to decrease significantly from the third season (1999LR) and the eighth season (2002ER), respectively. The higher grain yield in the NPK treatment compared with NP seemed to result from differences in K caused by fertilizer application (Table 2).
Table 2.
Grain yield comparison between different treatments in an LTFE at Jinhua (kg/ha)
| Grain yield | 98L | 99E | 99L | 00E | 00L | 01E | 01L | 02E | 02L | 03E | ||||||||||
| CK | 5373 | b | 3230 | b | 3349 | b | 4266 | b | 3647 | c | 3670 | d | 3313 | c | 2790 | c | 3759 | c | 3204 | c |
| PK | 5696 | b | 3569 | b | 3599 | b | 4535 | b | 4013 | b | 4091 | c | 4075 | b | 3163 | c | 3991 | bc | 3273 | c |
| NK | 6736 | a | 4887 | a | 4407 | a | 6152 | a | 6046 | a | 5740 | a | 5578 | a | 4477 | b | 5391 | a | 4502 | b |
| NP | 6495 | a | 4758 | a | 2828 | c | 5938 | a | 4272 | b | 4602 | b | 4392 | b | 4310 | b | 4201 | b | 4115 | b |
| NPK | 6654 | a | 5107 | a | 4328 | a | 6074 | a | 5564 | a | 5107 | a | 5538 | a | 4922 | a | 5090 | a | 5168 | a |
In a column, grain yield means followed by the same letters (a, b or c) are not significantly different by DMRT (Duncan’s multiple range test) at 5% level. E means early rice, L means late rice
Soil indigenous nutrients supply was estimated in nutrient omission plots (PK, NK, NP) (Jacssen et al., 1990). Average data of five treatments in five years indicated that the indigenous N supply (INS) capacity ranged from 32.72 to 93.21 kg/ha, indigenous P supply (IPS) capacity ranged from 7.42 to 32.25 kg/ha, indigenous K supply (IKS) capacity ranged from 16.24 to 140.51 kg/ha. Table 3 shows that INS, IPS and IKS had decreasing trend with advancing season of planting rice. The PK plot providing higher N compared to no fertilizer plot indicated that soil N pool depletion might occur faster in crops grown consecutively when P and K nutrients were in abundance. Similarly, the NK plot depleted more P and the NP plot depleted more K compared the no fertilizer plot. Tables 2 and 3 indicate that P and K deficiency had become a constraint to increasing yield of consecutively planted rice.
Table 3.
Nutrient uptake of rice in fertilizer nutrient omission plots in LTFE at Jinhua (n=6) (kg/ha)
| Season | N uptake |
P uptake |
K uptake |
|||||||||
| No fertilizer | SD | Applied PK | SD | No fertilizer | SD | Applied NK | SD | No fertilizer | SD | Applied NP | SD | |
| 1998L | 59.8 | 9.76 | 71.4 | 18.3 | 18.1 | 2.7 | 27.8 | 3.5 | 82.7 | 21.7 | 101.2 | 11.6 |
| 1999E | 32.1 | 5.93 | 36.6 | 4.0 | 9.3 | 1.4 | 15.5 | 1.5 | 74.3 | 9.5 | 100.6 | 19.4 |
| 1999L | 47.6 | 7.46 | 46.5 | 6.8 | 9.6 | 1.5 | 15.8 | 2.4 | 59.5 | 23.9 | 36.5 | 14.7 |
| 2000E | 34.1 | 7.6 | 36.7 | 5.2 | 10.1 | 1.6 | 15.3 | 2.5 | 80.7 | 8.6 | 84.8 | 9.6 |
| 2000L | 32.3 | 5.1 | 33.9 | 2.2 | 8.8 | 2.3 | 14.2 | 1.3 | 45.4 | 11.9 | 39.2 | 7.3 |
| 2001E | 35.9 | 4.2 | 39.5 | 3.6 | 8.4 | 0.8 | 8.9 | 0.8 | 52.9 | 4.7 | 56.0 | 11.3 |
| 2001L | 39.8 | 7.3 | 44.7 | 8.5 | 11.2 | 3.0 | 18.5 | 3.8 | 50.8 | 17.9 | 54.8 | 42.5 |
| 2002E | 44.2 | 5.6 | 44.5 | 6.0 | 9.7 | 1.5 | 14.3 | 2.8 | 54.8 | 7.5 | 69.9 | 16.8 |
| 2002L | 43.6 | 3.1 | 42.5 | 4.3 | 12.2 | 1.2 | 17.4 | 3.6 | 49.1 | 6.3 | 47.0 | 36.6 |
| 2003E | 33.0 | 6.5 | 33.3 | 3.6 | 10.9 | 2.7 | 13.8 | 3.2 | 61.1 | 12.0 | 65.8 | 8.1 |
| Total | 402.4 | 62.6 | 429.6 | 62.5 | 108.3 | 18.7 | 161.5 | 25.4 | 611.3 | 124 | 655.8 | 177.9 |
Internal N, P and K use efficiencies
Hybrid rice has a physiological advantage in nutrient uptake in contrast to the inbred rice. In late rice, average total N uptake of hybrid rice increased by 7.9%, total P uptake increased by 20.7%, and total K uptake increased by 23.9%, compared with inbred rice (Table 4). The results indicated that genetic variation in the internal efficiency of N, P and K might exist in different rice cultivars. Treatments with N had physiology advantage in N uptake compared to without N treatments, and also improved P and K uptake, especially P uptake.
Table 4.
Comparison of total nutrient uptake of inbred and hybrid rice under different fertilizer treatments in an LTFE at Jinhua (kg/ha)
| Nutrient uptake | Variety | Treatment |
|||||
| CK | PK | NK | NP | NPK | |||
| Early rice | NUK* | Inbred | 51.02a | 50.17 | 96.90 | 94.44 | 95.93 |
| Hybrid | 45.91b | 52.06 | 88.71 | 86.97 | 91.61 | ||
| PUK | Inbred | 12.46 | 11.90 | 18.71 | 17.60 | 21.42 | |
| Hybrid | 11.57 | 13.94 | 16.79 | 18.70 | 21.41 | ||
| KUK | Inbred | 64.42 | 78.85 | 125.12 | 77.11 | 129.20 | |
| Hybrid | 64.28 | 84.72 | 122.38 | 73.77 | 124.75 | ||
| Late rice | NUK | Inbred | 43.69b | 47.75 | 101.56 | 87.14 | 95.28b |
| Hybrid | 50.11a | 52.86 | 105.11 | 88.05 | 108.96a | ||
| PUK | Inbred | 11.78 | 15.02 | 19.17 | 17.50a | 19.36 | |
| Hybrid | 13.32 | 15.53 | 20.60 | 30.57b | 22.87 | ||
| KUK | Inbred | 46.03b | 63.32b | 105.51 | 46.46b | 97.84b | |
| Hybrid | 69.95a | 85.32a | 113.08 | 65.04a | 125.41a | ||
In a column, UK means followed by the different letters (a, b) are significantly different by DMRT at 5% level.
UK means nutrient uptake
Definitions of nutrient use efficiency vary greatly (Gourley et al., 1993). We restrict our discussion to aggregate physiological efficiency, or internal nutrient use efficiency (PE), defined as the amount of grain yield produced per kilogram of nutrient present in above ground plant biomass. Table 5 shows physiological nutrient use efficiency of inbred and hybrid rice under different fertilizer treatments in the LTFE. PE estimation covers a wide period range of fertilization treatments and rice cultivars. The PE in the five years period ranged from 42 to 94 kg grain/kg N, from 128 to 457 kg grain/kg P, and from 66 to 109 kg grain/kg K, respectively. The PEK of inbred rice was significantly greater than that of hybrid rice. The PE of late rice being generally greater than that of early rice may be related to physiological differences between cultivars and the season of soil nutrient supply.
Table 5.
Comparison of internal nutrient use efficiency of inbred and hybrid rice under different fertilizer treatments in an LTFE at Jinhua (kg/kg)
| Internal nutrient use efficiency | Variety | Treatment |
|||||
| CK | PK | NK | NP | NPK | |||
| Early rice | PEN | Inbred | 70.13 | 73.10 | 55.83 | 50.54b | 56.76 |
| Hybrid | 72.09 | 73.23 | 56.21 | 54.10a | 56.20 | ||
| PEP | Inbred | 296.05 | 324.83a | 295.71 | 278.27 | 266.15 | |
| Hybrid | 296.47 | 280.99b | 300.37 | 256.57 | 250.93 | ||
| PEK | Inbred | 56.37a | 46.55 | 43.36a | 65.11 | 42.85 | |
| Hybrid | 52.01b | 45.16 | 40.34b | 66.66 | 41.58 | ||
| Late rice | PEN | Inbred | 78.48b | 85.42 | 55.11 | 48.67b | 54.96 |
| Hybrid | 85.01a | 87.16 | 54.98 | 51.91a | 52.13 | ||
| PEP | Inbred | 300.13b | 270.56b | 295.41 | 246.27 | 273.86 | |
| Hybrid | 325.61a | 306.20a | 292.93 | 249.86 | 261.43 | ||
| PEK | Inbred | 76.63a | 64.63a | 52.88a | 101.05a | 53.97a | |
| Hybrid | 64.69b | 54.57b | 50.78b | 91.13b | 45.36b | ||
In a column, PE means followed by the different letters (a, b) are significantly different by DMRT at 5% level
Results of microbial biomass analysis
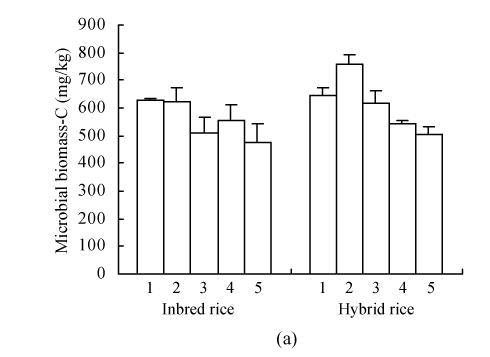
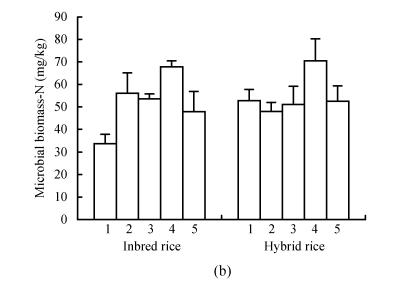
The levels of soil microbial biomass carbon and nitrogen in the different treatments are shown in Fig.1. Microbial biomass C and N varied from 480 to 760 mg C/kg soil and 23.7 to 73.3 mg N/kg soil. DMRT showed that the microbial carbon and nitrogen for different treatment were significantly different at 5% level. Soil microbial C was maximum in the NP or PK treatments, with CK treatment being second. The soil microbial biomass N showed a marked increase in the NPK treatment as compared to values in the unbalanced nutrient treatments (NP, PK and NK). CK treatment could also support a higher level of soil microbial biomass N. The amount of biomass carbon in hybrid rice was significantly higher than that in inbred rice. In contrast, the values of biomass N did not show appreciable difference among rice cultivars.
Fig. 1.
Soil microbial biomass Carbon (a) and Nitrogen (b) in different treatment. 1-PK, 2-NP, 3-CK, 4-NPK, 5-NK
The differences between the changes in MBN and MBC values affected the C to N ratio (range 7.6–18.4). The C to N ratio in NK and NPK treatment (7.6–8.99) were markedly lower than that in other treatments (Table 6). After four crops, the NP plot showed potassium deficiency; the PK plot showed nitrogen deficiency at the very beginning while the NK plot did not show phosphorus deficiency after 4 years of cropping. From these results, it was assumed that the C to N ratio was lower when N, P and K was sufficient; but that when nitrogen and potassium stressed the microbial population, the C to N ratio increased, especially, for hybrid rice, which required more K (Table 6). This may indicate that soil indigenous nutrient supply and nutrient balance can influence the soil microbial biomass C/N ratio, which may be used as an index of soil fertility.
Table 6.
C/N ratios of microbial biomass under different fertilization treatment
| Treatments | C/N ratio |
|
| Inbred rice | Hybrid rice | |
| NPK | 8.20c | 7.60c |
| NK | 8.99bc | 8.73c |
| CK | 9.96bc | 11.95b |
| NP | 11.06b | 15.83a |
| PK | 18.44a | 12.12b |
Results of microbial communities assessment using the BIOLOG GN plate
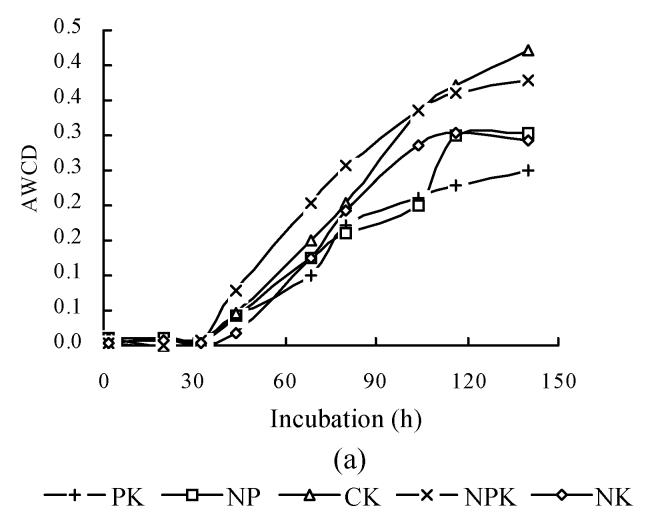
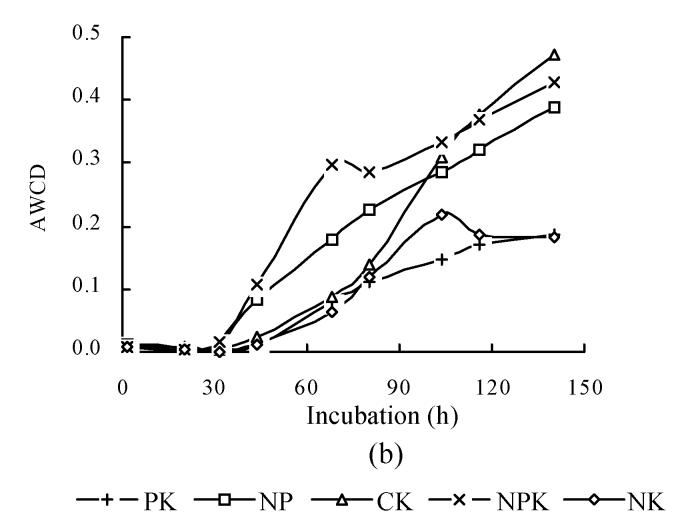
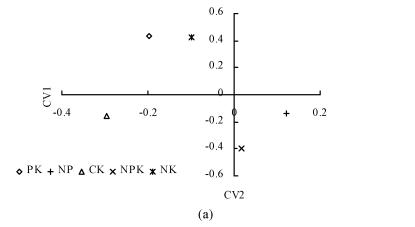
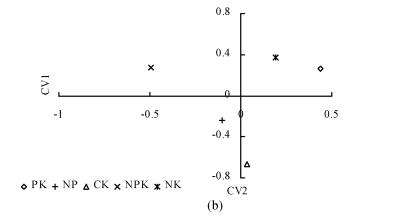
The relationship between AWCD and incubation time are shown in Fig.2. In the first 32 h of incubation, AWCD changed very little but afterwards increased continuously. This suggested that C sources were not used in the first 30 h of incubation. At the same time, AWCD of NPK treatment was the highest in all treatments. AWCD of CK treatment increased gradually and was higher than that of NP, PK and NK treatments at the late stage of incubation. Soil available nutrient pool depletion might occur very fast under consecutive crops grown without fertilization and result in the decrease in grain yield (Table 2). It was shown here that deficiency of the necessary nutrients for plants also adversely influences microbial communities. To further analyze the microbial communities, BIOLOG data after 158 h were subjected to canonical variate analysis (CVA) (Fig.3). In inbred rice, PK and NK treatments had similar values for CV1, which explained 55.69% of the variance in the data, and all treatments had different coordinate values for CV2, which explained 31.07% of the variance in the data (Fig.3a). In hybrid rice, CV1 explained 52.20% of the variance in the data, and CV2 explained 30.45% of variance in the data (Fig.3b). These results suggested that the structure of microbial community changed under different fertilization treatments. Treatment with balanced nutrients (NPK) had significantly increased soil biological activity, and promoted the enlargement of the microbial number utilizing different carbon resources.
Fig. 2.
Color development with incubation time. The plot of AWCD represents the mean color response for all 95 response wells. (a) Inbred rice; (b) Hybrid rice
Fig. 3.
Plot of CV1 and CV2 generated by canonical variate analysis of sole carbon source tests after 158 h in BIOLOG GN2 plates showing discrimination between different treatments. (a) Inbred rice; (b) Hybrid rice
DISCUSSION
In this long-term continuous cropping experiment, there is enormous year to year and season to season variation in grain yield and nutrient uptake in treatment plots. Average rice yields of NPK treatment were about 5.4 t/ha in our study, but they must be raised to 8.0 t/ha by 2020 to meet the demand for rice in Asia (Hossain and Fischer, 1995). Nitrogen is the most limiting nutrient in irrigated rice systems (De Datta et al., 1988), but P and K deficiency will also be a constraint to increasing yield for consecutive planting of rice. The goal of responsive nutrient management is congruence of nutrient supply and demand. Congruent nutrient management requires prediction of the effective indigenous nutrient supply and crop nutrient uptake requirements to determine fertilizer application according to timing and space. Tolerance of genotypes to slight differences in soil fertility or nonhomogeneous fertilizer application may be an important adaptive trait to account for within field variation in soil fertility or rice growth (Dobermann, 1994). Whether there is significant variation among rice genotypes, e.g. hybrid and inbred, in their plasticity to smooth out small scale spatial variation in nutrient supply needs further investigation in the field.
The soil microbial biomass is a labile pool organic matter and comprises 1%–3% of total soil organic matter (Jenkinson and Ladd, 1981). The soil microbial biomass acts as a source and sink of plant nutrient and regulates the functioning of the soil system. Microbial population in the soil-floodwater-rice system is perhaps one of the most complex biological systems in agriculture. Marumoto et al.(1982) found that the quantities of nutrients of mobilized in two German upland soils were closely related to amounts available in freshly killed biomass; and they showed a scheme for the transformation of dead microbial biomass C and N in arable soil during 4 weeks. We concluded that fertilization influenced microbial biomass and community diversity. How can soil biology be managed to increase nutrient use efficiency and sustain soil quality? Progress towards this goal will require a better understanding of soil ecology and functional biodiversity.
Footnotes
Project supported by the International Fertilizer Industry Association (IFIA), the Potash and Phosphate Institute, Canada (PPIC), and International Potash Institute (IPI)
References
- 1.Ahmad AR, Zulkefli M, Ahmed M, Schoff BF. Environmental impact of agricultural inorganic pollution on groundwater resources of the Kelantan Plain, Malaysia; ACIAR Proceedings; 1996. pp. 8–21. [Google Scholar]
- 2.Bremmer JM, Mulvaney CS. Nitrogen-total. In: Page AL, Miller RH, Keeney DR, editors. Methods of Soil Analysis. Part 2. Madison, WI: SSSA; 1982. pp. 595–623. (SSSA Book Ser. 5). [Google Scholar]
- 3.Brookes PC, Andrea L, Pruden G, Jenkinson DS. Chloroform fumigation and release of soil nitrogen: A rapid direct extraction method to measure microbial nitrogen in soil. Soil Biol. Biochem. 1985;12(6):837–842. [Google Scholar]
- 4.De Datta SK, Comez KA, Descalsota J. Changes in yield response to major nutrients and in soil fertility under intensive rice cropping. Soil Sci. 1988;146:350–358. [Google Scholar]
- 5.Dobermann A. Factors causing field variation of direct-seeded flooded rice. Geoderma. 1994;62:125–150. [Google Scholar]
- 6.Dobermann A. Future Intensification of Irrigated Rice Systems. In: Sheehy JE, Mitchell PE, Hardy B, editors. Redesigning Rice Photosynthesis to Increase Yield. Makati City, Philipines/Amsterdam: International Rice Research Institute/Elsevier; 2000. pp. 229–247. [Google Scholar]
- 7.Dobermann A, Sta.Cruz PC, Cassman KG. Fertilizer inputs, nutrients balance, and soil nutrient-supplying power in intensive, irrigated rice systems, I. Potassium uptake and K balance. Nutr. Cycling Agroecosyst. 1996;46:1–10. [Google Scholar]
- 8.Dobermann A, Cassman KG, Mamaril CP, Sheehy SE. Management of phoshorus, potassium, and sulfur in intensive, irrigated lowland rice. Field Crops Res. 1998;56:113–358. [Google Scholar]
- 9.Fageria NK, Wright RJ, Baligar VC. Rice cultivar evaluation for phosphorus use efficiency. Plant Soil. 1988;111:105–109. [Google Scholar]
- 10.Gourley CJP, Allan DL, Russele MP. Defining Phosphorus Efficiency in Plants. In: Barrow NJ, editor. Plant Nutrition–from Genetic Engineering to Field Practice. Dordrecht: Kluwer Academic Publishers; 1993. pp. 363–366. [Google Scholar]
- 11.Hossain M, Fischer KS. Rice research for food security and sustainable agricultural development in Asia: achievements and future challenges. Geo. Journal. 1995;35:286–298. [Google Scholar]
- 12.Jacssen BH, Guiking FCT, Van der Eijk D. A system for quantitative evaluation of the fertility of tropical soils (QUEFTS) Geoderma. 1990;46:299–318. [Google Scholar]
- 13.Jenkinson DS, Powlson DS. The effect of biocidal treatments on metabolism in soil, V: A method for measuring soil biomass. Soil Biol. Biochem. 1976;8:209–213. [Google Scholar]
- 14.Jenkinson DS, Ladd JN. Microbial Biomass in Soil: Measurement and Turnover. In: Paul EA, Ladd JN, editors. Soil Biochemistry. Vol. 5. New York: Marcel Dekker; 1981. pp. 455–471. [Google Scholar]
- 15.Marumoto T. Mineralization of C and N from microbial biomass in paddy soil. Plant and Soil. 1984;76:165–173. [Google Scholar]
- 16.Marumoto T, Anderson JPE, Domsch KH. Mineralization of nutrients from soil microbial biomass. Soil Biol. Biochem. 1982;14:469–475. [Google Scholar]
- 17.Walinga I, Vander L, Houba VJG. Plant Analysis Manual. Dordrecht, The Netherlands: Kluwer Academic Publ.; 1995. [Google Scholar]
- 18.Witt C, Dobermann A, Abdulrachman S. Internal nutrient efficiencies of irrigated lowland rice in tropical and subtropical Asia. Field Crops Res. 1999;63:113–138. [Google Scholar]
- 19.Wu J, Joergensen RG. Measurement of soil microbial biomass C–an automatic procedure. Soil Biol. Biochem. 1990;22:1167–1169. [Google Scholar]
- 20.Yao HY, He ZL, Wilson MJ, Campbell CD. Microbial community structure in a sequence of soil with increasing fertility and changing and use. Microbial Ecology. 2000;40:223–237. doi: 10.1007/s002480000053. [DOI] [PubMed] [Google Scholar]
- 21.Zak JC. Functional diversity of microbial communities: a quantitative approach. Soil Biol. Biochem. 1994;26:1101–1108. [Google Scholar]
- 22.Zhang SL, Zhu Z, Xu Y, Chen R, Li A. On the optimal rate of application of nitrogen fertilization for rice and wheat in Tai-lake region. Soils. 1988;20:5–9. (in Chinese) [Google Scholar]


