Abstract
A rice pse(t) (premature senescence, tentatively) mutant line, was isolated from 4 500 independent T-DNA inserted transgenic lines. The symptoms of premature senescence appeared more severely than those of the control plants (Zhonghua 11, japonica) at the last development stage. To characterize the mutant and provide basic information on the candidate genes by mapping to a physical region of 220-kb, experiments were carried out in two phytotrons under controlled temperature of 24 °C and 28 °C, respectively. The content of chlorophyll, soluble protein and MDA (malondialdehyde), net photosynthesis, the antioxidant enzyme activities of SOD (superoxide dismuase) (EC 1.15.1.1) and POD (peroxidase) (EC 1.11.1.7) and the peptidase activities of leaves were measured from top to bottom according to the leaf positions at the flowering stage. Compared with the control plant, the mutant showed the following characteristics: (1) Higher net photosynthesis rate (P n) appeared in the 1st and 2nd leaves, contents of chlorophyll and soluble protein were also higher in the 1st leaf; (2) The activities of SOD, POD and peptidase were higher according to the leaf position from top to bottom; (3) The symptom of premature senescence was accelerated in the mutant at 28 °C treatment. The MDA content and the SOD and POD activities between the 24 °C and 28 °C treatment mutants were not significantly different. Content of chlorophyll and soluble protein of leaves mutant decreased rapidly at 28 °C treatment. The results show that pse(t) is sensitive to high temperature. The probable function of PSE(T) is discussed.
Keywords: Antioxidative enzymes, Net photosynthesis rate, Peptidase, Phytotron, Premature senescence mutant, Rice (Oryza sativa L.)
INTRODUCTION
Leaf senescence is a kind of programmed cell death (PCD) in plants that is highly controlled by a genetically programmed process involving degradation of cellular structures, decline of photosynthesis massive generation of active oxygen species (AOS) and mobilization of nutrients (Nam, 1997; Lim et al., 2003). Many environmental factors have been shown to play a role in causing the photosynthetic decline to lead to premature senescence. Leaves exposed to ultraviolet radiation (UV-B), Cd stress, water or nitrogen deficency, high temperature and pathogen infection result in a loss of chlorophyll, which induce early leaf senescence in plants (Matile et al., 1999; Lewis et al., 2002; Wu et al., 2003).
Temperature and other environmental conditions affect leaf senescence and crop yield. Maize leaves are extremely sensitive to chilling injury, which usually result in premature leaf senescence when the leaves are exposed to temperatures below 10 °C (Foyer et al., 2002). Premature senescence occurs in rice, which shows that grain yield and nutrition decreased. In China, hybrid rice made great contributions to food production (Normile, 1999). However, leaf and root of some indica hybrids and indica-japonica hybrid combinations usually senesce more rapidly at the late developmental stage compared with japonica hybrid combinations, which severely affected the yield and caused poor grain-filling (Duan et al., 1997; Lu et al., 1988; Yang et al., 2002). Li et al.(2002) reported that some hybrid rice, such as Shanyou63 easily became prematurely senescent because excessive solar energy led to accumulation of AOS that causes membrane-lipid peroxidation and MDA (malondialdehyde) accumulation in flag leaf at the late developmental stage under natural conditions. Premature senescence, however, varied in different hybrid combinations. Studies also showed that leaf senescence was enhanced and grain yield started to decline at a daily mean temperature over 29 °C, and that grain quality declined linearly with higher temperature (Misr and Meena, 1986; Izumi et al., 2004). However, the mechanism still remains largely unknown.
Artificially induced mutants are good experimental materials due to the uniform genetic background compared with the original wild type and have been widely used for developmental and physiological studies in plants (Jiang and Rodermel, 1995; Jing et al., 2002; Takahashi et al., 2003). Some physiological metabolic mechanisms were elucidated with leaf senescence mutants. For example, pheophorbide, an oxygenase (PaO), that mediated the chlorophyll breakdown pathway in leaf senescence had been implicated by the maize lls1 mutant (Pruzinska et al., 2003; Yang et al., 2004). With the use of cdr1 and cdr2 mutants, phosphorylation steps were proved to lead to the NADPH oxidase activation associated with oxidative burst in leaf senescence (Takahashi et al., 2003). The interactions of abscisic acid and sugar signalling in the regulation of leaf senescence were studied with the use of ‘abi’ and ‘aba’ mutants (Pourtau et al., 2004). Studies of senescence-associated mutants will help us to understand the molecular and genetic mechanisms in crops at the late developmental stage.
This paper reports the physiological characteristics of the pse(t) mutant isolated from a large T-DNA inserted transgenic population of rice. Previous studies indicated that the phenotype was controlled by a single recessive gene and that the pse(t) was mapped to the 220 kb region on the long arm of chromosome 7 (Li et al., 2005). In order to understand the physiological characteristics of this premature senescence mutant, we identified several physiological parameters according to the leaf positions from top to bottom at the flowering stage in the phytotrons under mean 24 °C and 28 °C treatments, respectively. It was found that a higher P n appeared in the 1st and 2nd leaves of the mutant. The activities of SOD (superoxide dismutase), POD (peroxidase) and peptidase increased sharply in the 3rd and 4th leaves in the mutant, compared with control plants. The presumable candidate genes were discussed on the basis of physiological data analysis and mapping information.
MATERIALS AND METHODS
Screening the pse(t) mutant
A T-DNA inserted transgenic population containing 4500 individuals (Oryza sativa L. subsp. japonica cv Zhonghua 11) was constructed (Zhu et al., 2001; Sun et al., 2003). Regenerated plants (T0 generation) were transplanted to green house for three weeks, followed by transplanting to the field in the China National Rice Research Institute. The T0 transgenic plants were self-pollinated and the seeds were harvested individually. Phenotypic traits were recorded at the T1 generation in the fields.
Growth conditions in the phytotrons
pse(t) plants of the forth generation (T4) were used for the physiological test. Thirty 15-day-old seedlings of mutants and the control (Zhonghua 11) respectively, were transplanted from the nursery field to the phytotron (DL-S-135W, Koito, Japan) at 24 °C. Half of the mutants and control plants were then transplanted to another phytotron at 28 °C (Table 1) after 37 d. The photoperiod in both phytotrons was 12.5/11.5 h (day/night). The relative humidity was controlled at 75%. The light was solar. All the plants were raised by conventional methods and seeds were harvested individually.
Table 1.
Temperature setting in the phytotrons
| Time | Mean temperature (°C) |
|
| 24 °C treatment | 28 °C treatment | |
| 22:00~3:00 | 20 | 25 |
| 3:00~7:00 | 23 | 27 |
| 7:00~11:00 | 26 | 29 |
| 11:00~14:00 | 28 | 33 |
| 14:00~18:00 | 26 | 29 |
| 18:00~22:00 | 23 | 27 |
Definition of leaves and leaf positions
First, second, third and fourth leaf refer the order of the leaves and leaf positions from top to bottom at the flowering stage in rice. The 1st leaf is the flag leaf.
Measurements of photosynthesis, gas-exchange
P n was measured at the flowering stage when the premature senescence symptom just appeared on the 4th leaf of the mutant in the phytotron under controlled temperature at 24 °C. Gas exchange was determined with a portable photosynthesis system (LiCor-6400; LiCor Inc. Lincoln, Nebraska, USA) and a LED (light-emitting diode) light source, 6400-02. Data was collected on fully expanded leaves according to the leaf positions in the morning from 8:00 to 11:00 on a sun shining day in the phytotrons.
After the P n were measured, the top four leaves were numbered and collected individually for the next experiments.
Determination of chlorophyll content
The total content of chlorophyll was determined by the method described in Hill et al.(1985).
Crude protein extraction, enzyme assays and lipid peroxidation measurement
About 1.0 g of liquid-nitrogen-powered samples was homogenized with 5 ml cold 50 mmol/L potassium phosphate buffer (pH 7.0) containing 1 mmol/L EDTA and 5% (w/V) PVP (polyvinylpyrrolidone). The slurry was centrifuged at 20000×g for 20 min at 4 °C (L8-55M Ultracentrifuge, Beckman, USA) and the supernatants were used for enzyme assays and MDA measurement. The soluble protein concentration in the samples was estimated according to Bradford (1976).
Total SOD (superoxide dismutase: EC 1.15.1.1) activity was assayed by the method described in Giannopolitis and Ries (1977).
Total POD (peroxidase: EC 1.11.1.7) activity was assayed by the method in Xu and Ye (1989). The H2O2-dependent pyrogallol oxidation was determined by an increase in A 430 (absorbance at 430 nm).
TBA (thiobarbituic acid) test was used to measure lipid peroxidation in the leaves. The content of MDA was taken as an end product of lipid peroxidation (Madhava and Sresty, 2000).
Peptidase activity
Peptidase activities were measured according to the method described in Chen (1999).
Statistical analysis
All determinations were performed in at least three independent experiments. Statistical differences between control plants, mutants and leaf positions were analyzed by analysis of variance (ANOVA) using the SPSS package (Chicago, II., USA). Differences were considered significant when P<0.05 (probability level). SD was calculated and shown in the figures and tables.
RESULTS
Agronomic traits of the premature senescence mutant
Approximately 4500 independent T-DNA inserted transgenic lines were obtained in our laboratory up to 2002 (Zhu et al., 2001; Sun et al., 2003). Thirteen plants with premature senescence character out of 47 ones in T1 generations were screened from the line T2432 in the field. The leaves of the mutant began senescence at the tillering stage in summer. The leaf senescence became from bottom to top with the plant growth. Although there was no difference in plant height between the mutant and the wild type, the mutant’s seed-setting rate was only about 15% and its 1 000-grain weight was about 12 g.
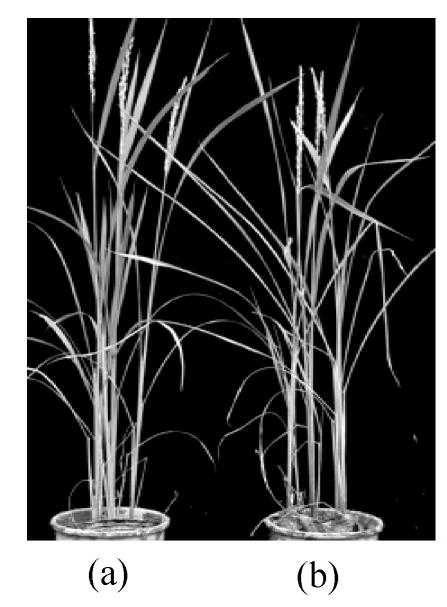
There was no morphological difference at the seedling stage between the mutant and the control plants under the controlled temperature conditions. Premature senescence obviously occurred on the bottom leaves of the mutant plants at the flowering stage (Fig.1a and Fig.1b). Yellow mini spots appeared on the 4th leaf of the mutant plants 14 d after transplanting into the 28 °C-phytotron (Fig.1c and Fig.1d). At the milking stage, the 4th leaf became fully senescent while it remained green in control plants even in the 28 °C treatment (Fig.1e and Fig.1f). The mutant eventually achieved 56.2% seed-setting rate and 20.1 g per 1 000-grain weight of 28 °C treatment (Table 2), which in the 24 °C treatment, reduced by 22% and 3 g compared with the control at the 24 °C treatment. While there were no remarkable differences in control plants under these two temperature treatments. The results obtained were significant different from those in the fields where the seed-setting rate was 15% and 1 000-grain weight was 12 g for pse(t) mutant. The difference could have resulted from the fact that natural temperature over 35 °C in a day continued for several hours. These indicated that the seed-setting rate and 1 000-grain weight of the mutant reduced with rising temperature.
Fig. 1.


Phenotypes of the premature senescence mutant and control plant in the phytotrons
control (a) and pse(t) (b) at the flowering stage under the 28 °C treatment; Morphology of the 4th leaf in control (c) and mutant (d) when the symptom of premature senescence appeared in the mutant; The 4th leaf in control (e) and pse(t) (f) grew at the milking stage under the 28 °C treatment
Table 2.
The seed-setting rate and 1000-grain weight of pse(t) in the 24 °C and 28 °C treatments
| 24 °C treatment |
28 °C treatment |
|||
| Mutant | Control | Mutant | Control | |
| Seed-setting rate (%) | 72.3±5.3 b | 93.2±3.1 c | 56.2±5.0 a | 95.1±2.1 c |
| 1 000-grain weight (g) | 23.1±0.3 b | 23.6±0.4 bc | 20.1±0.4 a | 24.4±0.4 c |
| DTS (d) | 16 | 35 | 14 | 31 |
Values are the mean±SE of four replicates. In each row, means marked with the same letter are not significantly (P<0.05) different by the Duncan Test. DTS: Days from 28 °C treatment to the beginning of the 4th leaf senescence
Effect of temperature on the photosynthesis in leaves
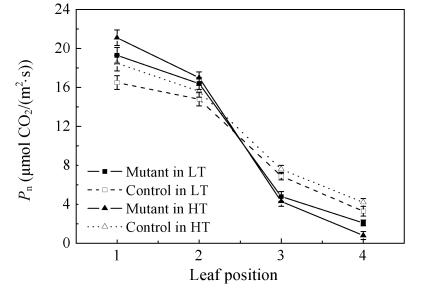
P n decline is a significant character of leaf senescence in plants. Fig.2 shows that P n reduced from the flag leaf to the bottom leaf position in both the mutant and control. P n in mutants decreased more rapidly than that in the control. As a result, P n in the mutant’s 1st and 2nd leaves was higher than that ofthe control even though the P n in the 3rd and 4th leaves was much lower than the control’s. For example, the mutant’s 1st and 2nd P n was 17.0% and 10.8% higher than that of the control under 24 °C treatment, but was only 69.5% and 63.6% in the 3rd and 4th leaves of the corresponding controls, respectively (Fig.2). Moreover, P n of the mutant in the 28 °C treatment decreased more sharply than that in the 24 °C treatment.
Fig. 2.
The relationship between P n and leaf position in the pse(t) mutant and the control. The leaf position was counted from top to the bottom of the plant. The measured leaves were fully expanded at the flowering stage
LT: Phytotron under controlled condition at 24 °C (low temperature phytotron); HT: Phytotron under controlled condition at 28 °C (high temperature phytotron)
There are two main factors causing P n decrease. The first is the stomatal factor that depends on the number of stomatal pores, stomatal location and dimensions (Quick et al., 1992). The other is the non-stomatal factor that primarily depends on the activity of intrinsic enzymes, the photosynthetic apparatus and their regulation mechanism (Lal et al., 1996). To further explore the reasons for the P n reduction in the mutant, the characteristics of g s (stomatal conductance) and C i (the intercellular CO2 concentration) were analyzed. Higher g s and E (transpiration rates) values were observed in the 1st and 2nd leaves of the mutant compared with those of the corresponding control (Table 3), but g s and E values in the mutant’s 3rd and 4th leaves were not significantly different compared with those of the corresponding control. The leaf C i on the same position in both phytotrons did not show any difference between the mutant and the control plant. These results indicated that the higher P n in the mutant’s 1st and 2nd leaves was not caused by stomatal factors.
Table 3.
Photosynthesis related parameters of the top four leaves positions in the pse(t) mutant and the control at the flowering stage at the 24 °C and 28 °C treatments
| Photosynthesis paremeter | Temperature treatment (°C) | Line | Leaf position |
|||
| 1 | 2 | 3 | 4 | |||
| E (mmol/(m2·s)) | 24 | Mutant | 4.12±0.24 a | 3.16±0.17 b | 1.23±0.21 d | 1.19±0.14 d |
| Control | 3.50±0.16 b | 2.93±0.18 b | 1.98±0.13 c | 1.48±0.27 d | ||
| 28 | Mutant | 6.70±0.23 a | 5.60±0.14 b | 2.41±0.18 c | 1.38±0.16 d | |
| Control | 5.54±0.18 b | 5.35±0.08 b | 2.67±0.18 c | 1.41±0.17 d | ||
| gs (mmol/(m2·s)) | 24 | Mutant | 0.74±0.03 a | 0.57±0.06 b | 0.44±0.03 c | 0.43±0.01 c |
| Control | 0.57±0.04 b | 0.53±0.03 b | 0.45±0.03 c | 0.50±0.04 c | ||
| 28 | Mutant | 0.96±0.02 a | 0.61±0.06 c | 0.45±0.04 d | 0.47±0.03 d | |
| Control | 0.74±0.05 b | 0.58±0.07 c | 0.47±0.04 d | 0.46±0.05 d | ||
| Ci (μmol CO2/mol) | 24 | Mutant | 270±8 a | 276±6 a | 293±5 b | 327±5 c |
| Control | 272±4 a | 279±7 a | 293±7 b | 327±4 c | ||
| 28 | Mutant | 266±4 a | 305±5 b | 339±4 c | 357±6 d | |
| Control | 266±6 a | 305±5 b | 339±4 c | 357±6 d | ||
Values are the mean±SE of four replicates. In each temperature treatment, means marked with the same letter are not significantly different (P<0.05) by Duncan Test. The leaf position was counted from top to bottom of plant. The measured leaves were fully expanded
Effect of temperature on chlorophyll and protein content of leaves
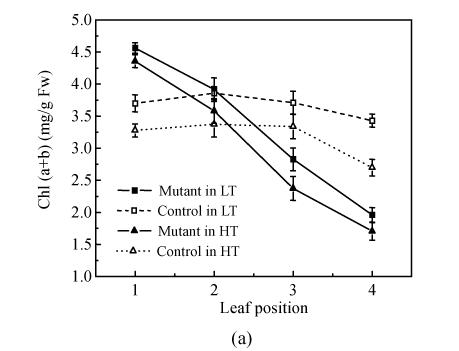
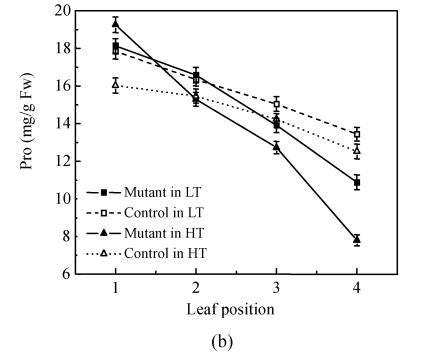
Synchronous alteration trends of contents of total Chl (chlorophyll) and soluble protein together with the P n decline were observed along the leaf position from top to bottom of the mutant, which indicated that with leaf age and descent position, the mutant’s rate of leaf senescence in pse(t) was faster than that of the control (Fig.2 and Fig.3a). The content of total Chl and soluble protein was about 25% and 20%, respectively, higher in the 1st leaf of the mutant compared with the control in the same phytotron, while there was no difference in the 2nd leaf. The soluble protein content decreased slowly as the leaf positions lowered in the control (Fig.3b). This trend in the 28 °C treatment was sharper than that in the 24 °C treatment. With leaf age and descent of leaf position, the mutant’s rate of leaf senescence was faster than that of the control. This indicated that the mutant’s senescence accelerated, especially under high temperature conditions.
Fig. 3.
Total Chl (a) and protein (Pro) content (b) of the leaves at the top four positions in the pse(t) mutant and control at the flowering stage in the 24 °C and 28 °C treatments. The leaf position was counted from top to bottom of the plants (a) Total Chl content; (b) Protein content. Values are the mean±SE of four replicates
Effect of temperature on SOD and POD activities
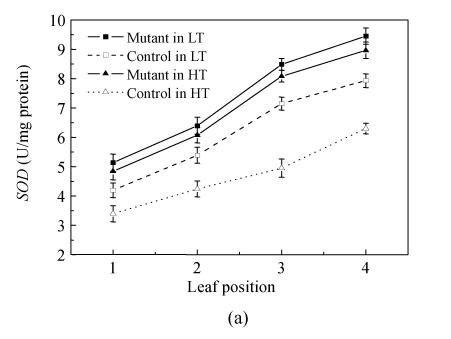
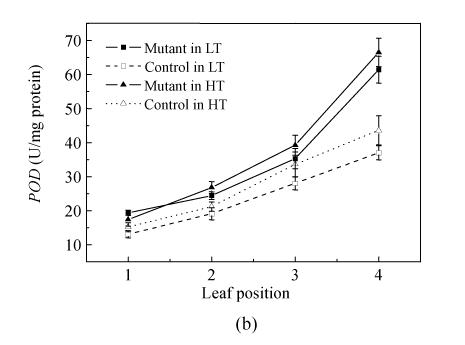
An important change associated with senescence was the enhancement of activities of antioxidative enzymes, such as SOD, POD and CAT (catalase) (Foyer et al., 2002). In order to study senescence-associated variations in AOS metabolism in the mutant and control plant, SOD and POD activities in the upper four leaves in all the plants were analyzed.
The results indicated that SOD and POD activities increased with the descent of the leaf positions in all treated plants and these activities of the mutant were stably higher than those of the control (Fig.4a and Fig.4b). The SOD activity increased by 23.2% and 25.2% in the mutant’s flag leaf in pse(t) compared with the corresponding controls in the 24 °C and 28 °C treatments, respectively. SOD activity reached its highest value (9.449 U/mg protein) in the 4th leaf of the mutant at 24 °C treatment and was 19.1% higher than the control. There was no significant difference in mutant’s SOD activities between the same leaf position in the 24 °C and 28 °C treatments, respectively. The mutant’s POD variation trend activity is as the same as the SOD activity. In general, the result showed that the rising trend of SOD and POD activities in mutant maintained a higher level than the controls in the same temperature treatments. The activities of SOD and POD were no significantly different in the same leaf position of the mutant in the 24 °C and 28 °C treatments.
Fig. 4.
Changes in SOD (a) and POD (b) activities of leaves at different leaf positions in mutant and control at the flowering stage in the 24 °C and 28 °C treatments. Data are means±SE of three replicates. The leaf position was counted from top to bottom of plants
Effect of temperature on lipid peroxidation
Plant cells, either directly or indirectly, form AOS during leaf senescence. Protonation of O2 − produces the hydroperoxyl radical (OH−, H2O2), which can convert fatty acids to toxic lipid peroxides, destroying biological membranes. The lipid peroxidation level in leaves of mutant and control plants measured by the content of MDA is listed in Table 4. Between the mutant and control in the same phytotrons, MDA content did not show significant difference in the 1st and 2nd leaves, but in the mutant’s 3rd and 4th leaves was significantly higher than those of the control in the same treatments. MDA content increased by 22.8% in the 3rd leaf and 48.4% in the 4th leaf compared with the corresponding control at 24 °C treatment. The same trend was observed to the mutant in the 28 °C treatment, it was 29.1% higher in the 3rd leaf and 91.0% higher in the 4th leaf, moreover, the upgrade trend in the mutant in the 28 °C treatment was higher than that in the 24 °C treatment, which indicated that the mutant’s lipid peroxidation level in the 28 °C treatment was higher than that in the 24 °C treatment. The result also suggested that lipid membrane was more severely destroyed in the mutant under high temperature treatment.
Table 4.
MDA content (mmol/g Fw) of leaves at the top four positions during the flowering stage under the 24 °C and 28 °C treatments
| Temperature treatment (°C) | Line | Leaf position |
|||
| 1 | 2 | 3 | 4 | ||
| 24 | Mutant | 47.28±4.34 a | 57.32±6.36 b | 86.13±6.30 c | 136.34±7.74 d |
| Control | 50.73±4.31 a | 62.31±4.05 b | 70.64±5.51 b | 91.39±6.31 c | |
| 28 | Mutant | 33.50±3.68 a | 47.35±4.09 b | 71.09±5.04 c | 128.64±5.65 d |
| Control | 35.44±4.13 a | 49.75±3.12 b | 55.34±4.55 b | 67.07±4.64 c | |
Values are the mean±SE of four replicates. In each temperature treatment, means marked with the same letter are not significantly-different (P<0.05) by the Duncan Test. The leaf position was counted from top to bottom of plants
Effect of temperature on peptidase activity
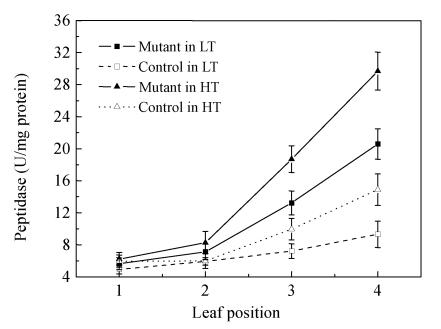
Nitrogen remobilization is a significant metabolic change involved in the leaf senescence during the mature stage in crops. Peptidase activity was analyzed with crude extract at the flowering stage in the 24 °C and 28 °C treatments (Fig.5). The result showed that peptidase activities increased with the leaf age both in mutant and control plants. Although there was no remarkable difference of peptidase activity between the 1st and 2nd leaves in all plants, the peptidase activity in the 3rd and 4th leaf increased more sharply in the mutant than in the corresponding control. The mutant’s peptidase activities in the 4th leaf reached their highest level of 29.90 U/mg protein in the 28 °C treatment and 20.59 U/mg protein in the 24 °C treatment, respectively. The mutant’s peptidase activity increased by 24% in the 3rd leaf in the 28 °C treatment compared with that of in the 24 °C treatment, and by 36% in the 4th leaf. These data suggested that the aged leaf early promoted nitrogen remobilization in the mutant.
Fig. 5.
The peptidase activity of different leaves at the upper four positions during the flowering stage. Data are means±SE of three replicates. The leaf position was counted from top to bottom of plants
DISCUSSION
One of the mutant’s obvious characters is that the P n of the 1st leaf was higher than that of the control but much lower in the 3rd and 4th leaves. Our result was reliable because actually detected contents of Chl and soluble protein were consistent with the reported characters of these parameters which were detected in several independent experiment (data not shown). The downtrend of these parameters might be responsible for fast rising of MDA contents. However, we did not rule out the mobilization of nitrogen and other nutrition from the old leaves to the flag leaf for survival that result from the ‘sink’ and ‘source’ out of the balance in pse(t) mutant at the late stage. The underlying molecular mechanisms need to be further studied.
The rapid decline of P n was consistent with the AOS accumulation (Del Rio et al., 1998). The mutant’s upgrade trend was remarkable in the rising temperature. This implies that the AOS damaged the mutant greatly under the relatively higher temperature treatment. The SOD and POD activities were found to be higher in the mutant’s leaves serving as protection against AOS damage. However, the trend of SOD activities of leaves was not remarkably different in the mutant subjected to different temperature treatment, the same result was found in the case of POD. This result was consistent with the mutant’s rapidly upgrading MDA trend during high temperature treatment. This indicated that SOD and POD could more efficiently clear away the AOS in the mutant under 24 °C treatment than in the mutant under 28 °C treatment. As a result, the oxidative damage was less in the mutant in the 24 °C treatment.
The pse(t) mutant was a good material for studying the molecular and genetic mechanism of senescence interaction with temperature. Physiological analysis indicated that some defense mechanism might be destroyed in the mutant, which caused the mutant to be unable to protect itself from AOS attack. When AOS accumulate above a certain threshold, the symptom of premature senescence will appear in the mutant, which indicated that the pathway of AOS generation and clearance was very important for plant growth and reproduction. Previous studies indicate that the premature senescence phenotype was controlled by a single recessive gene and that the mutant was not produced by the T-DNA insert. The Pse(t) was mapped to the 220-kb region on chromosome 7 (Li et al., 2005). Protein BLAST indicated that there are two genes associated with AOS removal pathways within the mapped region of pse(t). Mutations covering the two presumable genes’ sequenced will be further identified. Final cloning of the Pse(t) will be determined by complementary test. Identification of Pse(t) will give us reasonable knowledge on the molecular and genetics mechanism of the premature senescence in crops.
CONCLUSION
Preliminary conclusion on the physiological characteristics of the pse(t) mutant is summarized below. During flowering stage in the phytotrons, the contents of total Chl and soluble protein in the 1st leaf of pse(t) are higher compared with the control. They decreased with the descent of leaf positions and in the mutant’s 3rd and 4th leaves are lower than those of the control. The activities of SOD and POD in the pse(t) were higher than those in the control. The MDA content and the peptidase activity in the mutant’s 3rd and 4th leaves are higher than those in the control. The mutant’s activities of SOD were not significantly different in the mutant subjected to 24 °C and 28 °C treatments, and the same trend was obtained with the activities of POD. Finally, the seed-setting rate and 1000-grain weight in the 24 °C treatment mutant were higher than those in the 28 °C treatment mutant. All these results indicated that the pse(t) mutant was sensitive to high temperature. The PSE(T) may take part in the clearance of AOS pathway produced during the late developmental stage in rice.
Footnotes
Project supported by the National Basic Research Program (973) of China (No. G19990116-1), the High-Tech Research and Development Program (863) of China (No. 2002AA2Z1001), the State Key Laboratory of Rice Biology and partly granted (Nos. 30471051 and 30470933) from National Natural Science Foundation of China
References
- 1.Bradford MM. A rapid and sensitive method for the quantitation of microgram quantities of protein utilizing the principle of protein-dye binding. Anal Biochem. 1976;7(2):248–254. doi: 10.1006/abio.1976.9999. [DOI] [PubMed] [Google Scholar]
- 2.Chen Y. The Determination of Protease (Peptidase). Modern Plant Physiology: A Laboratory Manual. Beijing, China: Science Press; 1999. pp. 149–151. (in Chinese) [Google Scholar]
- 3.Del Rio LA, Pastori GM, Palma JM, Sandalio LM, Sevilla F, Corpas FJ, Jimenez A, Lopez-Huertas E, Hernandez JA. The activated oxygen role of peroxisomes in senescence. Plant Physiol. 1998;116(4):1195–1200. doi: 10.1104/pp.116.4.1195. [DOI] [PMC free article] [PubMed] [Google Scholar]
- 4.Duan J, Liang CY, Huang YW. Studies on leaf senescence of hybrid rice at flowering and grain formation stage. Acta Phytophysiologica Sinaca. 1997;23(2):139–144. (in Chinese with English abstract) [Google Scholar]
- 5.Foyer CH, Vanacker H, Gomez LD, Harbinson J. Regulation of photosynthesis and antioxidant metabolism in maize leaves at optimal and chilling temperatures: Review. Plant Physiol Biochem. 2002;40(5):659–668. [Google Scholar]
- 6.Giannopolitis CN, Ries SK. Superoxide dismutase in higher plants. Plant Physiol. 1977;59:309–314. doi: 10.1104/pp.59.2.309. [DOI] [PMC free article] [PubMed] [Google Scholar]
- 7.Hill CM, Pearson SA, Smith AJ, Rogers LJ. Inhibition of chlorophyll synthesis in Hordeum vulgare by 3-amino-2,3-dihydrobenzoic acid (gabaculin) Bioscience Report. 1985;5(9):775–781. doi: 10.1007/BF01119876. [DOI] [PubMed] [Google Scholar]
- 8.Izumi O, Kuniyuki S, Toshirou K. Effects of Rising Temperature on Growth, Yield and Dry-matter Production of Rice Grown in the Paddy Field. The 4th International Crop Science Congress; Brisbane, Australia. 2004. pp. 1–4. [Google Scholar]
- 9.Jiang CZ, Rodermel SR. Regulation of photosynthesis during leaf development in RbcS antisense DNA mutants of tobacco. Plant Physiol. 1995;107(1):215–224. doi: 10.1104/pp.107.1.215. [DOI] [PMC free article] [PubMed] [Google Scholar]
- 10.Jing HC, Sturre MJ, Hille J, Dijkwel PP. Arabidopsis onset of leaf death mutants identify a regulatory pathway controlling leaf senescence. Plant J. 2002;32(1):51–63. doi: 10.1046/j.1365-313x.2002.01400.x. [DOI] [PubMed] [Google Scholar]
- 11.Lal AM, Ku SB, Edwards GE. Analysis of inhibition of photosynthesis due to water stress in the C3 species Hordeum vulgare and Vicia faba: Electron transport, CO2 fixation and carboxylation capacity. Photosynth Res. 1996;49(1):57–69. doi: 10.1007/BF00029428. [DOI] [PubMed] [Google Scholar]
- 12.Lewis JD, Wang XZ, Griffin KL, Tissue DT. Effects of age and ontogeny on photosynthetic responses of a determinate annual plant to elevated CO2 concentrations. Plant Cell Environ. 2002;25(3):359–368. [Google Scholar]
- 13.Li X, Jiao DM, Liu YL, Huang XQ. Chlorophyll fluorescence membrance lipid peroxidation in the flag leaves of different high yield rice variety at late stage of development under nature condition. Acta Botanica Sinaca. 2002;44(4):413–421. [Google Scholar]
- 14.Li FZ, Hu GC, Fu YP, Si HM, Bai XM, Sun ZX. Genetic analysis and high-resolution mapping a premature senescence gene ‘Pse(t)’ in rice. Genome. 2005 doi: 10.1139/g05-030. (in press) [DOI] [PubMed] [Google Scholar]
- 15.Lim PO, Woo HR, Nam HG. Molecular genetics of leaf senescence in Arabidopsis . Trends Plant Sci. 2003;8(6):272–278. doi: 10.1016/S1360-1385(03)00103-1. [DOI] [PubMed] [Google Scholar]
- 16.Lu DZ, Pan YC, Ma YF, Lin ZD, Bao WQ, Jin YM, You SF. Physiology and biochemical studies on leaf senescence at heading and grain formation stage in hybrid rice. Science Agriculture Sinaca. 1988;21(1):21–26. (in Chinese with English abstract) [Google Scholar]
- 17.Madhava RKV, Sresty TVS. Antioxidative parameters in the seedlings of pigeonpea (Cajanus cajan L. Millspaugh) in response to Zn and Ni stresses. Plant Sci. 2000;157(1):113–128. doi: 10.1016/s0168-9452(00)00273-9. [DOI] [PubMed] [Google Scholar]
- 18.Matile P, Hortensteiner S, Thomas H. Chlorophyll degradation. Annu Rev Plant Physiol Plant Mol Biol. 1999;50(1):67–95. doi: 10.1146/annurev.arplant.50.1.67. [DOI] [PubMed] [Google Scholar]
- 19.Misr AN, Meena M. Effect of temperature on senescing detached rice leaves: I. Photoelectron transport activity of chloroplasts. Plant Sci. 1986;46(1):1–4. [Google Scholar]
- 20.Nam HG. The molecular genetic analysis of leaf senescence. Curr Opin Biotechnol. 1997;8(2):200–207. doi: 10.1016/s0958-1669(97)80103-6. [DOI] [PubMed] [Google Scholar]
- 21.Normile D. Crossing rice strains to keep Asia’s rice bowls brimming. Science. 1999;283(5400):313. [Google Scholar]
- 22.Pourtau N, Mares M, Purdy S, Quentin N, Ruel A, Wingler A. Interactions of abscisic acid and sugar signalling in the regulation of leaf senescence. Planta. 2004;219(5):765–772. doi: 10.1007/s00425-004-1279-5. [DOI] [PubMed] [Google Scholar]
- 23.Pruzinska A, Tanner G, Anders I, Roca M, Hortensteiner S. Chlorophyll breakdown: Pheophorbide a oxygenase is a rieske-type iron-sulfur protein, encoded by the accelerated cell death 1 gene. Proc Natl Acad Sci. 2003;100(25):15259–15264. doi: 10.1073/pnas.2036571100. [DOI] [PMC free article] [PubMed] [Google Scholar]
- 24.Quick WP, Chaves MM, Wendler R, David M, Rodrigues ML, Passaharinho JA, Pereira JS. The effect of water stress on photosynthetic carbon metabolism in four species grown under field conditions. Plant Cell Environ. 1992;15(1):25–35. [Google Scholar]
- 25.Sun ZX, Fu YP, Zhu ZG, et al. Construction of Three Transgenic Rice Populations by Maize Transposable Element Ac/Ds Mutagenesis via Agrobacterium Tumefaciens . In: Khush GS, Brar DS, Hardy B, editors. Advances in Rice Genetics. Metro Manila, Philippines: 2003. pp. 547–549. IRRI, DAPO Box 7777. [Google Scholar]
- 26.Takahashi A, Kawasaki T, Wong HL, Suharsono U, Hirano H, Shimamoto K. Hyperphosphorylation of a mitochondrial protein, prohibitin, is induced by calyculin A in a rice lesion-mimic mutant cdr1 . Plant Physiol. 2003;132(4):1861–1869. doi: 10.1104/pp.103.021733. [DOI] [PMC free article] [PubMed] [Google Scholar]
- 27.Wu F, Zhang G, Dominy P. Four barley genotypes respond differently to cadmium: Lipid peroxidation and activities of antioxidant capacity. Environ Exp Bot. 2003;50(1):67–78. [Google Scholar]
- 28.Xu LL, Ye MB. A measurement of peroxidase activity using continuous recording method. J Nanjing Agricult Univ. 1989;12(3):82–83. (in Chinese) [Google Scholar]
- 29.Yang JC, Peng SB, Zhang ZJ, Wang ZQ, Visperas RM, Zhu QS. Grain and dry matter yields and partitioning of assimilates in japonica/indica hybrid rice. Crop Sci. 2002;42(3):766–772. [Google Scholar]
- 30.Yang M, Wardzala E, Johal GS, Gray J. The wound-inducible Lls1 gene from maize is an orthologue of the Arabidopsis Acd1 gene, and the LLS1 protein is present in non-photosynthetic tissues. Plant Mol Biol. 2004;54(2):175–191. doi: 10.1023/B:PLAN.0000028789.51807.6a. [DOI] [PubMed] [Google Scholar]
- 31.Zhu ZG, Xiao H, Fu YP, Hu GC, Yu YH, Si HM, Zhang JL, Sun ZX. Construction of transgenic rice populations by inserting the maize transponson Ac/Ds and genetic analysis for several mutants. Chin J Biotech. 2001;17(3):288–292. (in Chinese with English abstract) [PubMed] [Google Scholar]


