Abstract
Surface EMG (electromyography) signal is a complex nonlinear signal with low signal to noise ratio (SNR). This paper is aimed at identifying different patterns of surface EMG signals according to fractal dimension. Two patterns of surface EMG signals are respectively acquired from the right forearm flexor of 30 healthy volunteers during right forearm supination (FS) or forearm pronation (FP). After the high frequency noise is filtered from surface EMG signal by a low-pass filter, fractal dimension is calculated from the filtered surface EMG signal. The results showed that the fractal dimensions of filtered FS surface EMG signals and those of filtered FP surface EMG signals distribute in two different regions, so the fractal dimensions can represent different patterns of surface EMG signals.
Keywords: Surface EMG signal, Fractal dimension, Correlation dimension, Self-similarity, GP algorithm
INTRODUCTION
Surface EMG signal recorded from the skin surface over limb muscles in the process of limb movement is called action surface EMG (ASEMG) signal. Containing the electrical and functional properties of limb muscle contraction and providing the information on the neuromuscular activity from which ASEMG signal originates, ASEMG signal has been widely applied in rehabilitation and the controls of prosthetic devices for the individuals with amputations or congenitally deficient limbs (Hudgins et al., 1993; Chang et al., 1996; Kang et al., 1996; Englehart et al., 1999; Hu et al., 2005). But to large extent, the applications depend on the features extracted from ASEMG signal.
So far, many parameters of ASEMG signal have been used to represent the features. In the control system which Hudgins et al.(1993) devised for powered upper-limb prosthesis, he utilized some time-domain parameters such as zeros crossings, mean absolute value, slope sign changes, etc. Because of the random nature of raw ASEMG signal, it was also analyzed as a stochastic process. For example, Kang et al.(1996) used autoregressive models to represent ASEMG signal, and Chang et al.(1996) took advantage of the cepstral coefficients of ASEMG signal as the control command of man-machine interface. Later, some time-frequency features of ASEMG signal, such as wavelet coefficients (Englehart et al., 1999) and relative wavelet packet energy (Hu et al., 2005), were used to describe the characteristics of ASEMG signal, which is very complex, nonstationary and nonlinear (Gupta et al., 1997; Lei et al., 2001), so there is still much work to do so as to make a right decision for different ASEMG signal patterns.
In recent years, nonlinear dynamics has been greatly developed and it has been made clear that simple nonlinear systems can exhibit highly complex behavior (Grassberger and Procaccia, 1983; Parker and Chua, 1989; Buczkowski et al., 1998; Kim et al., 1999; Eke et al., 2002; Sarkar and Leong, 2003). In complex signal exists self-similarity phenomenon, in that there is a smaller scale structure that resembles the larger scale structure in complex medical signals such as EMG, EEG (electroencephalography) and ECG (electrocardiograph) signals (Eke et al., 2002). Fractal dimension can be applied to determine the self-similarity (Eke et al., 2002; Sarkar and Leong, 2003) and has been applied in surface EMG signal (Gupta et al., 1997). However, because ASEMG signal’s SNR is very low (Xu and Xiao, 2000), in order to get the fractal dimension which accurately characterizes the nonlinear characteristics of ASEMG signal, a necessary step is to effectively remove noise from the ASEMG signal before the fractal dimension is estimated.
In this paper, the authors distinguish two different patterns of ASEMG signals by their fractal dimensions from the filtered ASEMG signals.
MATERIALS AND METHODS
ASEMG acquisition and preprocessing
All ASEMG signals were recorded from the right forearm flexor of 30 healthy volunteers in the EMG room at Hua Shan Hospital in Shanghai, China. Two set 2 cm apart, 5 mm diameter electrodes were put on the skin surface over the flexor carpi radialis on the right forearm along the flexor. The negative electrode was placed nearer every volunteer’s heart than the positive electrode to form a differential comparator amplifier. The sampling frequency was 1000 Hz. During the acquiring process, every volunteer was instructed to complete two different kinds of limb actions: FS (forearm supination) and FP (forearm pronation). Two patterns of ASEMG signals lasting more than 1000 ms were recorded elaborately from every volunteer’s forearm flexor: one during FS and the other during FP. Thus, among the 60 sets of ASEMG signals acquired, there were two ASEMG signal patterns: FS ASEMG signal and FP ASEMG signal, 30 sets for each pattern.
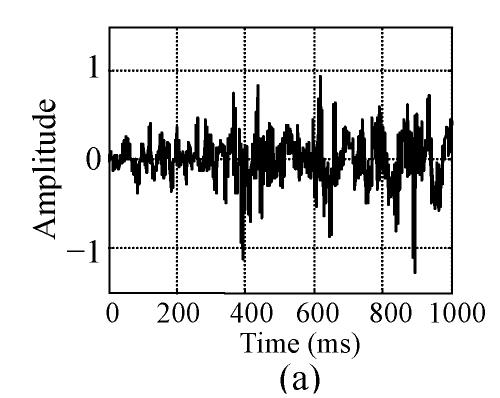
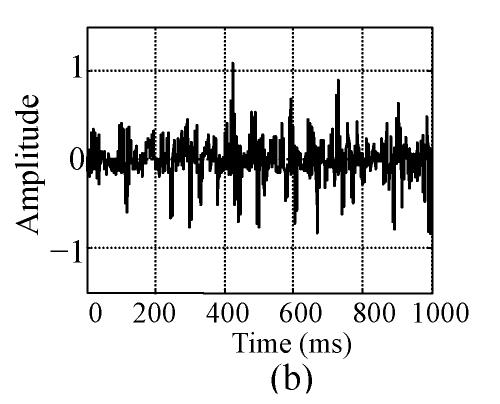
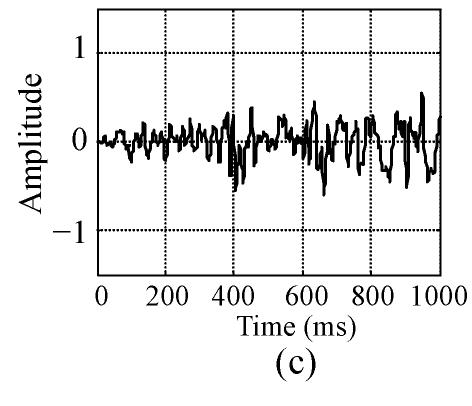
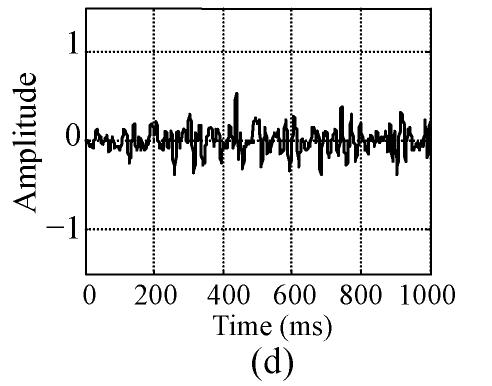
Then, all 60 sets of raw ASEMG signals were filtered by a low-pass filter. Major spectral energy of surface EMG signal centered in 0~350 Hz (Xu and Xiao, 2000), so the cut-off frequency of the low-pass filter was set at 350 Hz. Fig.1 shows a raw signal and its filtered signal from the same volunteer: the left panels for FP and the right panels for FS. Fig.1 shows clear that after the raw signal had been filtered, the noise, especially the high frequency pulses, is successfully reduced and that the amplitude of the signal varies between −0.5 and 0.5, and is symmetric.
Fig. 1.
Raw signal and filtered signal (a) and (b) are respectively raw FP signal and FS signal of the same volunteer; (c) and (d) are respectively the filtered signals of the signals on (a) and (b)
m-dimension phase space reconstruction
According to Takens’ theorem, in order to sufficiently disclose information hidden in the medical time series, a time series, xi, i=1, 2, …, L, is often turned into a new m-dimensional phase space in the following way. L is the length of the signal.
| y1={x1, x1+τ, … x1+(m−1)τ}
y2={x2, x2+τ, … x2+(m−1)τ} … yi={xi, xi+τ, … xi+(m−1)τ} … yN={xN, xN+τ, … xN+(m−1)τ} |
where N is the number of the points in the phase space (N=L−(m−1)τ), m is embedding dimension and τ is time delay. Because real ASEMG signal is finite and noisy, an appropriate τ must be chosen to ensure that the elements of yi are independent and that the same τ can be used for all embedding dimension m. Many methods proposed for obtaining appropriate time delay τ include the autocorrelation function, the mutual information and C-C method (Kim et al., 1999). Due to its convenience and fast calculation, in this paper the autocorrelation function is adopted to get the time delay τ which is determined by the first zero-crossing of the autocorrelation function. An embedding dimension m should satisfy the condition (Parker and Chua, 1989): m≥2D+1 where D is the fractal dimension of real medical signal.
Fractal dimension
Fractal dimensions have multiple definitions, but one thing in common: their value is usually a non-integer, fractional number, hence this dimension is referred to as fractal. The existing fractal dimensions include Hausdorff dimension, box dimension, information dimension, correlation dimension and so on (Sarkar and Leong, 2003). In this paper, the correction dimension (D c) of time series is used as fractal dimension. D c introduced by Grassberger and Procaccia (1983) is widely used in many fields for the characterization of strange attractors. In fractal analysis, D c determines how the distribution of signal set scales up/down with decreasing/increasing radius of each hypersphere (Sarkar and Leong, 2003). In the GP algorithm for D c, correlation integral function is applied as follows:
 |
(1) |
where
 |
(2) |
is Heaviside unit function, and dij is a Euclidean distance between points yi and yj in the reconstruction phase space. D c can be estimated by
 |
(3) |
An appropriate r range must be chosen in order that D c can describe the structure of self-similarity in surface EMG signal.
Choosing r range for ASEMG signal with finite sampling points
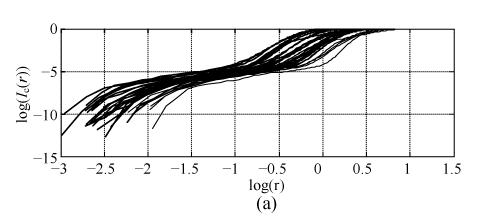
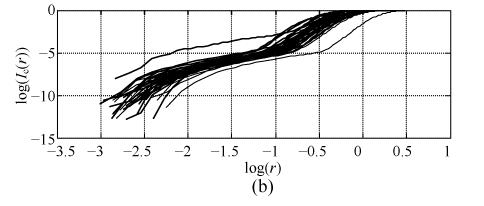
r is the side length of the hypersphere. Choosing an appropriate r range for the Heaviside function is worrisome business requiring much computation time. For the signal with infinite sampling points, r should be set r→0. But for real signal, the finite sampling points force us to calculate the fractal dimension at larger r. In this paper, we get the r range by observing the results of the following experiment. From the half minimum of the distances between any two points in reconstruction space to the maximum of the distances, the large range is divided into 99 equal intervals with 100 points. The value at the points is regarded as r. From small to large, the points are identified by the number k from 1 to 100. Then according to Eq.(3), for all identical pattern of signals, log(I c(r)) is plotted against log(r) in the same plot. Fig.2 shows log(I c(r)) vs log(r) for the filtered signal. According to Buczkowski et al.(1998)’s study, it is noticeable from Fig.2 that there are several dimensions for every signal no matter what is FP or FS signal. The values at the middle flatter curve of log(I c(r)) vs log(r) are chosen as r, so the points (k) are about from 10 to 20 for filtered FP or FS signal. With the same method, we get the points (k: 10 to 20) for raw FP or FS signal. Therefore, from the r value at k=10 to the r value at k=20, the small range is set as the r range within which D c is calculated according to Eq.(3).
Fig. 2.
The plot of log(I c(r)) vs log(r) to determine an appropriate r (a) for filtered FP signals and (b) for filtered FS signals
RESULTS
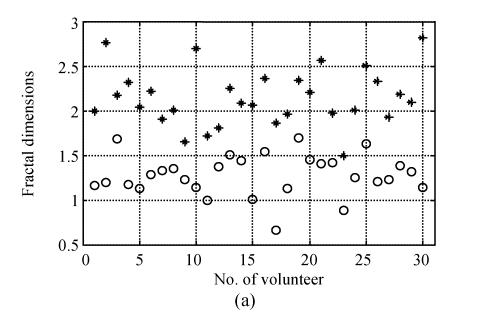
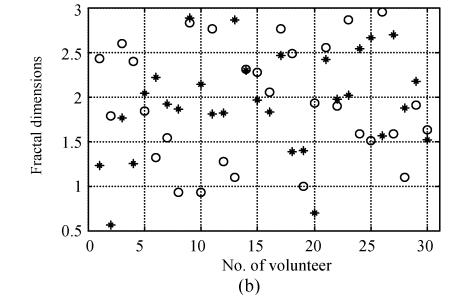
The fractal dimensions of 60 sets of filtered signals and those of 60 sets of raw signals are calculated according to Eq.(3). The fractal dimension is the slope coefficient of the fitting straight line of the middle flatter curve (k: from 10 to 20) of log(I c(r)) vs log(r) in Fig.2. The fractal dimensions are distributed on Fig.3a and Fig.3b. Fractal dimensions from raw signals distribute more dispersedly than those from filtered signals. The fractal dimensions of raw signals obviously disperse between 0.5 and 3.0, no matter whether they are of the FS signal or of the FP signal. The fractal dimensions of the FS signal are mixed together with those of the FP signal. Though the fractal dimensions of filtered signals are distributed between 0.5 and 3 too, the range becomes narrower if the fractal dimensions of filtered FP signal or of filtered FS signal are considered alone: 1.5~3 for filtered FS signal and 0.5~2 for filtered FP signal. Most fractal dimensions of filtered FS signal are bigger than those of filtered FP signal. Obviously, FS signal can possibly be distinguished from FP signal by their fractal dimensions of filtered signals but not by those of raw signals.
Fig. 3.
The distribution of fractal dimensions (a) for filtered surface EMG signals; (b) for raw surface EMG signals. Asterisk (*) and circle (○), respectively, symbolize FS and FP signals
In pattern recognition, whether a parameter can be regarded as a feature, which describes the general characteristics of the signals belonging to the same pattern and by which different patterns of signals are classified, depends on two characteristics. One is that the dispersion for the same cluster (pattern) should be as low as possible. Usually, the dispersion is measured by the standard deviation (SD). The smaller the SD of the features belonging to the same cluster is, the lower is the dispersion. The other is that the distance between the mean features belonging to different clusters should be large. The distance is called the cluster-to-cluster distance and can be calculated by
 |
(4) |
where mvi(mvj) is the mean feature of cluster i (j),that is, mvi(mvj) is the mean value of the features of all signals belonging to the cluster i (j). Certainly, larger value of dij makes a classifier work better.
The statistical features about the fractal dimensions are listed in Table 1. The mv of filtered FS is much bigger than that of filtered FP signal. Both SD of filtered FP and FS signals are much less than those of raw FP and FS signals. dij between filtered FP and FS signals is much larger than dij between raw FP and FS signals. In consequence, the fractal dimensions from filtered signals, compared to fractal dimensions from raw signals, are more appropriately regarded as the features. In fact, it is impossible to classify the two patterns of ASEMG signals by their raw signal’s fractal dimensions.
Table 1.
Statistical features of the fractal dimensions
| Filtered signals |
Raw signals |
|||
| FP | FS | FP | FS | |
| mv | 1.2771 | 2.1424 | 1.9347 | 1.9248 |
| dij | 0.8653 | 0.0099 | ||
| SD | 0.2286 | 0.3166 | 0.6352 | 0.5712 |
mv: Mean value; SD: Standard deviation; dij: Cluster-to-cluster distance
DISCUSSION AND CONCLUSION
In the forearm flexor, there are many muscles (e.g. Brachioradialis, pronator teres, flexor carpi radialis, flexor digitorum superficialis, etc.) taking charge of or assisting forearm actions. Major motor unit action potentials (MUAPs) of ASEMG signal analyzed in this study come from the muscles. When a volunteer wants to take FS or FP, the motor units (MUs) of the muscles responsible for the limb action are stimulated by excitation from the ulnar or median nerve to actively change the level of the muscles contraction, so MUAPs from the muscles are enhanced. Most MUAPs from other muscles are not enhanced. Because the tissues between MUs and surface electrode have the effect of a low pass filter on MUAPs, MUAPs from the MUs closer to the surface electrode have stronger amplitude and higher frequency, and MUAPs from the farther or deeper MUs have weaker amplitude and lower frequency (Xu and Xiao, 2000; Hu et al., 2005). MUAP is the basis unit of ASEMG signal. Therefore, the properties (such as spectral energy distribution) of ASEMG signal change with the change of the muscles contribution levels. So it is clear that between forearm action and its ASEMG signal there is a relationship which can be signified by some physical parameters such as amplitude, frequency, fractal dimension and so on.
When fractal dimension is calculated directly from the raw ASEMG signal, the fractal dimension cannot be used as the feature by which the FS ASEMG signal and FP ASEMG signal is identified, because the fractal dimensions of two patterns of ASEMG signals almost mix together. Obviously, it is the noise (in 350~500 Hz) that interferes with the accurate calculation of fractal dimension. However, the fractal dimensions calculated from the filtered signals can represent different patterns of ASEMG signals, because the fractal dimensions of FS ASEMG signals and those of FP ASEMG signals fall in two different regions and the dispersion of fractal dimensions of filtered signals is lower than that of raw signals. Lower SD of fractal dimensions implies that the fractal dimensions from the same pattern of signals are less variable, so the fractal dimension with lower SD can more accurately describe the general nonlinear characteristics of different patterns of ASEMG signal.
The study results demonstrated that the fractal dimension can determine the functional characteristics of muscles and distinguish different kinds of ASEMG signal, even to control limb prostheses.
Footnotes
Project supported by the National Natural Science Foundation of China (No. 60171006) and the National Basic Research Program (973) of China (No. 2005CB724303)
References
- 1.Buczkowski S, Hildgen P, Cartilier L. Measurements of fractal dimension by box-counting: A critical analysis of data scatter. Physica A. 1998;252:23–34. [Google Scholar]
- 2.Chang GC, Kang WJ, Luh JJ, Cheng CK, Lai JS, Chen JJJ, Kuo TS. Real-time implementation of electromyogram pattern recognition as a control command of man-machine interface. Med Eng Phys. 1996;18(7):529–537. doi: 10.1016/1350-4533(96)00006-9. [DOI] [PubMed] [Google Scholar]
- 3.Eke A, Herman P, Kocsis L, Kozak LR. Fractal characterization of complexity in temporal physiological signals. Physiol Meas. 2002;23:R1–R38. doi: 10.1088/0967-3334/23/1/201. [DOI] [PubMed] [Google Scholar]
- 4.Englehart K, Hudgins B, Parker PA, Stevenson M. Classification of the myoelectric signal using time-frequency based representations. Med Eng Phys. 1999;21:431–438. doi: 10.1016/s1350-4533(99)00066-1. [DOI] [PubMed] [Google Scholar]
- 5.Grassberger P, Procaccia I. Measuring the strangeness of strange attractors. Physica D. 1983;9:189–208. [Google Scholar]
- 6.Gupta V, Suryanarayanan S, Reddy NP. Fractal analysis of surface EMG signals from the biceps. International Journal of Medical Informatics. 1997;45:185–192. doi: 10.1016/s1386-5056(97)00029-4. [DOI] [PubMed] [Google Scholar]
- 7.Hu X, Wang ZZ, Ren XM. Classification of surface EMG signal using relative wavelet packet energy. Computer Methods and Programs in Biomedicine. 2005 doi: 10.1016/j.cmpb.2005.04.001. (in press) [DOI] [PubMed] [Google Scholar]
- 8.Hudgins B, Parker P, Scott RN. A new strategy for multifunction myoelectric control. IEEE Trans Biomed Eng. 1993;40(1):82–94. doi: 10.1109/10.204774. [DOI] [PubMed] [Google Scholar]
- 9.Kang WJ, Cheng CK, Lai JS, Shiu JR, Kuo TS. A comparative analysis of various EMG pattern recognition methods. Med Eng Phys. 1996;18(5):390–395. doi: 10.1016/1350-4533(95)00065-8. [DOI] [PubMed] [Google Scholar]
- 10.Kim HS, Eykholt R, Salas JD. Nonlinear dynamics, delay times, and embedding windows. Physica D. 1999;127:48–60. [Google Scholar]
- 11.Lei M, Wang ZZ, Feng ZJ. Detecting nonlinearity of action surface EMG signal. Physics Letters A. 2001;290:297–303. [Google Scholar]
- 12.Parker TS, Chua LO. Practical Numerical Algorithms for Chaotic Systems. New York: Springer-Verlag; 1989. pp. 193–194. [Google Scholar]
- 13.Sarkar M, Leong TY. Characterization of medical time series using fuzzy similarity-based fractal dimensions. Artificial Intelligence in Medicine. 2003;27:201–222. doi: 10.1016/s0933-3657(02)00114-8. [DOI] [PubMed] [Google Scholar]
- 14.Xu ZQ, Xiao SJ. Digital filter design for peak detection of surface EMG. Journal of Electromyography and Kinesiology. 2000;10:275–281. doi: 10.1016/s1050-6411(00)00010-9. [DOI] [PubMed] [Google Scholar]


