Abstract
A derivative ratio spectrophotometric method was used for the simultaneous determination of β-carotene and astaxanthin produced from Phaffia rhodozyma. Absorbencies of a series of the standard carotenoids in the range of 441 nm to 490 nm demonstrated that their absorptive spectra accorded with Beer’s law and that the additivity when the concentrations of β-carotene and astaxanthin and their mixture were within the range of 0 to 5 µg/ml, 0 to 6 µg/ml, and 0 to 6 µg/ml, respectively. When the wavelength interval (Δλ) at 2 nm was selected to calculate the first derivative ratio spectra values, the first derivative amplitudes at 461 nm and 466 nm were suitable for quantitatively determining β-carotene and astaxanthin, respectively. Effect of divisor on derivative ratio spectra could be neglected; any concentration used as divisor in range of 1.0 to 4.0 µg/ml is ideal for calculating the derivative ratio spectra values of the two carotenoids. Calibration graphs were established for β-carotene within 0–6.0 µg/ml and for astaxanthin within 0–5.0 µg/ml with their corresponding regressive equations in: y=−0.0082x−0.0002 and y=0.0146x−0.0006, respectively. R-square values in excess of 0.999 indicated the good linearity of the calibration graphs. Sample recovery rates were found satisfactory (>99%) with relative standard deviations (RSD) of less than 5%. This method was successfully applied to simultaneous determination of β-carotene and astaxanthin in the laboratory-prepared mixtures and the extract from the Phaffia rhodozyma culture.
Keywords: Derivative ratio spectrum, β-carotene, Astaxanthin, Spectrophotometry
INTRODUCTION
Carotenoids are a class of natural fat-soluble pigments generally found in plants, algae, and photosynthetic bacteria, where they play a critical role in the photosynthetic process. Carotenoids also exist in some non-photo-synthetic bacteria, yeasts, and molds, where they may carry out a protective function against damages by light and oxygen. Although animals can not synthesize carotenoids within their bodies, they can intake carotenoids from their diets leading to bright meat colors, and also serve as antioxidants and a source of vitamin A in animals (Ong and Tee, 1992; Britton, 1995).
Astaxanthin (3,3-dihidroxy-β-carotene-4,4-dione) is an unique carotenoid widely distributed in nature. It is one of the major pigments in the carotenoid family that provides coloration characteristics to some birds, crustaceans, and salmons (Johnson, 1991). Since these animals cannot synthesize astaxanthin, it must be included in their feed for them to obtain their appealing color. Therefore, there is growing interest in the use of astaxanthin as a pigment for the aquaculture and poultry industries (Verdoes et al., 1999). In addition, other diverse biological functions of astaxanthin have attracted more and more interest because of its health benefits to human beings due to its roles in cancer prevention, enhancement of immune response, and as free radical quencher (Paul et al., 1997). As a result, astaxanthin has high market value to the pharmaceutical and food industries.
Astaxanthin is currently chemically synthesized and added into some animal feeds for pigmentation of animals, especially for marine fishes. However, synthetic astaxanthin is expensive (approximately $2000/kg). It was reported (Johnson, 1991) that the synthetic astaxanthin accounts for approximately 10% of the total cost of the fish feed. Moreover, synthetic astaxanthin has not been approved as a GRAS (Generally recognized as safe) chemical in the United States and thus is not allowed to be used as a food additive or medicinal ingredient (Tangeras and Slinde, 1994). Therefore, production of astaxanthin from natural source is a potential alternative to replace the synthetic astaxanthin. This market driven force has stimulated considerable research for developing natural astaxanthin.
Besides the extracts of astaxanthin from green alga Haematococcus pluvialis and crustaceans, the red Basidiomycetous yeast, Phaffia rhodozyma has been identified as the best biological source of astaxanthin (Johnson, 1991). Phaffia rhodozyma can accumulate total carotenoids at concentrations of 500–2000 µg/g in dry yeast, of which 45%–95% is astaxanthin (Johnson, 2003). Although the concentration of astaxanthin in Phaffia rhodozyma is lower than that in the green alga Haematococcus pluvialis, the yeast has the advantage of producing high amount of astaxanthin through rapid self-propagation (Johnson, 1991; 2003). Therefore, the yeast has been recognized as the most promising source of producing natural astaxanthin as a result of comprehensive studies being carried out.
Carotenoids can be analyzed by HPLC method with accurate results due to its strong separation power (Calo et al., 1995; Parajo et al., 1997). But this method needs tedious sample preparation, expensive instrumentation, and long analysis time for chromatographic separation, which is not convenient and suitable for rapid determination of voluminous samples in fermentation and breeding studies. Compared with the HPLC method, classical spectrophotometric method can get results more rapidly, but it is often hindered by the problem of spectra overlapping resulted from chemical analogues that cause false results (Liang, 1996).
Derivative ratio spectrophotometric method has some reported advantages of being able to suppress matrix effects, easy of operation and obtaining results rapidly (Salinas et al., 1990; Berzas-Nevado et al., 1992). Although results from the derivative ratio spectrophotometric method are sometimes not as accurate as those from the HPLC method, it is still regarded as a good analytical method without prior separation to determine coexisting similar components in a simple system.
β-carotene (β, β-carotene) is an important intermediate in the biosynthesis of astaxanthin (Paul et al., 1997) and often coexists with the latter. For example, astaxanthin and β-carotene were reported to account for the major amount of carotenoids in Phaffia rhodozyma, while other carotenoids were in minor amounts that could be neglected (Sedmak et al., 1990). Therefore, the extract of Phaffia rhodozyma can be regarded as a binary system when only carotenoid components are considered. In this paper, applying derivative ratio spectrophotometry for simultaneous determination of β-carotene and astaxanthin in the laboratory-prepared mixtures and in Phaffia rhodozyma were studied.
MATERIALS AND METHODS
Apparatus
A UNICO-UV-2102 PC spectrophotometer (UNICO products and instruments Inc. Shanghai, China) equipped with 1 cm quartz cells was used in the following experiments. The spectrophotometer is supported with UV PC software UNICO SB-2.53.
Reagents and chemicals
Chemical standards of astaxanthin and β-carotene were purchased from Sigma Chemical Co. (St. Louis, MO, USA) and stored at −20 °C under nitrogen. Water used in the experiment was doubly distilled. Acetone and dimethylsulphoxide (DMSO) were analytical grade. Methanol was HPLC grade.
Preparation of standard mixtures
Stock solutions of astaxanthin and β-carotene in 100 μg/ml were prepared with a solvent mixture of acetone and DMSO at ratio of 2:1. Standard solutions for spectrophotometric measurements were prepared by serial dilution to the concentrations required. All the solutions were filled with nitrogen and kept at −20 °C in darkness.
Preparation of extracts of Phaffia rhodozyma
Phaffia rhodozyma past-1 was cultured in a 5 L Bio-Stat fermentor (Bio. Braun Biotech International, Germany). Cultured yeast samples were fetched in every 6 h. Then, pigments in the culture were extracted by the DMSO method reported by Sedmak et al.(1990).
Calculation of derivative ratio spectra values
Under Beer’s law, for a binary mixture containing components A and B, the absorbency of the mixture (M) at different wavelength (j) can be expressed as Eq.(1) (Salinas et al., 1990; Berzas-Nevado et al., 1992).
| AMj=εAjCA+εBjCB | (1) |
where A Mj is the absorbency of the mixture at wavelength j, ε Aj and ε Bj are the molar absorptivities of the analytes at wavelength j; C A and C B and concentrations; Eq.(1) divided by a standard spectrum of one of the components (e.g. A) at concentration C A 0 yielded the following Eq.(2).
 |
(2) |
Eq.(2) shows that the derivative ratio spectrum for a mixture of A and B is independent of the concentration of analyte A (C A) as it is the sole function of the concentration of species B (C B) and that for the standard spectrum used as divisor (C A 0), which is known. Dividing Eq.(1) by the standard spectrum for B (C B 0) yields an expression similar to Eq.(2) that allows C A to be calculated (Garcia et al., 1995).
Carotenoid mixtures were processed by spectrophotometric software and their spectra absorbencies were recorded. The first derivative ratio spectrum of β-carotene was obtained by dividing the amplitude of the mixture spectrum by the amplitude of the standard spectrum of astaxanthin. Similar procedure was followed to get the derivative ratio spectrum of astaxanthin.
RESULTS
Spectral characteristics of β-carotene and astaxanthin
Spectral absorbencies of standard 2.6 µg/ml solution of β-carotene and those of astaxanthin in 2.0 µg/ml standard solution were recorded in the range from 360 nm to 520 nm. Zero order absorption spectra of both solutions were recorded (Fig.1). The absorptive peaks in the spectra for astaxanthin and β-carotene were at 487 nm and 458 nm, respectively. These two absorption spectra were strongly overlapped in the range from 300 nm to 520 nm. In range of 441 nm to 491 nm, absorbencies of the two carotenoids were more intensive than those in other wavelengths. Absorption spectra of a series of carotenoid solutions from 441 nm to 491 nm were scanned and recorded. Their absorbencies at various wavelengths are listed in Table 1.
Fig. 1.
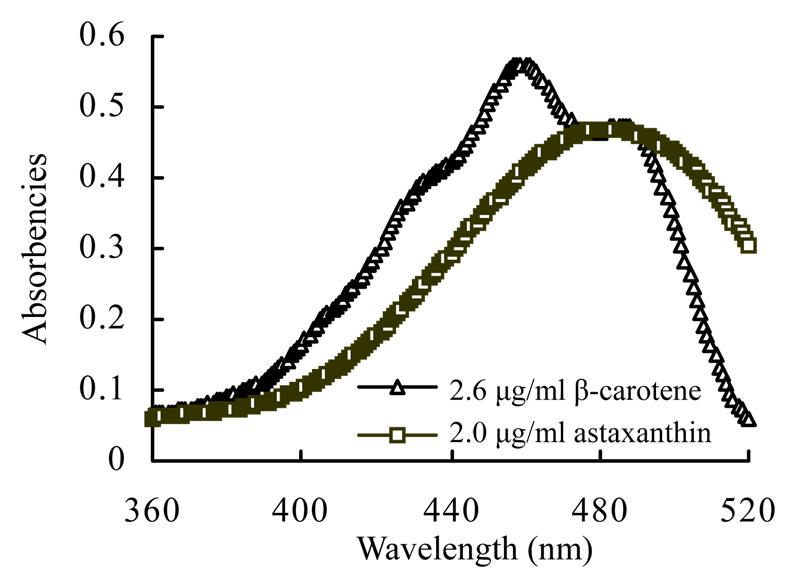
Absorption spectra of β-carotene and astaxanthin
Table 1.
Absorbencies of various carotenoid solutions at various wavelengths
| Carotenoid solution | Wavelength (nm) |
||||
| 446 | 456 | 466 | 476 | 486 | |
| 2.0 µg/ml a* | 0.331591 | 0.391964 | 0.438544 | 0.465115 | 0.467537 |
| 4.0 µg/ml a | 0.632264 | 0.755645 | 0.85259 | 0.906246 | 0.907306 |
| 6.0 µg/ml a | 0.938827 | 1.14925 | 1.314767 | 1.412241 | 1.406262 |
| 1.3 µg/ml b** | 0.236938 | 0.278815 | 0.264125 | 0.235595 | 0.239737 |
| 2.6 µg/ml b | 0.46322 | 0.55298 | 0.525884 | 0.464763 | 0.474345 |
| 3.9 µg/ml b | 0.920653 | 1.126147 | 1.056647 | 0.916434 | 0.937098 |
| 1.3 µg/ml b+2.0 µg/ml a | 0.566127 | 0.663163 | 0.698227 | 0.69948 | 0.706343 |
| 1.3 µg/ml b+4.0 µg/ml a | 0.869057 | 1.010163 | 1.110903 | 1.141211 | 1.148684 |
| 2.6 µg/ml b+2.0 µg/ml a | 0.794811 | 0.944944 | 0.964428 | 0.929878 | 0.941882 |
| Regressive equation and R2 | y(x1+x2)=0.9896(yx1+yx2)−0.007; R2=0.999 | ||||
a is the abbreviation for astaxanthin
b is the abbreviation for β-carotene
x1: Concentration of astaxanthin; x2: Concentration of β-carotene; y: Absorbency of carotenoids solution
Effect of wavelength on derivative ratio spectrum values
Fig.2 displays the first derivative ratio spectra of three standard solutions of β-carotene in the range of 441 nm to 491 nm. Likewise, Fig.3 shows the first derivative ratio spectra of astaxanthin in the same range. These figures show that the largest derivative ratio values of β-carotene and astaxanthin are both within the range of 464 nm to 469 nm, but it is difficult to tell exactly the wavelength at which the largest derivative ratio spectrum value occurs.
Fig. 2.
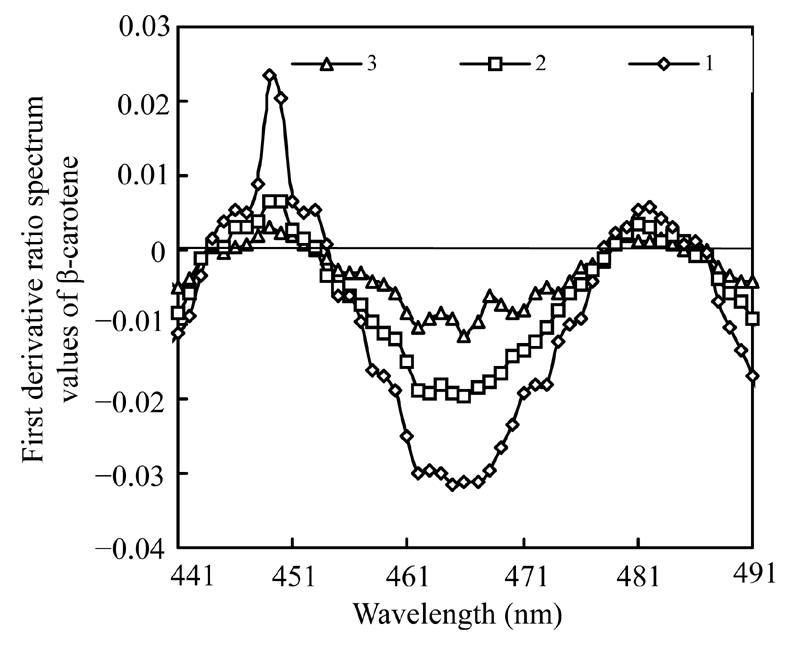
First derivative ratio spectra of β-carotene
Curve 1 represents the derivative ratio spectrum of the solution containing 2.6 µg/ml β-carotene and 2.0 µg/ml astaxanthin; Curve 2 represents the derivative ratio spectrum of the solution containing 2.0 µg/ml β-carotene and 2.0 µg/ml astaxanthin; Curve 3 represents the derivative ratio spectrum of solution containing 1.3 µg/ml β-carotene and 2.0 µg/ml astaxanthin
Fig. 3.
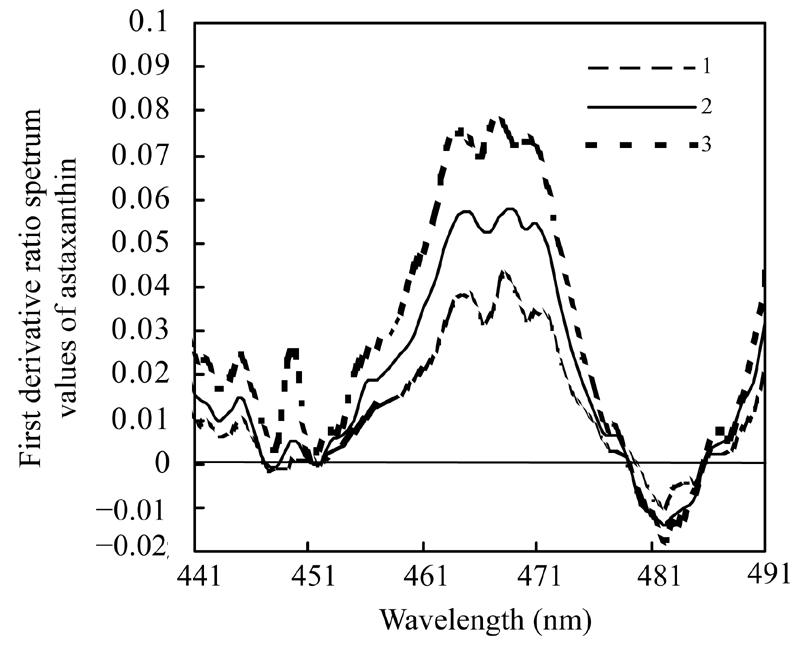
First derivative ratio spectra of astaxanthin
Curve 1 represents the first derivative ratio spectrum of the solution containing 4.0 µg/ml astaxanthin and 2.0 µg/ml β-carotene; Curve 2 represents the first derivative ratio spectrum of the solution containing 3 µg/ml astaxanthin and 2.0 µg/ml β-carotene; Curve 3 represents the first derivative ratio spectrum of the solution containing 2.0 µg/ml astaxanthin and 2.0 µg/ml β-carotene
Effect of derivative intervals on derivative ratio spectra of astaxanthin and β-carotene
Absorbencies at 441 nm to 491 nm of mixture solutions were recorded and their first derivative ratio spectrum values were calculated for various wavelength intervals. Solution containing 2.0 µg/ml astaxanthin and 2.6 µg/ml β-carotene was used to measure the effect of wavelength intervals on the derivative ratio spectrum values of β-carotene, while the solution with 1.3 µg/ml β-carotene and 4.0 µg/ml astaxanthin was used to estimate the effect of wavelength intervals on the derivative ratio spectrum values of astaxanthin. Results shown in Fig.4 and Fig.5 exhibit very similar spectral shapes of the first derivative ratio spectra obtained at various wavelength intervals.
Fig. 4.
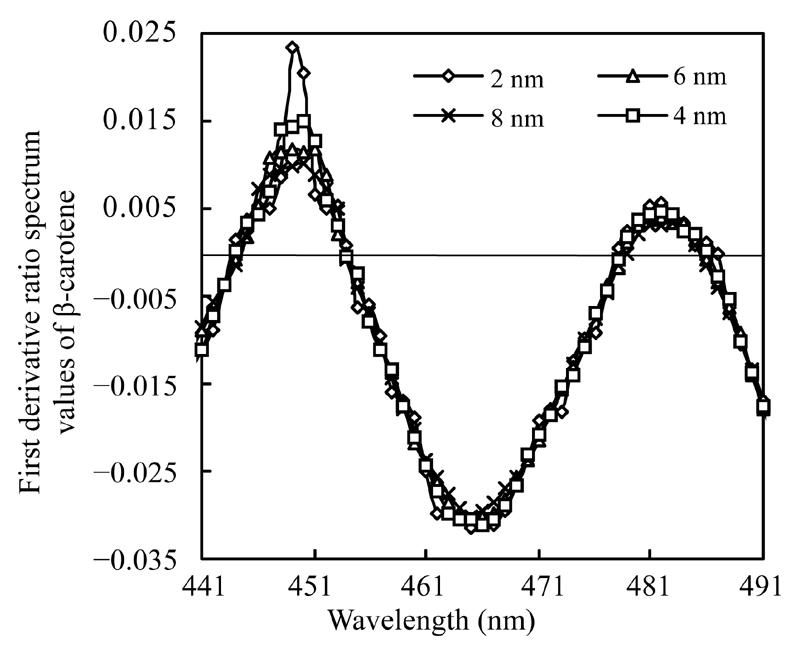
First derivative ratio spectra of β-carotene at various wavelength intervals
Fig. 5.
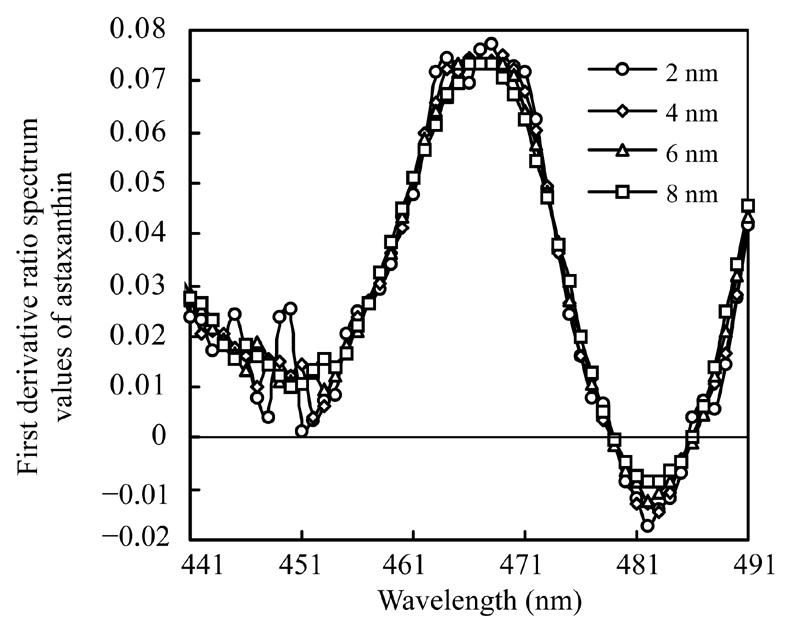
First derivative ratio spectra of astaxanthin at various wavelength intervals
Effect of divisor on the derivative ratio spectrum values
To study how the divisor affects the derivative ratio spectrum, three mixture solutions containing 2.0 µg/ml astaxanthin and 0.7 µg/ml, 1.3 µg/ml, 2.6 µg/ml β-carotene and another three mixture solutions containing 1.3 µg/ml β-carotene and 1.0 µg/ml, 2.0 µg/ml, 4.0 µg/ml astaxanthin respectively were prepared, and their absorbencies were recorded. Derivative ratio spectra of astaxanthin and β-carotene using various concentrations as divisors are shown respectively in Fig.6 and Fig.7, showing very similar patterns of the derivative ratio spectra obtained by using various concentration as divisors.
Fig. 6.
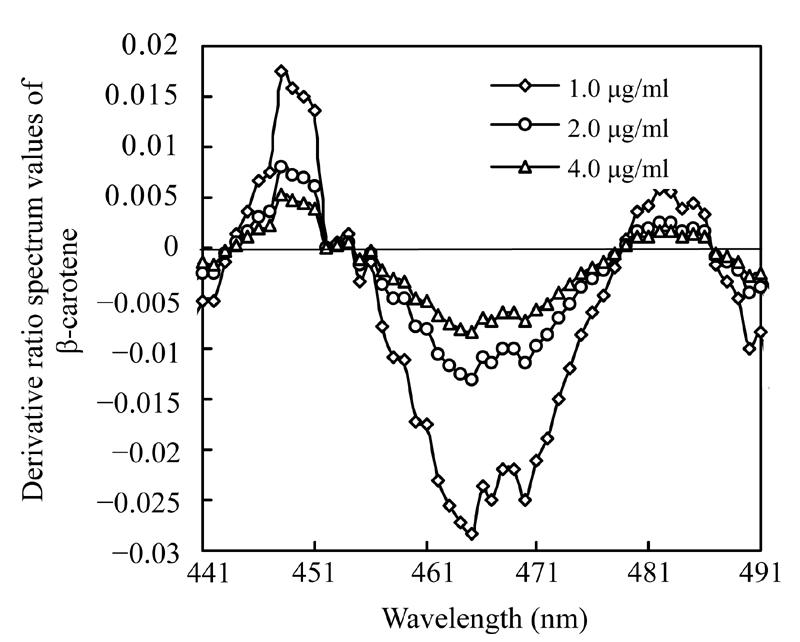
Derivative ratio spectra of β-carotene using various astaxanthin concentrations as divisors
Fig. 7.
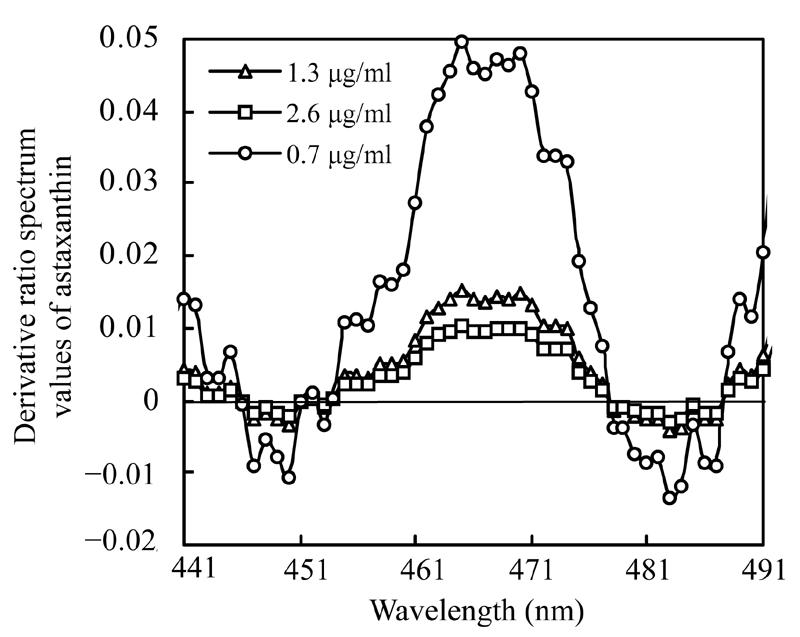
Derivative ratio spectra of astaxanthin using various concentrations of β-carotene as divisors
Effect of co-existing substances on derivative ratio spectrum
Absorbencies of the mixture solutions of 1.3 µg/ml β-carotene co-existing with astaxanthin at various concentrations and the mixture solutions of 2.0 µg/ml astaxanthin co-existing with β-carotene at various concentrations were measured and recorded. A co-existing substance’s effects on the derivative ratio spectra of β-carotene and astaxanthin are shown in Fig.8 and Fig.9. The derivative ratio spectra of β-carotene mixed with different concentrations of astaxanthin are different, while the derivative ratio spectra of astaxanthin co-existing with different concentrations of β-carotene are very similar.
Fig. 8.
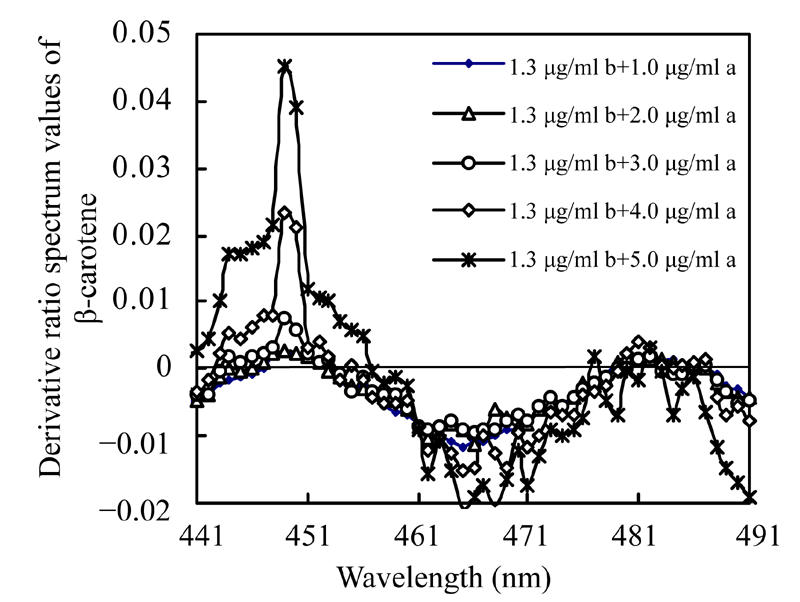
Derivative ratio spectra of β-carotene co-existing with astaxanthin at various concentrations
a: Astaxanthin; b: β-carotene
Fig. 9.
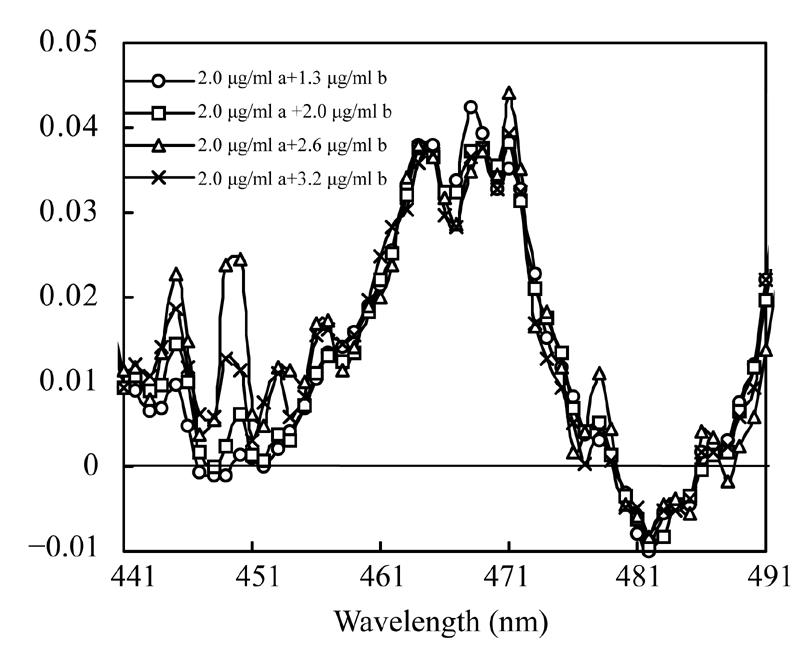
Derivative ratio spectra of astaxanthin co-existing with β-carotene at various concentrations
a: Astaxanthin; b: β-carotene
Calibration graph
A series of solutions containing 1.3 µg/ml β-carotene mixed with 1.0 µg/ml, 2.0 µg/ml, 3.0 µg/ml, 4.0 µg/ml, 5.0 µg/ml astaxanthin and another series of mixed solutions containing 2.0 µg/ml astaxanthin mixed with β-carotene at concentrations of 0.7 µg/ml, 1.3 µg/ml, 2.0 µg/ml, 2.6 µg/ml, 3.2 µg/ml, 3.9 µg/ml were prepared to plot the standard calibration curves. Absorbencies were recorded and derivative ratio spectra values were calculated. The standard curves are shown in Fig.10. Regressive equations were y=−0.0082x−0.0002 for β-carotene and y=0.0146x−0.0006 for astaxanthin, respectively. R square values were both more than 0.999.
Fig. 10.
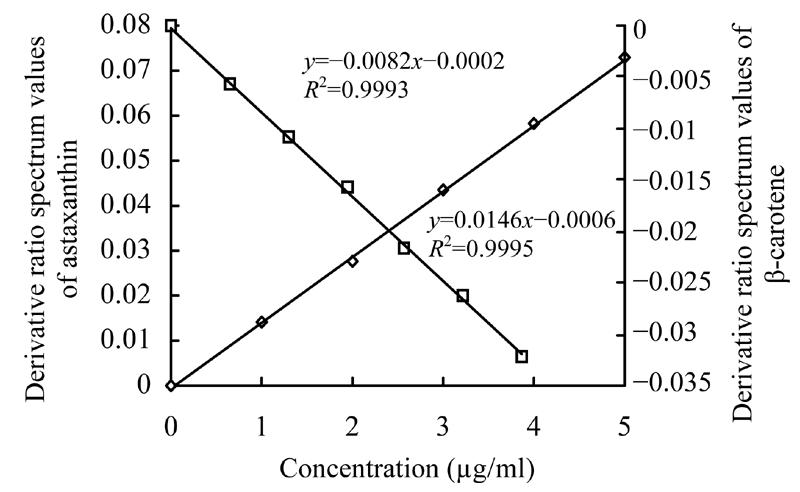
Derivative ratio spectrum standard curve of β-carotene and astaxanthin
Application of the proposed procedure for simultaneous determination of the two carotenoids in standard mixtures
Absorbencies of a series of mixed solutions at 460 nm, 462 nm, 465 nm, and 467 nm were recorded. At the same time, the derivative ratio spectra values for β-carotene at 461 nm and that for astaxanthin at 466 nm were calculated. Concentrations of β-carotene and astaxanthin were calculated by their respective regressive equations using derivative ratio spectra values just obtained. Comparison of the known spiked amounts and the calculated counterparts of the two carotenoids yielded the two carotenoids’ recoveries listed in Table 2. Average recovery rates for β-carotene and astaxanthin were 100.1%±1.3% and 100.0%±1.1%, respectively. In addition, a series of solutions of the mixed carotenoid standards were prepared to test the precision of the method (results are listed in Table 3). RSD of each sample was less than 5%.
Table 2.
Results of recovery test
| No. | Standard added (μg/ml) |
Standard recovered (μg/ml) |
Recovery (%) X±S |
||||||||
| b | a | b | a | b | a | b | a | b | a | ||
| 1 | 0.645 | 1.000 | 0.644 | 1.001 | 0.644 | 1.001 | 0.656 | 0.998 | 100.467±0.617 | 100±0.1 | |
| 2 | 0.645 | 3.000 | 0.646 | 3.001 | 0.644 | 2.998 | 0.653 | 2.996 | 100.467±0.426 | 99.944±0.048 | |
| 3 | 0.645 | 5.000 | 0.644 | 5.008 | 0.644 | 5.004 | 0.646 | 4.992 | 99.967±0.12 | 100.027±0.096 | |
| 4 | 1.935 | 4.000 | 1.930 | 4.005 | 1.941 | 3.986 | 1.927 | 4.045 | 99.889±0.211 | 100.3±0.435 | |
| 5 | 1.935 | 1.000 | 1.943 | 1.008 | 1.945 | 1.005 | 1.947 | 1.004 | 100.511±0.068 | 100.557±0.12 | |
| 6 | 1.935 | 3.000 | 1.934 | 3.007 | 1.941 | 3.002 | 1.938 | 2.985 | 100.144±0.166 | 99.933±0.222 | |
| 7 | 2.580 | 3.000 | 2.588 | 2.999 | 2.583 | 3.007 | 2.566 | 3.013 | 99.958±0.248 | 100.211±0.135 | |
| 8 | 2.580 | 1.000 | 2.583 | 1.003 | 2.585 | 1.000 | 2.590 | 0.998 | 100.225±0.08 | 100.033±0.145 | |
| 9 | 3.225 | 1.000 | 3.234 | 0.999 | 3.230 | 0.999 | 3.220 | 1.001 | 100.093±0.131 | 99.967±0.0667 | |
| 10 | 3.870 | 1.000 | 3.863 | 1.009 | 3.880 | 1.004 | 3.849 | 0.997 | 99.845±0.227 | 100.333±0.348 | |
Note: a: Astaxanthin; b: β-carotene
Table 3.
Results of precision tests
| Sample No. | Detected concentration (μg/ml) |
RSD (%) |
||||||||||
| 1 |
2 |
3 |
4 |
5 |
||||||||
| b | a | b | a | b | a | b | a | b | a | b | a | |
| 1 | 4.155 | 0.102 | 4.226 | 0.104 | 4.163 | 0.099 | 4.250 | 0.108 | 4.155 | 0.102 | 1.066 | 3.245 |
| 2 | 2.169 | 1.241 | 2.284 | 1.292 | 2.335 | 1.284 | 2.248 | 1.290 | 2.169 | 1.241 | 3.080 | 1.714 |
| 3 | 1.013 | 3.049 | 1.034 | 3.089 | 0.984 | 3.035 | 0.949 | 3.070 | 1.013 | 3.049 | 4.161 | 0.686 |
| 4 | 2.764 | 0.146 | 2.659 | 0.156 | 2.683 | 0.143 | 2.730 | 0.148 | 2.764 | 0.146 | 2.195 | 3.961 |
| 5 | 2.852 | 0.642 | 2.916 | 0.663 | 2.648 | 0.632 | 2.792 | 0.632 | 2.852 | 0.642 | 3.547 | 2.058 |
| 6 | 0.710 | 2.474 | 0.709 | 2.570 | 0.708 | 2.484 | 0.740 | 2.454 | 0.710 | 2.474 | 3.009 | 1.778 |
| 7 | 0.921 | 1.353 | 0.954 | 1.336 | 0.942 | 1.383 | 0.970 | 1.403 | 0.921 | 1.353 | 2.119 | 1.921 |
| 8 | 1.573 | 3.356 | 1.550 | 3.470 | 1.545 | 3.596 | 1.592 | 3.450 | 1.573 | 3.356 | 2.838 | 2.671 |
Note: a: Astaxanthin; b: β-carotene
Analysis of pigments extracted from the Phaffia rhodozyma culture
Astaxanthin and β-carotene extracted from Phaffia rhodozyma cultures at various cultivation phases were analyzed using the developed first derivative ratio method. Results are shown in Fig.11. During the first 18 h of cultivation, the cultures were in the lag stage, when concentrations of astaxanthin and β-carotene in cultures and cells were almost at the same level. From 18 to 36 h, the cultures were in their early exponential stages, when astaxanthin concentration in cultures and cells increased slowly. However, in the same period, β-carotene concentration in cultures and cells reached its highest value at 30 h. From 36 to 54 h, Phaffia rhodozyma cells were in their exponential stage, when the astaxanthin concentration increased rapidly, but the β-carotene concentration in cultures and cells decreased. In the stable stage of the culture from 54 to 96 h, the concentration of astaxanthin in the cultures and in cells kept increasing slowly. This result was consistent with other reported data determined by the HPLC method (Parajo et al., 1998; Ramirez et al., 2001).
Fig. 11.
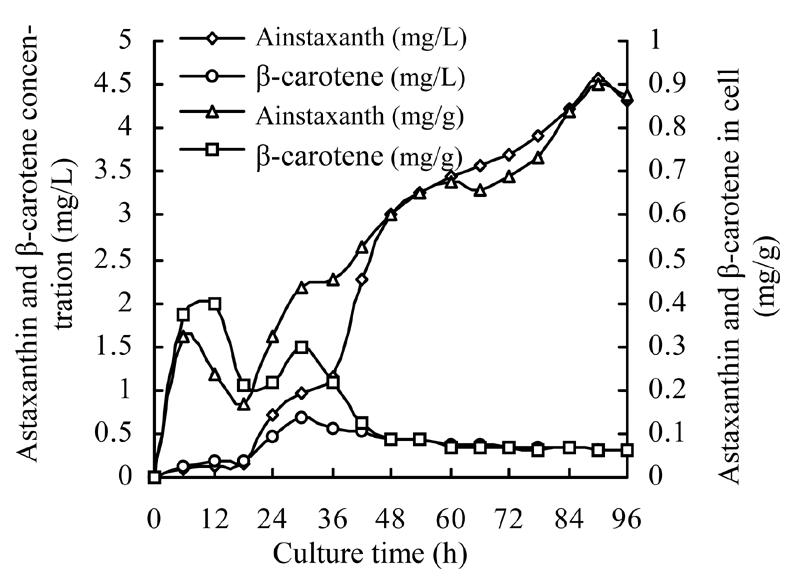
Batch production of carotenoids from Phaffia rhodozyma in fermenter
DISCUSSION AND CONCLUSION
Characteristics of absorption spectra of the two carotenoids
Fig.1 and Table 1 show that spectra of β-carotene and astaxanthin were greatly overlapped in the range of 360 nm to 520 nm, which was consistent with reports that astaxanthin and β-carotene displayed similar structure (Wang and Li, 1997). So, it was difficult to simultaneously analyze the binary mixture of astaxanthin and β-carotene by classical spectrophotometric methods.
Table 1 shows that in the range of 441 nm to 491 nm, absorbencies at the same wavelength consistently increased proportionally with the increase of carotenoids concentration; R square values of the regressive equation between absorbencies and concentrations were all more than 0.999. This suggested the relationship between the absorbency and concentration of the two carotenoids obeyed Beer’s law. When the concentration of total carotenoids was lower than 6.0 µg/ml, the absorbencies of the mixed solutions were almost equal to the sum of the absorbencies of the two components. The regressive equation was y=y 1+y 2, R square of the regressive equation was 0.999. Matching absorbencies of the mixture solution with absorbencies calculated by adding the absorbencies together, and analyzing them with T-test yielded T values of 2.10954, 1.77456 and 1, respectively. All of them were less than T critical=2.26159; The observed significant differences between absorbencies detected and calculated by adding the absorbencies together indicated that the absorption of mixed solutions in this range had good additive property. So it is possible to develop and use derivative ratio spectrum method to analyze the two carotenoids simultaneously.
Optimizing parameters of the derivative ratio spectra method for determination of the two carotenoids
Many instrumental parameters, for example, the wavelength at which point the derivative ratio spectra values are calculated, the wavelength increment over which the derivative ratio spectra values are obtained, the standard solution concentration used as a divisor and the concentration of coexisting substances will similarly affect the results of the derivative ratio method. It is necessary to study the effects of these factors on derivative ratio spectra values for developing a derivative ratio method. As shown in the results, wavelength and concentration of co-existing component were main factors that affect the derivative ratio spectra. However, divisor and derivative interval had little impact on derivative ratio spectra. Fig.2 and Fig.3 show that the derivative ratio spectra from 460 nm to 473 nm seems more stable than those that in other wavelength range, and that the absorptive intensities of derivative ratio spectra were more than those in other wavelengths. So, it was reasonable to select wavelengths in this range to calculate the derivative ratio spectra values for β-carotene and astaxanthin determination. The similar shapes of derivative ratio spectra in Fig.4 and Fig.5 indicate that impact of wavelength intervals on derivative ratio spectra is very limited. So, generally, we can use any of the wavelength intervals in the studied concentration range to calculate the derivative ratio spectrum values. Despite the error caused by a larger derivative interval and the decreased performance resulted from using a short wavelength interval, the derivative ratio spectrum values can be conveniently and accurately calculated at 2 nm wavelength interval. Similarly, Fig.6 and Fig.7 suggest that we can use any concentration within the range of 1.0 µg/ml to 4.0 µg/ml as the divisor to calculate the derivative ratio spectra. Fig.8 indicates that the derivative ratio spectra of β-carotene is affected by the concentrations of coexisting astaxanthin at many wavelengths except 461 nm at which the derivative ratio spectra values were almost the same. Five derivative ratio spectra values and statistical descriptions of β-carotene at 461 nm are listed in Table 4. Errors were very small, and the relative standard deviations (RSD) were less than 5%. The five data were compared with the average and further analyzed statistically, F value less than the critical indicated absence of significant difference at 461 nm, the derivative ratio spectra values of β-carotene mixed with astaxanthin at diverse concentrations were stable. So, in order to get the best sensitivity and repeatability, it is reasonable to determine the content of β-carotene by calculating the derivative ratio spectra values at 461 nm. On the contrary, most derivative ratio spectra values (Fig.9) of astaxanthin coexisting with β-carotene at various concentrations were almost the same. Especially at 466 nm, the derivative ratio values were very close and almost the biggest of the derivative ratio spectra. Four derivative ratio spectra values of astaxanthin at 466 nm and their statistical description are given in Table 4. The error was small; RSD was less than 5%, F value was less than the critical value. All these suggested derivative ratio spectra values of astaxanthin at 466 nm have little relation with the concentrations of coexisting β-carotene. So, it is appropriate to calculate derivative ratio spectra values at 466 nm for astaxanthin determination.
Table 4.
Derivative ratio spectra values of β-carotene at 461 nm and those of astaxanthin at 466 nm
| Carotenoids | Derivative ratio spectra values |
X±s | RSD (%) | F value | F critical | ||||
| 1 | 2 | 3 | 4 | 5 | |||||
| β-carotene | −0.0082 | −0.0084 | −0.0088 | −0.0087 | −0.0082 | −0.0085±0.0001 | 3.1928 | 1.2500 | 5.1922 |
| Astaxanthin | 0.0379 | 0.0367 | 0.0366 | 0.0370 | 0.03702±0.0003 | 1.6528 | 1.3333 | 6.5914 | |
Therefore, we obtained the optimized parameters below for developing the derivative method. Derivative ratio spectra values at 461 nm and 2 nm wavelength derivative intervals were used to determine the concentration of β-carotene. Derivative ratio spectra values at 466 nm and 2 nm wavelength derivative intervals were used to analyze astaxanthin. Regressive equations and R squares of the calibration indicated that the regressive equations reflected the experimental data and that the calibration graphs have good linearity in the range 0–5 µg/ml for astaxanthin and 0–6 µg/ml for β-carotene.
Validity of the newly developed methods
We used recovery rate and relative standard deviation as statistical parameters to evaluate the accuracy and repeatability of the analytical method. Table 2 and Table 3 show that recovery rates were between 99% and 101%, relative standard deviations were less than 5%. This proved the precision and repeatability of the proposed method. Besides, this method can yield results in a short time and does not require relatively expensive apparatus like HPLC. As a result, the proposed method can be conveniently used to determine β-carotene and astaxanthin simultaneously.
Carotenoids production in Phaffia rhodozyma
The proposed method was used to analyze the two carotenoids in Phaffia rhodozyma cultures. Results showed that the yeast could accumulate carotenoid in the exponential and stable stages; and that astaxanthin was mainly synthesized in the exponential stage. After 36 h’s culture, the concentration of β-carotene in cell and in culture reached its maximum level. After 96 h, the concentration of astaxanthin peaked. In the exponential stage and early stable stage, astaxanthin concentration kept increasing while β-carotene concentration kept decreasing. It indicated β-carotene might have been converted into astaxanthin in these culture stages.
Also, similarity of astaxanthin accumulation in the results obtained by the proposed method and by HLPC (Cruz and Parajo, 1998; Parajo et al., 1998) proved the validity of using derivative ratio spectrum method to analyze the two carotenoids in Phaffia rhodozyma culture and breeding studies.
Footnotes
Project (No. 20276064) supported by the National Natural Science Foundation of China
References
- 1.Berzas-Nevado JJ, Guiberteau CC, Salinas F. Spectrophotometric resolution of ternary mixtures of salicylaldehyde, 3-hydroxy benzaldehyde and 4-hydroxy benzaldehyde by the derivative ratio spectrum zero crossing method. Talanta. 1992;39:547–553. doi: 10.1016/0039-9140(92)80179-h. [DOI] [PubMed] [Google Scholar]
- 2.Britton G. Structure and properties of carotenoids in relation to function. FASEB J. 1995;9:1551–1558. [PubMed] [Google Scholar]
- 3.Calo P, Velazquez JB, Sieiro C, Blanco P, Longo E, Villa TG. Analysis of astaxanthin and other carotenoids from several Phaffia rhodozyma Mutants. J Agric Food Chem. 1995;43(5):1396–1399. [Google Scholar]
- 4.Cruz JM, Parajo JC. Improved astaxanthin production by Xanthophyllomyces dendrohous growing on enzymatic wood hydrolysated containing glucose and cellobiose. Food Chemistry. 1998;63(4):479–484. [Google Scholar]
- 5.Garcia JM, Hernandez O, Jimenez AI, Jimenez F, Arias JJ. A contribution to the derivative ratio spectrum method. Analytica Chimica Acta. 1995;317:83–93. [Google Scholar]
- 6.Johnson EA. Astaxanthin from microbiol sources. Critical Reveiws in Biotechnology. 1991;11(4):297–326. [Google Scholar]
- 7.Johnson EA. Phaffia rhodozyma: Colorful odyssey. Int Microbiol. 2003;6:169–174. doi: 10.1007/s10123-003-0130-3. [DOI] [PubMed] [Google Scholar]
- 8.Liang YZ. White, Gray and Black Multicomponents Systems and Their Chemometric Algorithms. Hunan, China: China Hunan Publishing House of Science and Technology; 1996. (in Chinese) [Google Scholar]
- 9.Ong ASH, Tee ES. Natural sources of carotenoids from plants and oils. Meth Enzymol. 1992;213:142–167. [Google Scholar]
- 10.Parajo JC, Santos V, Vazquez M. Co-production of carotenoids and xylitol by Xanthophyllomyces dendrorhous (Phaffia rhodozyma) Biotechnology Letters. 1997;19(2):139–141. [Google Scholar]
- 11.Parajo JC, Santos V, Vazquez M. Production of carotenoids by Phaffia rhodozyma growing on media made from Hemicellulosic Hydrolysates of Eucalyptus globules wood. Biotechnology and Bioengineering. 1998;59(4):501–506. doi: 10.1002/(sici)1097-0290(19980820)59:4<501::aid-bit13>3.0.co;2-c. [DOI] [PubMed] [Google Scholar]
- 12.Paul DF, Yutaka M, Misawa N. In vitro characterization of astaxanthin biosynthetic enzymes. Journal of Bioengineering and Chemistry. 1997;272(10):6128–6135. doi: 10.1074/jbc.272.10.6128. [DOI] [PubMed] [Google Scholar]
- 13.Ramirez J, Gutierrez H, Gschaedler A. Optimization of astaxanthin production by Phaffia rhodozyma through factorial design and response surface methodology. Journal of Biotechnology. 2001;88:259–268. doi: 10.1016/s0168-1656(01)00279-6. [DOI] [PubMed] [Google Scholar]
- 14.Salinas F, Berzas-Nevado JJ, Espinosa MA. A new spectrophotometric method for quantitative multicomponent analysis resolution of mixtures of salicylic and salicyluric acids. Talanta. 1990;37:347–351. doi: 10.1016/0039-9140(90)80065-n. [DOI] [PubMed] [Google Scholar]
- 15.Sedmak JJ, Weerasinghe DK, Jolly SO. Extraction and quantification of astaxanthin from Phaffia rhodozyma . Biotechnol Tech. 1990;4:107–112. [Google Scholar]
- 16.Tangeras A, Slinde E. Coloring of Salmonids in Aquaculture: The Yeast Phaffia Rhodozyma as a Source of Astaxanthin. In: Martin AM, editor. Fisheries Processing: Biotechnological Application. London: Chapman & Hall; 1994. pp. 391–431. [Google Scholar]
- 17.Verdoes JC, Misawa N, Van Ooyen AJJ. Clonign and characterization of the astaxanthin biosynthetic gene encoding phytoene desaturase of Xanthphyllomyces dendrorhous . Biotechnol Bioeng. 1999;63:750–755. doi: 10.1002/(sici)1097-0290(19990620)63:6<750::aid-bit13>3.0.co;2-7. [DOI] [PubMed] [Google Scholar]
- 18.Wang QY, Li QS. Nature Carotenoids: Advancements of Studies, Production and Applications. Beijing, China: China Press of Pharmaceutical Science and Technology; 1997. (in Chinese) [Google Scholar]


