We are often told that we are destroying our environment and that living conditions are deteriorating. The author of The Skeptical Environmentalist looks at global data and comes up with a more optimistic view
In The Skeptical Environmentalist I set out to describe the entire state of the world in a single book.1 This was by no means easy, and so I was a bit hesitant when the BMJ asked me to do the same again—only this time in 1500 words. So how can the true state of the world be reduced to 1500 words? Of course, it cannot be. But by relying on official statistics, global trends, and long term tendencies (what I usually refer to as fundamentals), we can draw a reasonably good picture. However, not everything can be fitted into this picture, and this article will focus on human welfare.
Summary points
Life expectancy and prosperity have risen in developed and developing countries over the past 50 years and are expected to continue to rise
Food production should keep up with population growth without greatly encroaching on forest area
Available energy resources are increasing
Pollution is likely to fall as countries become wealthier
The Kyoto agreement to reduce carbon dioxide emissions will have little effect on global warming
Measuring human welfare is complex because it consists of a myriad of inter-related subjective and objective factors. I will therefore focus on international acknowledged objective indicators of human welfare such as life expectancy, prosperity, and the fulfilment of basic needs.
Life expectancy
One of the central aspects of human welfare is life itself. Life expectancy is a proxy for the general state of health, but it also possesses an intrinsic value. Figure 1 shows the remarkable increase in life expectancy for the developing world over the past 50 years, from 41 years in 1950 to 64.7 years in 2002. For the developed world, the progress has been more modest because life expectancy had already soared at the beginning of the last century. The current life expectancy for countries in the Organisation for Economic Cooperation and Development (OECD) is 76.8 years.2
Figure 1.
Life expectancy for industrialised countries, developing countries, sub-Saharan Africa, and entire world 1950-2050. Predictions from 2000 incorporate effects of HIV and AIDS1
Figure 1 also shows the expected development in life expectancy over the next 50 years, incorporating the adverse effects of AIDS and HIV. By 2020, life expectancy in the developing world will pass the 70 years barrier, causing the world's life expectancy to continue to climb. The United Nations' populations division projects that in 2080, the world's life expectancy will be more than 80 years.3
Prosperity
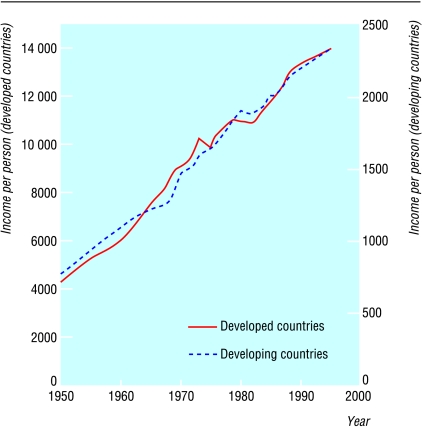
Income is a good indicator of welfare because it expands the range of opportunities open to people and allows them to live a better life. Although wealth might not always make you happier, it at least ensures freedom from famine and material deprivation—issues that play a huge part in many people's lives. The gross domestic product per capita (in 1985 power purchase parity dollars) has increased by over 200% for both the developed world and the developing world over the past 50 years (fig 2).
Figure 2.
Gross domestic product per capita for the developed and developing world in 1985 power purchase parity dollars, 1950-951
The increase in gross domestic product per capita has been accompanied by a fall in worldwide poverty. According to the United Nations, “in the past 50 years, poverty has fallen more than in the previous 500.”4 Whether inequality has also fallen is more debatable, since inequality is highly sensitive to the choice of population quintiles and the method of comparison. As for the future, all official international organisations predict an exponential rise in worldwide income and decreasing inequality as the growth rates of developing countries outpace those of industrialised countries in next 50 years.5–7
General increase in welfare
Other improvements in welfare during the past 50 years include heightened educational levels and literacy, more political and civil rights, and increased accessibility to technological innovations such as the vacuum cleaner, radio, television, computers, and the internet. In general, humankind has had an unprecedented increase in welfare. And not only that. Every single region has experienced an increase in welfare.
Of the more than 100 countries that are included in the United Nations Development Programme's human development report, only one (Zambia) experienced a drop in human development from 1975 to 1999.8 All other countries had improved human development, and the developing countries had by far the largest increase. Although most indicators show that humankind's lot has vastly improved, this does not mean that everything is good enough.
Can the development continue?
The interesting question is whether this development can continue. As I noted above, the main official international organisations predict that welfare will improve in all countries.5–7 Yet, many people believe that we live on borrowed time and that everything is getting worse. Let us examine the two major concerns of today—whether we can feed a future population and the consequences of our use of energy.
Will we have enough food in future?
One major concern is whether the world will be capable of feeding a growing population. Firstly, it is important to emphasise that the rate of population growth has fallen to 1.26% in 2000, down from the record high of 2.17% in 1964.9 Even the absolute number of people added to the world peaked in 1990 at 87 million; it is now 76 million a year and still falling. Secondly, there is no reason to expect that food production will not keep up with future population growth as it has done in the past. Figure 3 shows the development of worldwide energy intake per capita from the 1960s and depicts the positive trend up to 2030.
Figure 3.
Daily energy intake (MJ) per capita in industrial and developing countries and world, 1961-2030.1 Predicted values from 1998 onwards
Some argue that satisfying our need for food could turn the earth into a giant human feedlot.10,11 However, according to estimates from the Food and Agriculture Organization, we are currently using about 11% of the global land surface area for agriculture, and in 2030 we will be feeding more than 8 billion people better than now (13 MJ/day compared with about 11.8 MJ today) by using 12% of the land surface.12 Thus, there is reason to believe that the increase in cropland areas will be minimal—just as it has been in the past 40 years. The world's forest cover is therefore likely to remain stable into the future, just as it has done over the past 50 years (fig 4). In fact, almost all the UN climate panel scenarios predict that it will increase in the future.7
Figure 4.
UN Food and Agriculture Organization estimates of global forest cover: forest and woodlands, 1948-94 (from FAO Production Yearbook) and 1961-94 (from FAO database), closed forest for 1980-95, and new unified forest definition 1990-20001
Use of energy
The worries we have about the world's energy consumption have changed in recent years. Previously, we worried about running out of energy, but these concerns turned out to have little merit. Not only has the availability of oil, coal, and natural gases increased throughout this century, but we also leave the generation of tomorrow with many more sources of energy (including renewables). In short, we are not running out but rather leaving the world with ever more energy. Figure 5 shows the increase in the world's oil reserves from 1850 until now. The picture is the same for vital minerals (non-energy resources) such as copper, zinc, aluminium, and iron.13 In both cases, the reason for the increased availability is that we have improved our ability to find more resources, to use them more efficiently, and eventually to substitute other and more efficient sources.
Figure 5.
World's known oil reserves and world oil production 1920-2000. Total reserves until 1944 are for America only and after 1944 for entire world1
Ecological consequences
Concern has therefore shifted towards the ecological consequences of our energy use. As Greenpeace put it: “We are in the a second world oil-crisis. But in the 1970s the problem was a shortage of oil. This time round the problem is that we have too much.”14 The use of fossil fuels leads to air pollution, which constitutes a health hazard to residents of large industrialised cities. The infamous London smog is an example of extreme air pollution. Empirical evidence suggests, however, that air pollution is more correlated with income than with energy consumption. As income rises beyond a certain point, the concentrations of major air pollutants fall rapidly despite an increase in energy consumption (fig 6).
Figure 6.
Connection between gross domestic product (1985 purchasing power parity dollars) and particle pollution and sulphur dioxide concentrations in 48 cities in 31 countries, 1972 and 198615
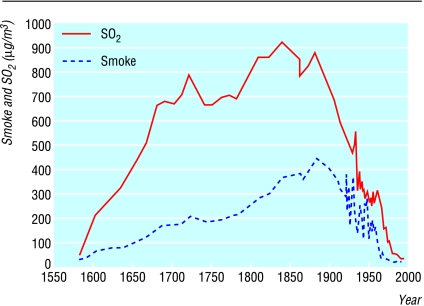
Also note that pollution for all levels of income has fallen from 1972 to 1986, which can be ascribed to the technological advances combined with increased political action to reduce pollution. Thus, in richer cities, smog is a thing of the past as almost every type of air pollution has fallen significantly. This is evident in London, where smoke pollution today is the lowest for 450 years (fig 7).
Figure 7.
Average concentrations of sulphur dioxide and smoke in London, 1585-1995. Data for 1585-1935 are estimated from coal imports and have been adjusted to the average of measured data1
Other energy problems
There are other problems with the use of energy, however. One important problem is that the emission of carbon dioxide causes global warming. With renewable energy taking over before 2100, the UN Climate Panel estimates a temperature increase of 2-3°C.7 Global warming is not expected to have a severe impact on human welfare as a whole. The total cost of global warming for the next 100 years is estimated at $5 trillion,16 which compares with a total expected income of $800-$900 trillion in the same period.7 However, the rise in temperature is projected to have little net impact on the industrialised world but a fairly severe impact on the developing world.
Countries agreeing to the Kyoto protocol have promised to cut industrialised carbon emissions by 30% of the expected level in 2010. The global costs will be large: the estimates from all macroeconomic cost-benefit models show a cost of $150-$350bn every year.17 Yet, the benefits will be marginal. The climate models show that the Kyoto protocol will affect temperature imperceptibly even 100 years from now, postponing the temperature rise a mere six years from 2100 to 2106.18
If our goal is to improve welfare, especially in the developing world, reducing carbon emissions is not the most effective way. For the same amount of money that the Kyoto protocol will cost just the European Union every year, the UN estimates that we could provide every person in the world with access to basic health, education, family planning, and water and sanitation services.19 Access to clean drinking water and sanitation alone would save nearly two million lives each year and prevent half a billion diseases annually.20
Acknowledgments
The views expressed in this article are not necessarily the views of the Danish Environmental Institute. Figure 6 is reproduced by kind permission of Oxford University Press.
Footnotes
Competing interests: BL has received fees for speaking at meetings ranging from the oil industry through university environmental programmes to debates with Greenpeace and WWF, all organisations which are likely to be affected by the outcomes of the debate.
References
- 1.Lomborg B. The skeptical environmentalist. Cambridge: Cambridge University Press; 2001. [Google Scholar]
- 2.United Nations Development Programme. Human development report: deepening democracy in a fragmented world. New York: UNDP; 2002. [Google Scholar]
- 3.United Nations Department of Economic and Social Affairs; Population Division. World population projections to 2150. New York: UN; 1998. [Google Scholar]
- 4.United Nations Development Programme. Human development report: human development to eradicate poverty. New York: UNDP; 1997. [Google Scholar]
- 5.World Bank. World development report, 2003. Washington, DC: World Bank; 2002. [Google Scholar]
- 6.Organisation for Economic Cooperation and Development. Environmental outlook. Paris: OECD; 2001. [Google Scholar]
- 7.United Nations Panel on Climate Change. Third assessment report: climate change. Rome: Intergovernmental Panel on Climate Change; 2001. [Google Scholar]
- 8.United Nations Development Programme. World development report. New York: UNDP; 2001. [Google Scholar]
- 9.United States Bureau of Census. National population projections, 2000. Washington, DC: USBC; 2000. [Google Scholar]
- 10.Ehrlich A, Ehrlich P. The population explosion. New York: Simon and Schuster; 1991. [Google Scholar]
- 11.Bongaarts J. Population: ignoring its impact. Sci Am. 2002;286(1):67–69. [Google Scholar]
- 12.Food and Agriculture Organization of United Nations. World agriculture: towards 2015/2030. Rome: FAO; 2000. www.fao.org/docrep/004/y3557e/y3557e00.htm (accessed 6 Dec 2002). [Google Scholar]
- 13. United States Geological Survey. Minerals information, 2002. http://minerals.er.usgs.gov/minerals/ (accessed 21 November 2002).
- 14.Greenpeace. International campaign to save the climate. Greenpeace. 2000. [Google Scholar]
- 15.Shafiks N. Economic development and environmental quality. Oxford Economic Papers. 1994;46:757–773. [Google Scholar]
- 16.Boyer J, Nordhaus WD. Warming the world: economic models of global warming. Massachusetts: Massachusetts Institute of Technology Press; 2000. [Google Scholar]
- 17. International Association for Energy Economics. The costs of the Kyoto protocol: a multi-model evaluation. Energy Journal 1999 May. (Special issue.)
- 18.Wigley TML. The Kyoto protocol: CO2, CH4and climate implications. Geophysical Research Letters. 1998;25:2285–2288. [Google Scholar]
- 19.Unicef. The state of the world's children. New York: Unicef; 2000. www.unicef.org/sowc02summary/index.html (accessed 6 Dec 2002). [Google Scholar]
- 20.World Health Organization. World health report 2002. Geneva: WHO; 2002. www.who.int/whr/2002/en/ (accessed 6 Dec 2002). [Google Scholar]


