Abstract
A digital image analysis algorithm based color and morphological features was developed to identify the six varieties (ey7954, syz3, xs11, xy5968, xy9308, z903) rice seeds which are widely planted in Zhejiang Province. Seven color and fourteen morphological features were used for discriminant analysis. Two hundred and forty kernels used as the training data set and sixty kernels as the test data set in the neural network used to identify rice seed varieties. When the model was tested on the test data set, the identification accuracies were 90.00%, 88.00%, 95.00%, 82.00%, 74.00%, 80.00% for ey7954, syz3, xs11, xy5968, xy9308, z903 respectively.
Keywords: Machine vision, Digital image processing, Neural network, Rice seeds, Classification
INTRODUCTION
Rice is one of the most important cereal grain crops. The quality of rice seeds has distinct effect on the yield of rice, so the proper inspection of rice seed quality is very important. The varietals purity is one of the factors whose inspection is more difficult and more complicated than that of other factors. At present, the identification of rice seed variety mainly depends on chemical method and paddy field method in China. The two methods can give relatively more exact results but have many limitations. Application of the chemical method is hampered by the limited amount of sample and very high expense for inspection. The cycle of inspection using the paddy field method is too long to satisfy the demand of seed circulation. The nondestructive identification of rice seed variety on a large scale cannot be achieved by the chemical method and the paddy field method. For cases where the information must be visually obtained repeatedly and monotonously, nondestructive inspection using machine vision based on digital image processing technology is much faster.
In the early days of machine vision application to grain quality evaluation, Lai et al.(1986) suggested some pattern recognition techniques for identifying and classifying cereal grains. The same researchers (Zayas et al., 1986) also applied the digital image analysis technique to discriminate wheat classes and varieties. Luo et al.(1999) used a color machine vision system to identify damaged kernels in wheat. Substantial work dealing with the use of different morphological features for classification of different cereal grains and varieties was reported (Draper and Travis, 1984; Keefe, 1992; Myers and Edsall, 1989; Neuman et al., 1987; Sapirstein et al., 1987; Symons and Fulcher, 1988a; 1988b; Travis and Draper, 1985; Zayas et al., 1986). Some investigations were carried out using color features (Hawk et al., 1970; Majumdar et al., 1996; Neuman et al., 1989a; 1989b) for classification of different cereal grains and their varieties for correlating vitreosity and grain hardness of Canada Western Amber Durum (CWAD) wheat. Huang et al.(2004) proposed a method of identification based on Bayes decision theory to classify rice variety using color features and shape features with 88.3% accuracy. Majumdar and Jayas (2000) developed classification models by combining two or three features sets (morphological, color, textural) to classify individual kernels of Canada Western Red Spring (CWRS) wheat, Canada Western Amber Durum (CWAD) wheat, barley, oat, and rye.
The above studies showed that the classification accuracies are high when features are distinctly different among tested varieties. In the case where there is a high similarity among groups to be discriminated, the classification accuracies are not as high as before. In this paper, a new approach for identification of rice seed variety using Feed-Forward Neural network was investigated. First, 8-bit images were obtained by a CCD (charge coupled device) color camera, then images were segmented by thresholding. And then 21 features were extracted from segmented images, after which 17 features were determined through feature selection. Finally, 4 principal components obtained from PCA were input to a neural network.
MATERIALS AND METHODS
Image acquisition
A CCD (charge coupled device) color camera (Model TMC7DSP, Pulnix) with resolution of 640 pixels×480 pixels was used to record images. Each variety of the image acquired from the CCD camera is shown in Fig.1. The field of view was 12 mm×9 mm. And the spatial resolution was approximately 0.019 mm/pixel. In order to obtain steady illumination, the camera was set to fixed color temperature at 3300 K. For image acquisition, a lens (Model ANB847) with 50 mm focal length was fitted to the camera using an extension tube (Model ANB848) of 25 mm length. The camera was mounted on a stand which provided easy vertical movement and stable support for the camera. When the camera was fixed at the place 130 mm between the lens and the sample table, clear images of rice seed were obtained. To obtain uniform lighting, a 56 mm diameter fiber circular halogen lamp whose light source was a 100 W cold light source with a rated voltage of 12 V, was used in all experiments. A black illumination chamber was between the samples table and the lens in order to reduce the influence of surrounding light, surrounding the seed. All sample seeds were certified seeds humanly selected from seed bags. Every seed could be situated in any random orientation and at any position inside the field of view. The background was a white board. The black background with low reflectance exposed the objects of interest with relatively high R (red), G (green), and B (blue) values at every pixel. The distant gray level separation between background and objects made the image segmentation easier.
Fig. 1.
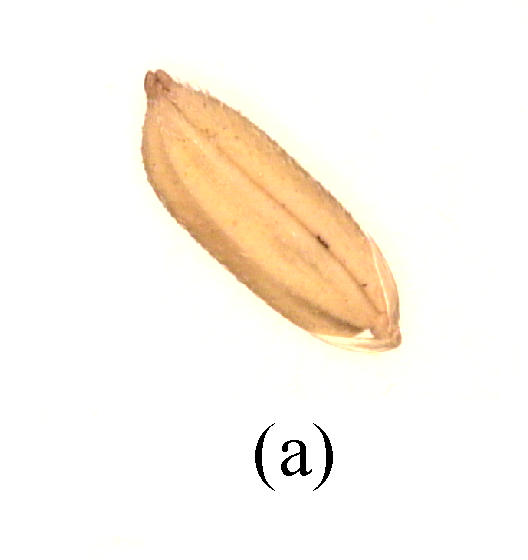
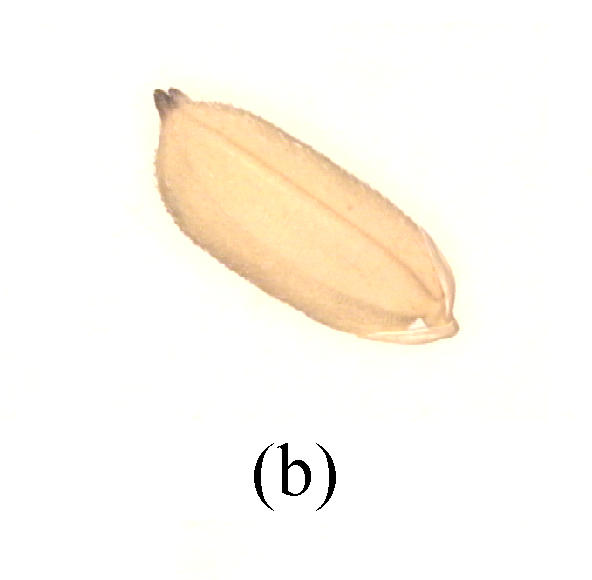
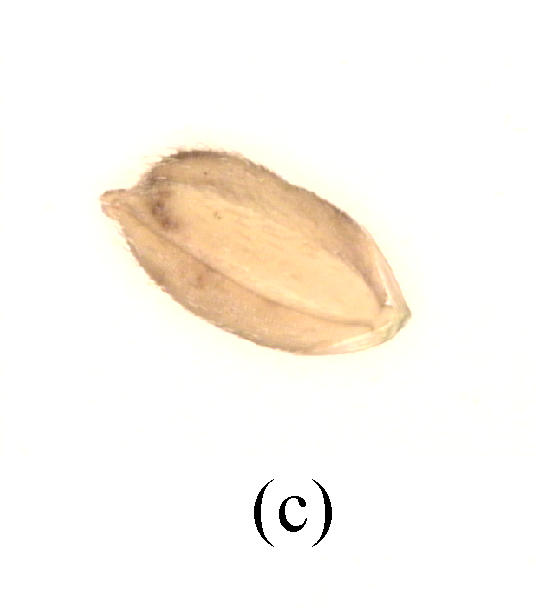
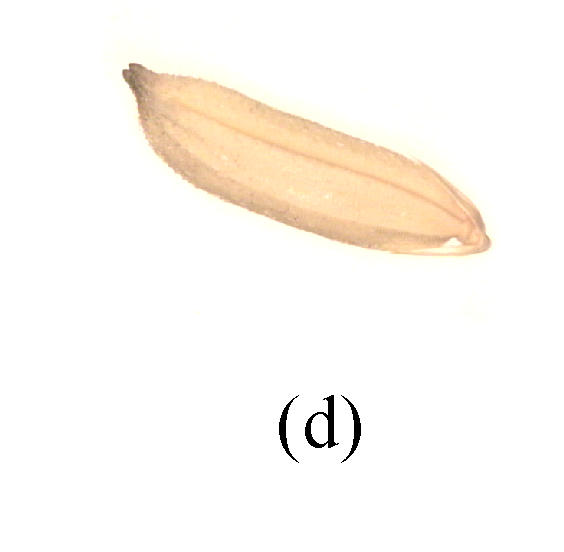
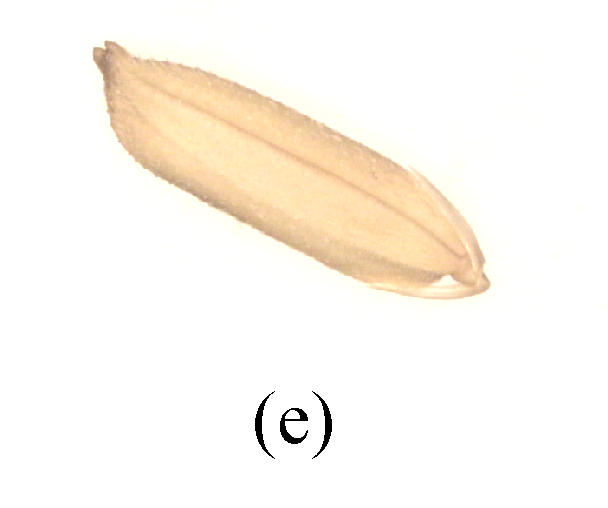
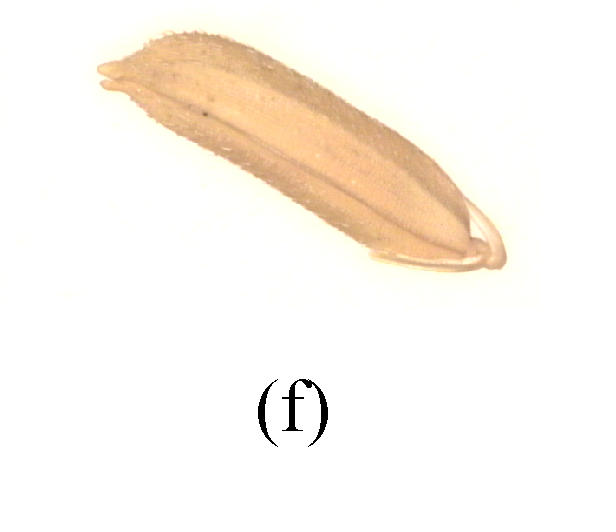
The original rice seed images (a) ey7954; (b) syz3; (c) xs11; (d) xy5968; (e) xy9308; (f) z903
The red (R), green (G), blue (B) video signals from the camera were converted to an 8-bit color digital image by a frame grabber board (Matrox Meteor/RGB PCI) installed in an IBM compatible personal computer. The camera gave three parallel analog video signals, R, G, B, corresponding to the NTSC (National Television System Committee) color primaries.
Image segmentation
Image segmentation subdividing an image into different parts or objects is the first step in image analysis. The image is usually subdivided until the objects of interest are isolated from their background. There are generally two approaches for segmentation algorithms. One is based on the discontinuity of gray-level values, the other is based on the similarity of gray-level values. The first approach is to partition an image based on abrupt changes in gray levels. The second approach uses thresholding, region growing, region splitting and merging.
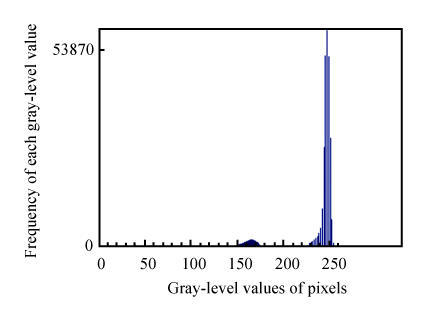
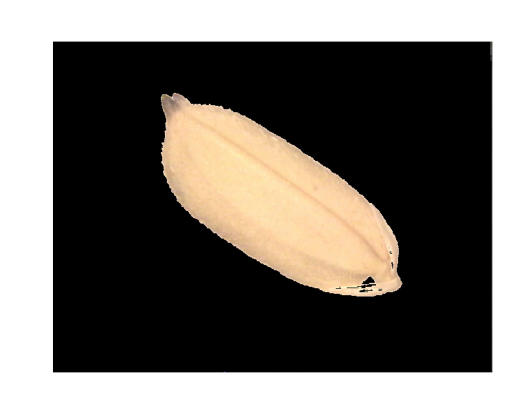
Thresholding is an important part of image segmentation. The threshold value is generated according to the results of the histogram analysis and was constant for the same environment conditions. In this study, it was found that the blue value was very different between the background and the objects. A fixed threshold value determined from the histogram of the blue plane could separate the rice seed from its background. Typical histogram of the blue plane of a rice seed image is shown in Fig.2. The threshold value was calculated in RGB color model under the VC++6.0 development environment. The rice seed pixels always dominated the area of gray levels less than 200 and took the shape of normal distribution, while background pixels dominated the area of gray levels higher than 200 and took different shapes. Therefore, the threshold value for this research was set at 200. It worked well as long as the same illumination, camera setting, and background were used. In this study, morphological features and color features were required to be extracted. So the image must retain the color information of the rice seed when segmentation was processed. All the pixels with blue value greater than 200 were assigned the value 0, and all pixels with blue value less than or equal to 200 were not processed in any operation. The level 0 area was the background, and the unchanged area was the rice seed region. The image segmented is shown in Fig.3.
Fig. 2.
The histogram of bule
Fig. 3.
Image after segmention
Feature extraction
1. Color feature extraction
Algorithms were developed in Windows environment using MATLAB 6.5 Programming language to extract color features of individual rice seeds. From the red (R), green (G), and blue (B) color bands of an image, hue (H), saturation (S), and intensity (I) were calculated using the following equations (Zhang, 1999):
 |
(1) |
 |
(2) |
 |
(3) |
The mean value of R, the mean value of G, the mean value of B, the mean value of H, the mean value of S, the mean value of I and the standard deviation of the Hue were calculated in an image after segmentation. Seven color features were extracted from the Fig.2.
2. Morphological feature extraction
Algorithms were developed in Windows environment using MATLAB 6.5 programming language to extract morphological features of individual rice seeds. The following morphological features were extracted from labelled images of individual rice seeds:
Area1 (mm2): The algorithm calculated the number of pixels inside, and including the seed boundary, and multiplied by the calibration factor (mm2/pixel).
Length (mm): It was the length of the rectangle bounding the seed.
Width (mm): It was the width of the rectangle bounding the seed.
Major axis length (mm): It was the distance between the end points of the longest line that could be drawn through the seed. The major axis endpoints were found by computing the pixel distance between every combination of border pixels in the seed boundary and finding the pair with the maximum length.
Minor axis length (mm): It was the distance between the end points of the longest line that could be drawn through the seed while maintaining perpendicularity with the major axis.
Thinness ratio: It measured the roundness of the seed.
| Round=(Perimeter)2/(4 pi×Area1) |
Aspect ratio: K1=Major axis length/Minor axis length.
Rectangular aspect ratio: K2=Length/Width.
Equivalent diameter: It was the diameter of a circle with the same area as the rice seed region.
| Equadial=sqrt(4×Area1/pi) |
Filledarea (mm2): It was the number of pixels in the binary image in which the holes were filled, and multiplied by the calibration factor (mm2/pixel).
Area2 (mm2): The major axis of the ellipse that has the same second-moments as the seed region was rotated to the horizontal direction. And the algorithm calculated the number of pixels in the binary image after rotation, and multiplied by the calibration factor (mm2/pixel).
Convex area (mm2): It was the number of pixels in the smallest convex polygon that can contain the rice seed region, and multiplied by the calibration factor (mm2/pixel).
Solidity: The proportion of the pixels in the seed region that are also in the convex hull. Computed as Area1/Convex area.
Extent: The proportion of the pixels in the bounding box that are also in the seed region. Computed as the Area1 divided by area of the bounding box.
Image analysis
Some of 21 features (14 morphological and 7 color features) used for classification of rice seed varieties may not contribute significantly to the classifier. Sometimes, the classifier performance declines if there are too many redundant features. To optimize the number of features that contributed significantly to the classification, PROC STEPDISC was used. Features of rice seeds from Zhejiang Province were used for the STEPDISC analysis. After one feature with the highest level of contribution (determined by correlation coefficient, CC and average square canonical correlation, ASCC) was identified to enter the model, the correlation coefficients among the features in the model were calculated to identify whether the newly entered feature was removed from the model. The analysis was continued until the least important feature was identified.
RESULTS AND DISCUSSION
Feature selection
Many features were highly correlated with one another and if one of the features was selected, the rest of the features will not contribute significantly to the classification model. For example, if major axis length (Maxaxis) was selected as one of the features, the addition of length or equivalent diameter, etc. will not improve the classification accuracy significantly. According to correlation coefficient, 17 features were selected for the classification model. The selected features were arranged in descending order of their level of contribution to the classification model (Table 1). The rice seed aspect ratio (K1) was the most significant feature (average squared canonical correlation, ASCC=0.1923) and the equivalent diameter (Equadial) was the least significant feature (average squared canonical correlation, ASCC=0.7517) when other features are used in the model. In a discriminant model, once the most significant feature was selected, the rest of the features were selected depending on their correlation (poorly correlated features are selected firstly) with the feature already selected.
Table 1.
Selection of features of individual seeds of rice using STEPDISC analysis (6 varieties were used, n=240) based on their contribution to classification model
| No. | Features of individual rice seed | ASCC | Partial r2 |
| 1 | K1 | 0.1923 | 0.9613 |
| 2 | Round | 0.3420 | 0.7578 |
| 3 | Smean | 0.4347 | 0.4756 |
| 4 | Hmean | 0.5175 | 0.5512 |
| 5 | Vmean | 0.5892 | 0.4910 |
| 6 | Miaxis | 0.6417 | 0.3668 |
| 7 | Maaxis | 0.6920 | 0.5055 |
| 8 | Extent | 0.7028 | 0.1690 |
| 9 | K2 | 0.7111 | 0.1352 |
| 10 | Bmean | 0.7170 | 0.1190 |
| 11 | Hstd | 0.7251 | 0.1232 |
| 12 | Rmean | 0.7292 | 0.0895 |
| 13 | Gmean | 0.7333 | 0.0719 |
| 14 | Width | 0.7385 | 0.0402 |
| 15 | Length | 0.7442 | 0.0923 |
| 16 | Area1 | 0.7503 | 0.1079 |
| 17 | Equadial | 0.7517 | 0.1294 |
Principal component analysis (PCA)
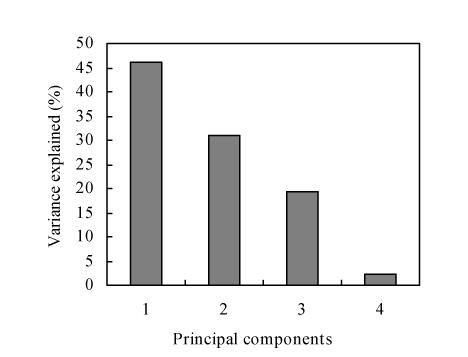
Analysis of each feature’s contributions to the principal components shows valuable information about the importance of each in the dataset. Fig.4 shows the contributions of each principal component to the total dataset. The first three principal components together accounted for 96.4% of the variance of the seventeen-feature dataset. Within these components, length, rectangular aspect ratio (K2), round are the important features.
Fig. 4.
Bar figure of principal components variance
Neural network
The high dimensionality of feature vectors as inputs to the neural network is not practical due to poor scalability and performance. Therefore, PCA was used to reduce the original feature vectors into a small number of principal components.
The neuron number (associated with the number of principal components) of the input layer is four. And the neuron number of hidden layers is seven. Trial and error approach was used to find a suitable number of the hidden layer that provided good classification accuracy based on the data input to the neural network. The neuron number of the output layer is six based on the number of classified rice seeds variety need. In our study, a two-layer tan-sigmoid/log-sigmoid network was selected. In the output layer, log-sigmoid transfer function was selected because its output (0 to 1) was fit for classification. The network was trained to output a 1 in the correct variety of the output vector and to fill the rest of the output vector with 0.
In order to train the neural network, a set of training rice seeds was required, and the varieties were predefined. During training, the connection weights of the neural network were initialized with some random values. The training samples in the training set were input to the neural network classifier in random order and the connection weights were adjusted according to the error back-propagation learning rule. This process was repeated until the mean squares error (MSE) fell below a predefined tolerance level or the maximum number of iterations is achieved. When the network training was finished, the network was tested with test dataset (60 kernels rice seed), and the classification accuracies were calculated. For ey7954, syz3, xs11, xy5968, xy9308, z903, the classification accuracies were 90.00%, 88.00%, 95.00%, 82.00%, 74.00%, 80.00% respectively.
CONCLUSION
An algorithm was developed to identify varieties of rice seed based on morphological features and color features. Fourteen morphological features and seven color features of each image acquired with a color machine vision system were extracted. And seventeen features were selected from the original 21 features by PROC STEPDISC method. Four principal components were obtained after Principal Component Analysis. A two-layer tan-sigmoid/log-sigmoid network was used to classify the rice seed. In the test dataset, the classification accuracies were 90.00%, 88.00%, 95.00%, 82.00%, 74.00%, 80.00% for ey7954, syz3, xs11, xy5968, xy9308, z903 respectively. The classification accuracy of xs11 was the highest since the xs11 was externally very different from the others, as it had short and plump shape. The high similarity of xy5968, xy9308, z903 resulted in decreased classification accuracies.
The classification accuracy was acquired under laboratory setting, so it had some limits. In future work, a large quantity of rice seeds, not one at a time, will be investigated.
Acknowledgments
We would like to express our special thanks to the Zhejiang Province Seeds Company and the Hybrid Rice Institute of China for supplying samples in the research.
Footnotes
Project supported by the National Natural Science Foundation of China (No. 60008001) and the Natural Science Foundation of Zhejiang Province, China (No. 300297)
References
- 1.Draper SR, Travis AJ. Preliminary observations with a computer based system for analysis of the shape of seeds and vegetative structures. J Nat Inst Agric Botany. 1984;16(3):387–395. [Google Scholar]
- 2.Hawk AL, Kaufmann HH, Watson CA. Reflectance characteristics of various grain. Cereal Sci Today. 1970;15(11):381–384. [Google Scholar]
- 3.Huang XY, Li J, Jiang S. Study on identification of rice varieties using computer vision. Journal of Jiangsu University (Natural Science Edition) 2004;25(2):102–104. (in Chinese) [Google Scholar]
- 4.Keefe PD. A dedicated wheat grading system. Plant Varieties & Seeds. 1992;5:27–33. [Google Scholar]
- 5.Lai FS, Zayas I, Pomeranz Y. Application of pattern recognition techniques in the analysis of cereal grains. Cereal Chemistry. 1986;63(2):168–174. [Google Scholar]
- 6.Luo X, Jayas DS, Symons SJ. Identification of damaged kernels in wheat using a color machine vision. Journal of Cereal Science. 1999;30(1):45–59. doi: 10.1006/jcrs.1998.0240. [DOI] [Google Scholar]
- 7.Majumdar S, Jayas DS. Classification of cereal grains using machine vision. IV. Combined morphology, color and texture models. Trans ASAE. 2000;43(6):1689–1694. [Google Scholar]
- 8.Majumdar S, Jayas DS, Hehn JL, Bulley NR. Classification of various grains using optical properties. Canadian Agric Eng. 1996;38(2):139–144. [Google Scholar]
- 9.Myers DG, Edsall KJ. The application of image processing techniques to the identification of Australian wheat varieties. Plant Var & Seeds. 1989;2(2):109–116. [Google Scholar]
- 10.Neuman M, Sapirstein HD, Shwedyk E, Bushuk W. Discrimination of wheat class and variety by digital image analysis of whole grain samples. J Cereal Sci. 1987;6:125–132. [Google Scholar]
- 11.Neuman M, Sapirstein HD, Shwedyk E, Bushuk W. Wheat grain color analysis by digital image processing: I. Methodology. J Cereal Sci. 1989;10:175–182. [Google Scholar]
- 12.Neuman M, Sapirstein HD, Shwedyk E, Bushuk W. Wheat grain color analysis by digital image processing: II. Wheat class determination. J Cereal Sci. 1989;10:183–192. [Google Scholar]
- 13.Sapirstein HD, Neuman M, Wright EH, Shwedyk E, Bushuk W. An instrumental system for cereal grain classification using digital image analysis. J Cereal Sci. 1987;6(1):3–14. [Google Scholar]
- 14.Symons SJ, Fulcher RG. Determination of wheat kernel morphological variation by digital image analysis. I. Variation in Eastern Canadian milling quality wheats. J Cereal Sci. 1988;8(3):211–218. [Google Scholar]
- 15.Symons SJ, Fulcher RG. Determination of wheat kernel morphological variation by digital image analysis. II. Variation in cultivars of soft white winter wheats. J Cereal Sci. 1988;8(3):219–229. [Google Scholar]
- 16.Travis AJ, Draper SR. A computer based system for the recognition of seed shape. Seed Sci & Technol. 1985;13:813–820. [Google Scholar]
- 17.Zayas I, Lai FS, Pomeranz Y. Discrimination between wheat classes and varieties by image analysis. Cereal Chemistry. 1986;63(1):52–56. [Google Scholar]
- 18.Zhang YJ. Image Processing and Analysis. Beijing, China: Tsinghua University Press; 1999. p. 20. (in Chinese) [Google Scholar]


