Abstract
Rapid detection of single-base changes is fundamental to molecular medicine. PASA (PCR amplification of specific alleles) is a rapid method of genotyping single-base changes, but one reaction is required for each allele. Bidirectional PASA (Bi-PASA) was developed to distinguish between homozygotes and heterozygotes in one PCR reaction by utilizing novel primer design with appropriate cycling conditions. In Bi-PASA, one of the alleles is amplified by a PASA reaction in one direction while the second allele is amplified by a PASA reaction in the opposite direction. Two outer (P and Q) and two inner allele-specific (A and B) primers are required. In heterozygotes, three segments are amplified: a segment of size AQ resulting from one allele, another segment of size PB resulting from the second allele, and a combined segment of size PQ. In homozygotes, segment PQ and either segments AQ or PB amplify. The two inner primers (A and B) contain a relatively short complementary region and a 10-nucleotide G+C-rich 5′ tail. The inner primers “switch” from low-efficiency to high-efficiency amplification when genomic DNA is replaced by previously amplified template DNA. In addition, the 5′ tails prevent “megapriming”. The parameters for optimizing Bi-PASA were investigated in detail for common mutations in the human factor V and catechol–O-methyltransferase genes. Guidelines for optimization of Bi-PASA also were developed and tested in a prospective study. Three additional Bi-PASA assays were optimized rapidly by utilizing these guidelines. In conclusion, Bi-PASA is a simple and rapid method for detecting the zygosity of known mutations in a single PCR reaction.
PCR is a method that typically utilizes two oligonucleotide primers to amplify a DNA segment >1 million-fold. PCR can be adapted for the rapid detection of single-base changes in genomic DNA by using specifically designed oligonucleotides in a method called PCR amplification of specific alleles (PASA) (Sommer et al. 1989; Sarkar et al. 1990). This rapid method is also known as allele-specific amplification (ASA), allele-specific PCR, and amplification refractory mutation system (ARMS) (Newton et al. 1989; Nichols et al. 1989; Wu et al. 1989). For this technique, an oligonucleotide primer is designed to match one allele perfectly but mismatch the other allele at or near the 3′ end, thereby preferentially amplifying one allele over the other. PASA assays can be developed for assaying virtually all alleles (Sommer et al. 1992). However, each PASA reaction provides information on the presence or absence of only one allele. Two PASA reactions must be performed to determine the zygosity of any sequence change.
To detect zygosity in one PCR reaction, PCR amplification of multiple specific alleles (PAMSA) utilizes three primers in one reaction to generate two allele-specific segments that differ sufficiently in size to be distinguished by agarose gel electrophoresis (Dutton and Sommer 1991). However, problems arise from PAMSA because of differences in length, and hence, amplification efficiency of the allele-specific primers. A similar approach, termed competitive oligonucleotide primary (COP)-utilized primers that mismatched the undesired allele within the middle rather than the end of the oligonucleotide (Gibbs et al. 1989; Ruano and Kidd 1989).
Tetra-primer PCR is a method by which two allele-specific amplifications occur in opposite directions (Ye et al. 1992). Tetra-primer PCR and Bi-PASA both rely on allele-specific PCR to amplify two alleles simultaneously and in opposite directions. However, the methods differ in the following ways. (1) In tetra-primer PCR, the allele specificity of the inner primers derive from mismatches in the middle of two complementary primers, whereas, in Bi-PASA, the mismatches are at (or near) the 3′ end of the primers. (2) The inner primers in Bi-PASA have short complementary segments and G+C-rich tails to efficiently switch from template-based amplification to self-amplification and to prevent megapriming. (3) Tetra-primer PCR utilizes two annealing conditions of high and low stringency, whereas Bi-PASA utilizes a constant annealing temperature. (4) The inner primers used in tetra-primer PCR are concentrated 35-fold more than the outer primers, whereas in Bi-PASA the primers are of similar concentration.
Bi-PASA is shown to be robust and versatile. Single-base changes in the human catechol–O-methyltransferase gene (COMT) (63% G+C content) and the human procoagulant factor V gene (FV) (40% G+C content) were used as model systems to determine the parameters important for optimizing the multiple interactions between the four primers. Guidelines for primer design and reaction conditions were derived from these experiments and subsequently tested in a prospective study (see Fig. 1A and the last three sections of Results and Discussion for an abbreviated, practical overview of the method).
Figure 1.
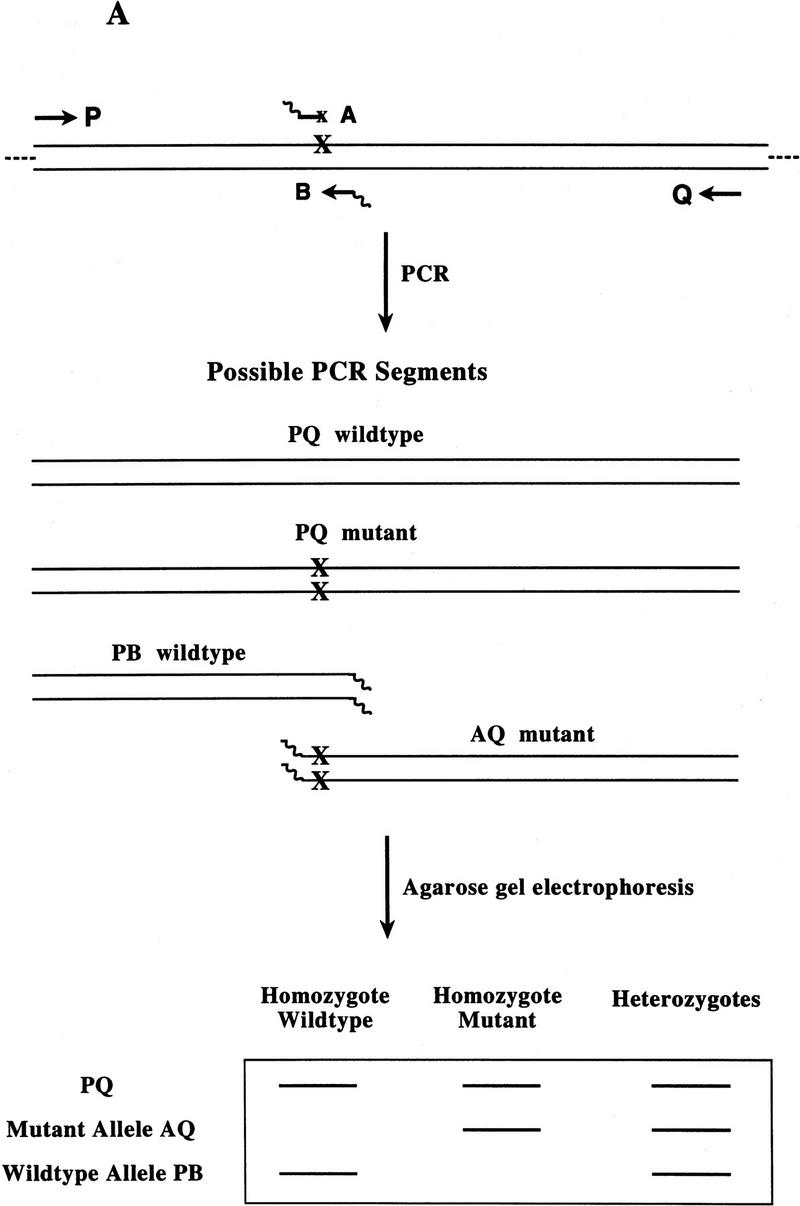
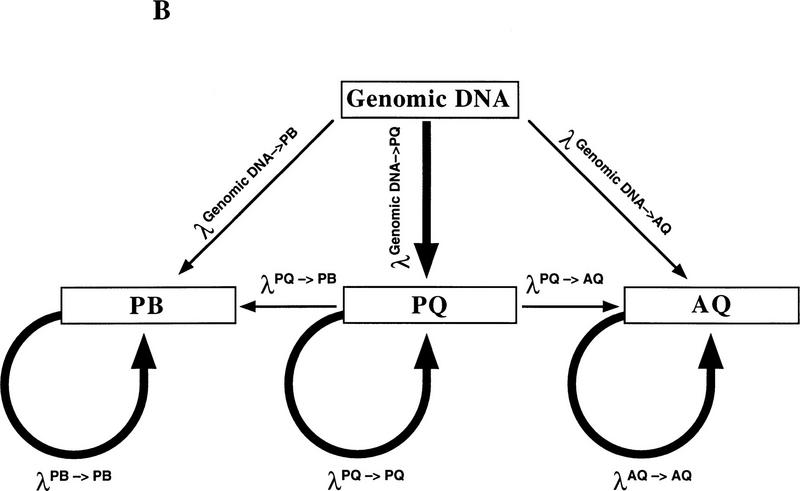
(A) Schematic of Bi-PASA. The four primers (P, Q, A, and B) are represented by arrows. X represents the sequence change relative to the other allele. Wavy lines on the inner primers represent the noncomplementary 5′ tail sequences. (B) Network structure of Bi-PASA. The four boxes represent the template used in the reaction. Arrows indicate the segments that can be produced from each template. The thickness of the arrows approximates the efficiency of amplification. The Bi-PASA reaction can be divided into two parts: template transfer amplification (genomic DNA → PQ, PB, and AQ; PQ → PB and AQ) and self-amplification (PQ → PQ, PB → PB, and AQ → AQ). The amplification efficiency, λ, for a particular segment from a given template is defined as the molecular ratio from cycle n to cycle n + 1. [PQ]n + 1, [PB]n + 1 and [AQ]n + 1 are the PCR product yields of PQ, PB, and AQ, respectively, at the end of the n + 1 cycle. [Genomic DNA] represents the yield of genomic DNA. The accumulation of PQ, PB, and AQ DNA products can be indicated as follows: [PQ]n + 1 = [PQ]n × (1 + λnPQ → PQ) + [genomic DNA] × λngenomic DNA → PQ; [PB]n + 1 = [PB]n × (1 + λnPB → PB) + ½ × [genomic DNA] × λngenomic DNA → PB + ½ × [PQ] × λnPQ → PB; and [AQ]n + 1 = [AQ]n × (1 + λnAQ → AQ) + ½ × [genomic DNA] × λngenomic DNA → AQ + ½ × [PQ] × λnPQ → AQ.
RESULTS AND DISCUSSION
Principle of Bi-PASA
For Bi-PASA, PCR is performed with four primers: two outer primers, P and Q; and two allele-specific inner primers, A and B (Fig. 1A). P and Q should anneal at different distances from the sequence change to differentiate the downstream and upstream PASA assays on an agarose gel. A and B are each specific to an allele with the mismatch at (or near) the 3′ end of the primer. A and B primers consist of two parts: a short region that is complementary to one of the alleles and a 5′ noncomplementary tail. The tail sequence consists of 10 bp of high G+C content and serves two purposes: (1) The tail acts as a “switch” from inefficient amplification of genomic DNA to efficient amplification of previously amplified template DNA; and (2) the tail prevents “megapriming”, which occurs when a segment (PB or AQ) generated by PCR in an earlier cycle acts as a primer for a larger template (i.e., genomic DNA or PQ) in a subsequent cycle (Sarkar and Sommer 1990, 1992).
Depending on the zygosity, Bi-PASA produces two or three overlapping segments. PQ is always produced and serves as a positive control. PB and AQ are both present in a heterozygote (WT/M), but only PB is produced in homozygous wild-type (WT/WT) and only AQ is produced in homozygous mutant (M/M) samples.
Network Structure of Amplification Process
Figure 1B depicts the network structure of Bi-PASA amplification for heterozygotes. Two types of amplification occur during Bi-PASA “template transfer amplification” and “self amplification.” Template transfer amplification occurs when a larger template is used to produce a smaller product (genomic DNA → PQ, PB, and AQ; PQ → PB and AQ). Self-amplification occurs when a template is used to reproduce itself (PQ → PQ, PB → PB, and AQ → AQ). The amplification conditions are designed to favor self-amplification, as represented by the thickness of the arrows (see legend to Fig. 1B for further theoretical considerations). The efficiency may be influenced by the cycle number and by the zygosity of the sample.
Because of the relatively short complementary region of the A and B primers that compromises efficient annealing at the annealing temperature used, the PQ template transfer amplification occurs at high efficiency compared to the efficiency of PB or AQ transfer reactions during the first few cycles of Bi-PASA. However, as the reaction progresses, PB and AQ are produced at higher efficiency because of self amplification. Self amplification occurs at high efficiency because both the complementary and the 10 bp tail regions are incorporated into the products providing a much longer region of complementarity.
Kinetics of Bi-PASA
To quantitate the accumulation of each segment during a Bi-PASA reaction, identical radioactive Bi-PASA reactions were removed from the thermocycler every three cycles and each segment was quantified by a PhosphorImager after agarose gel electrophoresis (Fig. 2). During cycles 18–30, PQ, PB, and AQ accumulated at remarkably similar rates, although the efficiency of accumulation for PB and AQ is somewhat greater in later cycles. In the samples from homozygous wild type or mutants (WT/WT, M/M), individual yields were up to twofold greater in comparison to the heterozygote samples, suggesting that there are interactions among either the three segments or primers that inhibit efficiency in the WT/M sample. Thus, the type of genomic template used in the reaction may influence the efficiency of accumulation and the final amount of product produced.
Figure 2.
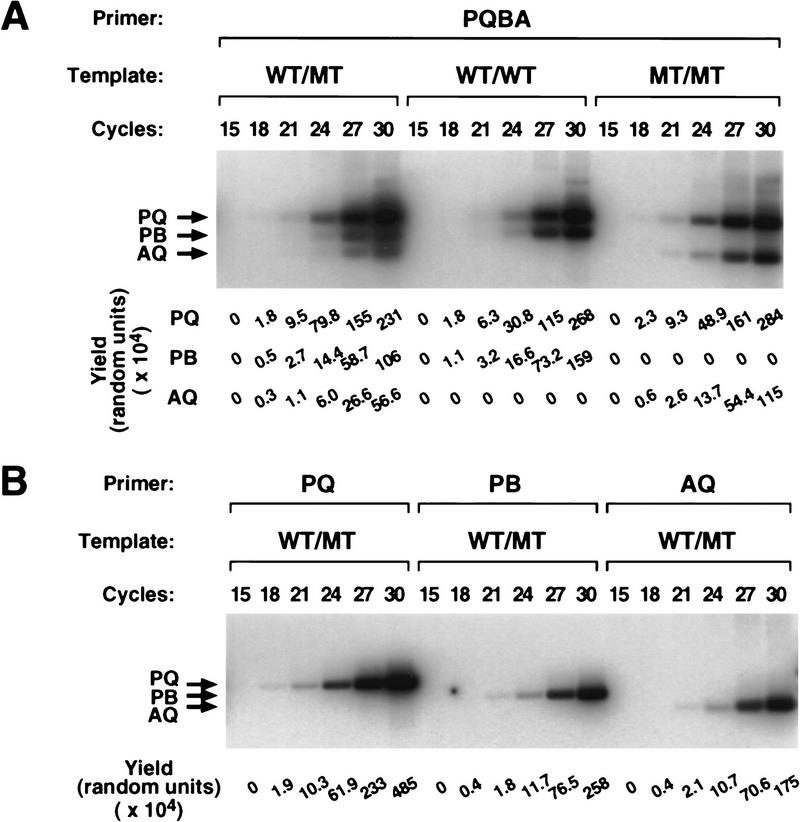
Kinetics of Bi-PASA. Identical [α-32P]dATP-labeled Bi-PASA reactions were removed from the thermocycler every three cycles, and the yield for each segment was quantified with a PhosphorImager. Potentially, 135, 87, and 214 adenine nucleotides can be labeled by [α-32P]dATP in the PB, AQ, and PQ segments, respectively. (A) All four primers were used for WT/M, WT/WT, and M/M samples. The yields for potential segments were greater in the WT/WT and M/M samples, indicating that the type of genomic template used can affect the yields. (B) The three two-primer combinations for the WT/M sample were performed. A greater yield was observed for the three segments individually as compared to the WT/M sample in A, indicating that interactions among the primers can influence the yield in a Bi-PASA reaction.
For comparison, the three possible two-primer PCR amplifications were performed on the heterozygote samples. Yields of up to twofold greater were observed for each of the segments as compared to Bi-PASA with four primers. This demonstrates that interactions among primers can influence the yield in Bi-PASA.
Parameters Affecting Bi-PASA
The parameters important for optimizing Bi-PASA were investigated in detail for common sequence changes in the human procoagulant FV and COMT genes. A G → A transition at base pair 266 in exon 10 of the FV gene (GenBank accession no. L32764.Gb_Pr) is a mutation associated with venous thromboembolism. The polymorphism in the COMT gene is a G → A transition at base pair 1947 in exon 4 (GenBank accession no. 226491.Gb_Pr). These genes were chosen partly on the basis of the large differences in G+C content (FV, 40% G+C; COMT, 63% G+C).
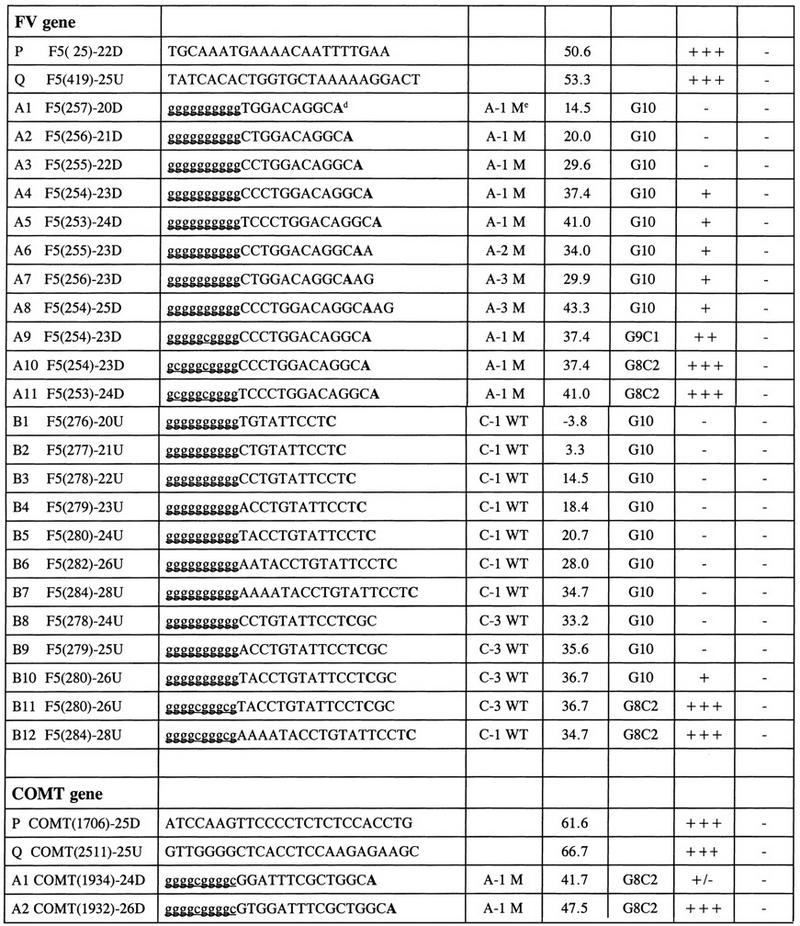
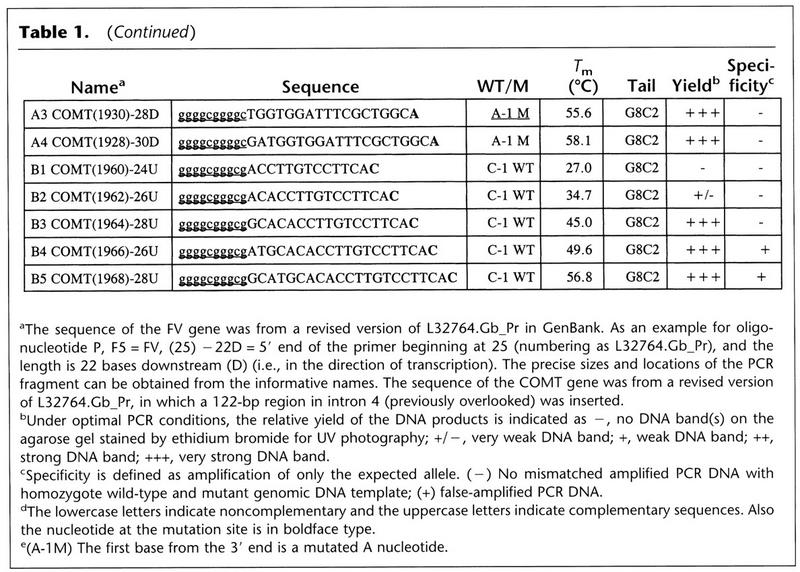
Table 1 lists primers designed to examine differences in mismatch position, Tm, of the complementary region and tail composition. In the FV gene, the position of the 3′ mismatch at the −1, −2, or −3 positions did not have a noticeable effect on primer efficiency for the A primers (compare yields using A4, A6, and A7).
Table 1.
Selected Primers for the Initial Optimization of FV and COMT Genes
The sequence of the FV gene was from a revised version of L32764.Gb_Pr in GenBank. As an example for oligonucleotide P, F5 = FV, (25) −22D = 5′ end of the primer beginning at 25 (numbering as L32764.Gb_Pr), and the length is 22 bases downstream (D) (i.e., in the direction of transcription). The precise sizes and locations of the PCR fragment can be obtained from the informative names. The sequence of the COMT gene was from a revised version of L32764.Gb_Pr, in which a 122-bp region in intron 4 (previously overlooked) was inserted.
Under optimal PCR conditions, the relative yield of the DNA products is indicated as −, no DNA band(s) on the agarose gel stained by ethidium bromide for UV photography; +/−, very weak DNA band; +, weak DNA band; ++, strong DNA band; +++, very strong DNA band.
Specificity is defined as amplification of only the expected allele. (−) No mismatched amplified PCR DNA with homozygote wild-type and mutant genomic DNA template; (+) false-amplified PCR DNA.
The lowercase letters indicate noncomplementary and the uppercase letters indicate complementary sequences. Also the nucleotide at the mutation site is in boldface type.
(A-1M) The first base from the 3′ end is a mutated A nucleotide.
The Tm and tail composition were both important factors in designing the inner primers. Primers in both the FV and COMT genes were much more efficient at higher Tm (see Table 1 for details). The tail sequence was an important factor in primer design. Several of those with a tail of G10 were capable of priming amplification. However, primers with G9C1 or C8C2 tails were much more efficient in the Bi-PASA reactions (e.g., FV primers A8–A10 and B10 and B11).
Interactions Among Primers
Figure 3 illustrates Bi-PASA reactions for the COMT and FV genes. Various combinations of the primers listed in Table 1 were used to identify the optimal set of inner primers and reaction conditions for these genes (the optimal primers and conditions can be found in the legend to Fig. 3). To visualize the interactions among the primers in Bi-PASA, reactions were performed with different sets of the four optimal primers on the three genomic templates. Figure 3A shows the Bi-PASA reaction for the COMT gene. Interactions among the primers affect both the yield and the specificity of the reactions. In general, the greater the number of primers added to the reaction, the lower the yield is of the individual segments (cf. lanes 2, 4, and 6). The specificity of the inner primers to a particular allele can also be affected because of the competition between the primers. Lane 8 shows a faint false-positive signal for the nonspecific allele for the two-primer combination. However, the nonspecificity disappears when more primers are added to the reaction as in lanes 10 and 12. Figure 3B shows the Bi-PASA reaction for the FV gene. Specificity was not a problem, but again the yield was affected by the number of primers in the reaction.
Figure 3.
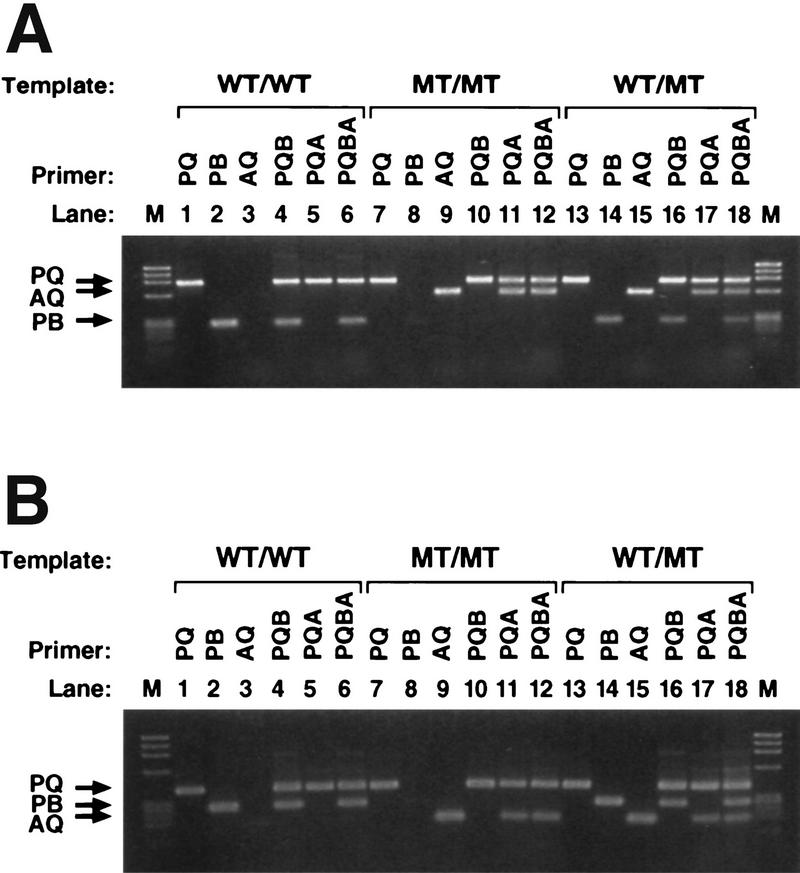
Bi-PASA reactions for the COMT and FV genes: Interactions among the primers. Two-, three-, and four-primer combinations for the WT/WT (lanes 1–6), M/M (lanes 7–12), and WT/M (lanes 13–18) templates were amplified to observe the efficiency of the primers. (M) Size standard (120 ng of φX174/HaeIII). (A) COMT gene Bi-PASA reaction. The inner primers used were A2 and B3 (see Table 1 for primer specifications). The primer concentrations were 0.05 μm for P, Q, and B, and 0.1 μm for A. The annealing temperature was 65°C, and 5% DMSO was added to the reaction. (B) FV Bi-PASA reaction. The inner primers used were A11 and B11 (see Table 1). The primer concentrations were 0.1 μm for P, B, and A, and 0.05 μm for Q. The annealing temperature was 55°C.
Primer concentrations were optimized for the COMT and FV Bi-PASA reactions. The outer and inner primer concentrations were adjusted to the minimum optimal point at which the wild-type and mutant alleles could be amplified specifically and efficiently (see Fig. 3). Figure 4 shows the effects on the FV Bi-PASA reaction when the concentrations of each individual primer and then all four primers were varied. A change in the concentration of a primer can affect all of the segments produced in the reaction, for example, Figure 4, lanes 1–6, demonstrates that when the concentration of the P primer is varied, not only do the yields of the PQ and PB segments vary (which would be expected) but the AQ segment is also affected. This demonstrates again that interactions among the primers are an important factor in a Bi-PASA reaction.
Figure 4.

The effects of primer concentrations for the FV Bi-PASA reaction. WT/M genomic DNA was used for all reactions. Lanes 1–6, 7–12, 13–18, and 19–24 show the effects of varying only the P, Q, B11, and A11 primers, respectively. Lanes 25–30 show the effects of varying all four primers at once. The primers used and the 1× concentrations were determined by the optimal conditions used in Fig. 3B. (M) Size standard (120 ng of φX174/HaeIII).
Blinded Analysis
To test the sensitivity and specificity of Bi-PASA under actual screening conditions, a blinded analysis of the COMT gene was performed. For the common COMT polymorphism, 249 samples were screened independently by RFLP analysis and Bi-PASA. The sensitivity and specificity were 100% and 99.6%, respectively; the one false-positive result was attributable to contamination by the neighboring well of a gel.
The sensitivity of Bi-PASA was also tested by diluting the mutant allele into the wild-type allele. Detection of the mutant allele by staining with ethidium bromide was possible with a 20- to 40-fold excess of the wild-type allele (data not shown).
Guidelines for Primer Design
Reactions were designed successfully to detect sequence changes in the FV and COMT genes. For Bi-PASA to be a useful tool, optimization needs to be relatively rapid and simple. On the basis of experience gained by analysis of multiple primers and optimization parameters, guidelines for primer design and a strategy for reaction optimization were developed. Although subsequent experiments support the utility of the guidelines and strategy, the following guidelines will likely evolve with time. Designing the primers is a critical step in a successful Bi-PASA reaction. The Tm value of each PCR segment was estimated by the formula of Wetmur (1991): Tmproduct = 81.5 + 16.6 log[K+] + 0.41(%G + %C) − 675/length.
1. The Tm values of P and Q (outer primers) should be 20–25°C lower than that of the PQ segment. A good size for the PQ segment is 300–1000 bp. For the COMT gene, the Tm value of the PQ PCR product was 83.8°C. For the FV gene, the Tm value of the PQ PCR product was 74.8°C. The Tm values of successful P and Q primers were 61.6°C and 66.7°C for COMT gene, and 50.6°C and 53.3°C for FV gene, respectively. When P and Q were designed with a lower Tm value, the interactions among the four primers were more pronounced, especially for regions of high G+C content (data not shown).
2. The Tm values of the complementary region of inner primers A and B should be ∼35°C lower than that of the PQ segment. Parameters were optimized in the COMT and FV genes by systematically increasing the length of the complementary regions of the inner primers. It was observed that once the Tm value of the inner primers reached a certain point below the Tm of the PQ PCR products, the inner primers began to work with high yield and specificity (see Table 1). For the COMT gene, this “threshold” Tm value was 47.5°C in A2 and 45.0°C in B3, which were 36.3°C and 38.8°C below the Tm value of the PQ PCR DNA product, respectively. Beyond that point, Tm was 55.6°C in A3, 58.1°C in A4, 49.6°C in B4, and 56.8°C in B5, all having produced high-yield AQ and PB segments, respectively. However, B4 and B5 also amplified a faint false-positive segment when M/M genomic DNA was used, indicating that as primer length increases, some specificity may be sacrificed. In the FV gene, the threshold Tm was 37.4°C for A4 and 34.7°C for B7, which is 37.4°C and 40.1°C below the Tm of the PQ segment, respectively. The A and B inner primers with Tm values above this point also amplified with high yield and specificity (see Table 1).
3. The annealing temperature should be 20°C below the Tm value of the PQ segment in these studies. The optimal annealing temperature also was closely linked to the Tm value of the PQ PCR products. The annealing temperature was set relatively high to avoid hybridization among the multiple PCR segments. For the analyzed regions, the recommended annealing temperatures happen to be within 2°C of the annealing temperatures estimated by the formula of Rychlik et al. (1990), Tm annealing = 0.3 × TmP or Q primer + 0.7 × TmPQ product − 14.9.
In the COMT gene, good results could be achieved only within a narrow range of annealing temperatures. When the annealing temperature was set at 55°C or 60°C, the yield and specificity were poor in comparison to the recommended temperature of 65°C. However, good results were achieved for the FV gene with annealing temperatures ranging from 50°C–60°C (data not shown).
Strategy of Optimation of Bi-PASA
1. Design the primers based on the above guidelines.
2. Alter the concentrations of P and Q. This seems to have more effect on the yields of all the segments than altering the concentration of the inner primers A and B. Optimize the PQ segment by titrating oligonucleotide concentrations. Use the lowest concentration of primer necessary to obtain a high yield. For regions of high G+C content, DMSO may be used.
3. Determine the range of oligonucleotide concentrations with robust amplification that are compatible with primers P and B and perform a similar analysis with primers A and Q. Then adjust the concentrations of the inner primers such that appropriate amplifications with three primers (PQB and PQA) or four primers (PQBA) occur (see Figs. 3 and 5). If it is not possible to achieve acceptable yield but the specificity is good, increase the length of the complementary regions of the inner primers and reoptimize. If specificity is not optimal, decrease the length of the inner primers or alter the position of the mismatch by 1 bp or more. This should be performed for WT/WT, WT/M, and M/M samples.
Figure 5.

Prospective study. Optimized Bi-PASA reactions for single-base changes in the factor IX, FV-opp, and D1 genes. (M) Size standard (120 ng of φX174/HaeIII). (A) Optimation of the FIX gene Bi-PASA. Bi-PASA reactions shown were performed with a WT/M sample. PQ segment Tm = 73.6°C. The annealing temperature was set at 55°C. (Lanes 1–4 PCR with each P and Q primer at 0.1, 0.05, 0.025, and 0.0125 μm concentrations. Lane 2 was designated as the minimum optimal concentration for the PQ segment. (Lanes 5–10) Control reactions with P and Q primers at 0.05 μm concentrations and A and B primers at 0.1 μm concentrations. (Lanes 11–16) Final Bi-PASA reaction for the FIX gene after adjustment of the A primer concentration to 0.05 μm. (B) Bi-PASA reaction of FV-opp and D1 genes. In the initial experiments using the FV gene, the WT and M allele-specific primers were in the upstream and downstream directions, respectively. As a test of the robustness of the Bi-PASA reaction, new primers were designed such that the WT and M allele-specific primers were in the downstream and upstream directions, respectively. WT/WT, M/M, and WT/M templates were used for optimized Bi-PASA reactions for the FV-opp and D1 genes. The Tm values of the PQ segments of the FV-opp and D1 genes were 74.8°C and 81.4°C, respectively, and the annealing temperatures were 55°C and 60°C, respectively. Final primer concentrations for the FV-opp Bi-PASA reaction were 0.1 μm for the P primer, 0.05 μm for the Q primer, 0.1 μm for the B primer, and 0.1 μm for the A primer. Final primer concentrations for the D1 Bi-PASA reaction were 0.1 μm for the P primer, 0.1 μm for the Q primer, 0.1 μm for the B primer, and 0.1 μm for the A primer. (M) Size standard (120 ng of φX174/HaeIII). (Lanes 1–4) Bi-PASA reaction for FV-opp; (lanes 5–8) bi-PASA for D1.
4. Once the above conditions have been satisfied, check the sensitivity and specificity of the reaction. Dilute the DNA samples to determine the minimum amount of template necessary to perform the reaction. Dilute the M sample into the WT sample and vice versa to determine the maximum ratio of WT to M that can be detected.
Prospective Test of the Guidelines and Strategy
To test the utility of the guidelines and strategy, three Bi-PASA reactions were designed (Table 2) and tested for (1) the TaqI polymorphism in the factor IX gene, (2) the FV Leiden mutation assayed in a direction opposite to that performed initially, and, (3) a polymorphism in the D1 dopamine receptor genes, respectively. All the reactions were successful and rapidly optimized by utilizing the above primer guidelines and optimization strategy (Fig. 5).
Table 2.
List of Primers in the Prospective Study
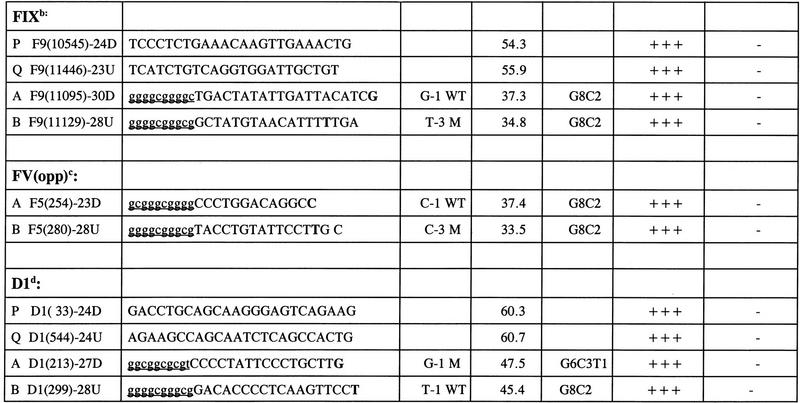 |
See Table 1 footnote for details on primer sequence, etc.
The sequence of the FIX gene was numbered on the basis of Yoshitake et al. (1985).
The P and Q primers for FV (opp) were the same as used in FV (see Table 1).
The sequence of the D1 gene was submitted to GenBank under accession no. X55760.Gb_Pr.
In conclusion, Bi-PASA is an efficient method for detecting known single-base changes. This technique could also be used to detect small deletions and insertions. It is particularly useful for determining the zygosity of common sequence changes in which heterozygotes are likely to be common. Bi-PASA can be used to perform population screening, haplotype analysis, patient screening, and carrier testing. It is rapid, reproducible, inexpensive, nonisotopic, and amenable to automation.
METHODS
All primers were designed and analyzed with Oligo 4 software (National Biosciences, Inc). Oligo 4 calculates the melting temperature values of a primer by the nearest neighbor method at 50 mm KCl and 250 pm DNA. PCR was performed from human genomic DNA isolated from white blood cells. The PCR mixtures contained a total volume of 25 μl: 50 mm KCl, 10 mm Tris-HCl (pH 8.3), 1.5 mm MgCl2, 200 μm of each dNTP, 0.5 units of Taq DNA polymerase (Boehringer Mannheim), and 100 ng of genomic DNA. The effects of the annealing temperature were explored extensively during the course of the study. Cycling conditions were otherwise constant. The recommended annealing temperature is ~20°C below the Tm of segment PQ (see guidelines). Additional PCR cycling conditions were denaturation at 95°C for 15 sec, annealing for 30 sec, a 1-min ramp time from the annealing temperature to the elongation temperature, and elongation at 72°C for 2 min. An additional 15 sec of denaturation time was always supplemented during the first cycle of the reaction. Thirty cycles were performed on a Perkin Elmer GeneAmp PCR system 9600. Standard agarose gel electrophoresis with ethidium bromide staining and UV photography with Polaroid 667 film was used to visualize all PCR segments.
To quantitate PCR yield, PCR was performed with 5 μCi of [α-32P]dATP per 25-μl reaction (3000 Ci/mmole, Amersham). The reaction was electrophoresed through an agarose gel, dried, and subjected to autoradiography. The PCR yield was quantitated with a PhosphorImager with ImageQuant software (Molecular Dynamics) after a 20-min exposure. The relative PCR yields were quantitated as “random units”, that is, the number of pixels in the PCR band minus the background, indicated as a random unit.
(For further information, see Guidelines for Primer Design and Strategy of Optimizing Bi-PASA, above.)
Acknowledgments
We thank William H. Kane, at Duke University, for kindly providing additional DNA sequence of the human FV gene, and James E. Perry for his help in the quantitation analysis.
The publication costs of this article were defrayed in part by payment of page charges. This article must therefore be hereby marked “advertisement” in accordance with 18 USC section 1734 solely to indicate this fact.
Footnotes
E-MAIL ssommer@smtplink.coh.org; FAX (818) 301-8142.
REFERENCES
- Dutton C, Sommer SS. Simultaneous detection of multiple single-base alleles at a polymorphic site. BioTechniques. 1991;11:700–702. [PubMed] [Google Scholar]
- Gibbs RA, Nguyen P, Caskey CT. Detection of single DNA base differences by competitive oligonucleotide priming. Nucleic Acids Res. 1989;17:2437–2448. doi: 10.1093/nar/17.7.2437. [DOI] [PMC free article] [PubMed] [Google Scholar]
- Newton CR, Graham A, Heptinstall LE, Powell SJ, Summers C, Kalsheker N, Smith JG, Markham AF. Analysis of any point mutation in DNA. The amplification refractory mutation system (ARMS) Nucleic Acids Res. 1989;17:2503–2516. doi: 10.1093/nar/17.7.2503. [DOI] [PMC free article] [PubMed] [Google Scholar]
- Nichols WC, Liepnieks JJ, McKusick VA, Benson MD. Direct sequencing of the gene for Maryland/German familial amyloidotic polyneuropathy type II and genotyping by allele-specific enzymatic amplification. Genomics. 1989;5:535–540. doi: 10.1016/0888-7543(89)90020-7. [DOI] [PubMed] [Google Scholar]
- Ruano G, Kidd KK. Direct haplotyping of chromosomal segments from multiple heterozygotes via allele-specific PCR amplification. Nucleic Acids Res. 1989;17:8392. doi: 10.1093/nar/17.20.8392. [DOI] [PMC free article] [PubMed] [Google Scholar]
- Rychlik W, Spencer WJ, Rhoads RE. Optimization of the annealing temperature for DNA amplification in vitro. Nucleic Acids Res. 1990;18:6409–6412. doi: 10.1093/nar/18.21.6409. [DOI] [PMC free article] [PubMed] [Google Scholar]
- Sarkar G, Sommer SS. The “megaprimer” method of site-directed mutagenesis. BioTechniques. 1990;8:404–407. [PubMed] [Google Scholar]
- ————— Double-stranded DNA segments can efficiently prime the amplification of human genomic DNA. Nucleic Acids Res. 1992;20:4937–4938. doi: 10.1093/nar/20.18.4937. [DOI] [PMC free article] [PubMed] [Google Scholar]
- Sarkar G, Cassady J, Bottema CDK, Sommer SS. Charaterization of polymerase chain reaction amplification of specific alleles. Anal Biochem. 1990;186:64–68. doi: 10.1016/0003-2697(90)90573-r. [DOI] [PubMed] [Google Scholar]
- Sommer SS, Cassady JD, Sobell JL, Bottema CDK. A novel method for detecting point mutations or polymorphisms and its application to population screening for carriers of phenylketonuria. Mayo Clin Proc. 1989;64:1361–1372. doi: 10.1016/s0025-6196(12)65378-6. [DOI] [PubMed] [Google Scholar]
- Sommer SS, Groszbach AR, Bottema CDK. PCR amplification of specific alleles (PASA) is a general method for rapidly detecting known single-base changes. BioTechniques. 1992;12:82–87. [PubMed] [Google Scholar]
- Wetmur JG. DNA Probes: Applications of the principles of nucleic acid hybridization. Crit Rev Biochem Mol Biol. 1991;26:227–259. doi: 10.3109/10409239109114069. [DOI] [PubMed] [Google Scholar]
- Wu DY, Ugozzoli L, Pal BK, Wallace RB. Allele-specific enzymatic amplification of β-globin genomic DNA for diagnosis of sickle cell anemia. Proc Natl Acad Sci. 1989;86:2757–2760. doi: 10.1073/pnas.86.8.2757. [DOI] [PMC free article] [PubMed] [Google Scholar]
- Ye S, Humphries S, Green F. Allele specific amplification by tetra-primer PCR. Nucleic Acids Res. 1992;20:1152. doi: 10.1093/nar/20.5.1152. [DOI] [PMC free article] [PubMed] [Google Scholar]
- Yositake S, Schach BG, Foster DC, Davie EW, Kuarchi K. Nucleotide sequence of the gene for human factor IX (anti-hemophiliac factor B) Biochemistry. 1985;24:3736–3750. doi: 10.1021/bi00335a049. [DOI] [PubMed] [Google Scholar]


