BIOCHEMISTRY. For the article “Interaction of RNA polymerase with forked DNA: Evidence for two kinetically significant intermediates on the pathway to the final complex,” by Laura Tsujikawa, Oleg V. Tsodikov, and Pieter L. deHaseth, which appeared in number 6, March 19, 2002, of Proc. Natl. Acad. Sci. USA (99, 3493–3498; First Published March 12, 2002; 10.1073/pnas.062487299), the authors note the following concerning RNA polymerase (RNAP) concentrations. No correction was made for the fraction of RNAP (0.5) that is active in promoter binding. With this correction, the values of K1 and Kapp (but not Kf) would increase by about a factor of 2. The relative values would remain essentially unchanged. Also, the legends to Figs. 2, 3, and 5 contain errors pertaining to the symbols used for data obtained with and without heparin challenge, the duration of the challenge, and the concentration of added heparin. The figures and the corrected legends appear below.
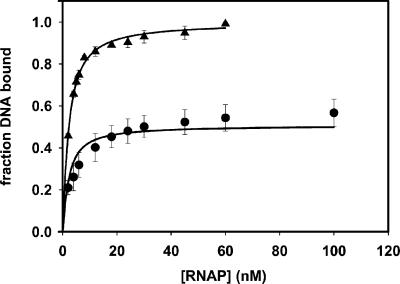
Fig 2.
Determination of equilibrium affinities by titration of wt Fork with RNAP. The reactions contained 1 nM wt Fork and variable amounts of RNAP as shown and were analyzed by electrophoretic mobility shift immediately (▴; data shown are averages of three independent experiments) or after a challenge with 100 μg/ml heparin for 10 min (•; data shown are averages of four independent experiments). The curves shown reflect the simultaneous error-weighted fits of the data to Eqs. 3 and 4–7. The parameters are shown in Table 1 (line 1).
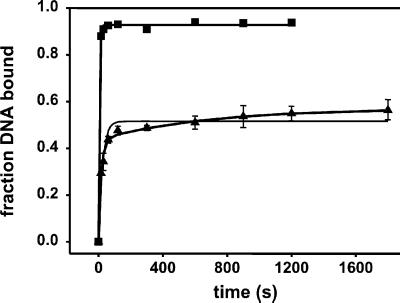
Fig 3.
Kinetics of complex formation. RNAP (65 nM) and wt forked DNA (1 nM) were incubated for various time intervals and then complex formation was determined immediately (−heparin) or after a 2-min challenge with 100 μg/ml heparin (+heparin). The −heparin data (▪) were fit (error-weighted) with Eq. 8 with a2 = 0 (ka− = 0.10 ± 0.01 s−1) and the +heparin data (▴) with both single (ka+ = 0.036 ± 0.004 s−1; thin line) and double-exponential (ka1 = 0.044 ± 0.002 s−1; ka2 = (5 ± 3) × 10−4 s−1; thick line) equations.
Fig 5.
Comparison of the kinetics for formation and dissociation of competitor-resistant complexes between RNAP and wt Fork. Association data were obtained as described in the text and the legend for Fig. 3 except the concentration of forked DNA was 10 nM. Dissociation kinetics were obtained by challenging with 100 μg/ml heparin a mixture of RNAP and forked DNA that had been incubated for 30 min. The curves represent double-exponential fits of the data to Eq. 10. (A) wt RNAP. The observed association rate constants (▪) are shown in the legend for Fig. 3; for the slow phase of the dissociation of the wt Fork–wt RNAP complex (•), kd2 = (1.3 ± 0.2) × 10−4 s−1. (B) YYW RNAP. The slow phase of the association reaction (•) has a ka2 = (1.1 ± 0.3) × 10−3 s−1; the slow phase of the dissociation reaction (▪), a kd2 = (6 ± 1) × 10−4 s−1.


