Abstract
Respiration rates of bacterial cultures can be a powerful tool in gauging the effects of genetic manipulation and environmental changes affecting overall metabolism. We present an optical method for measuring respiration rates using a robust phosphorescence lifetime-based sensor and off-the-shelf technology. This method was tested with the facultative methylotroph Methylobacterium extorquens AM1 to demonstrate subtle mutant phenotypes.
Respiration rates of an aerobic bacterial population can be used as a gauge of the metabolic state. For metabolic modes not involving primary oxygenases (e.g., methane monooxygenase) (9), changes in oxygen uptake reflect alterations in respiratory chain activity due to a phenotypic response or genetic manipulation (11). Given the tight coupling between energy metabolism and a cell's metabolic network (14), changes in respiration rates can reflect shifts in overall metabolism and how a specific metabolic state adapts to change (11).
A number of methods are available to detect oxygen concentrations, such as the use of Clark electrodes, electrochemical cells, electrochemical microscopy, and paramagnetic cells (7, 15). One of the most commonly performed techniques is the use of a Clark electrode. However, the caveats of this method are low sensitivities, signal drift, probe fragility, electrode consumption of oxygen, and the ability to only measure the immediate microenvironment (15, 17, 22). In addition, high-throughput analysis requires a number of individual devices, increasing the cost and decreasing reproducibility. One method that has seen a rapid increase in use recently is the application of optical sensors, such as phosphorescent dyes (4, 12), which impart greater signal-to-noise ratios, signal independence of the dye concentration and photobleaching, rapid response characteristics, and functionality while imbedded in a variety of materials (15, 23). Additionally, optical methods are amenable to high-throughput screening using high-density well formats (1), but existing systems tend to be custom designed and not broadly available.
Recently, commercially available polystyrene beads doped with a platinum(Pt)-porphyrin dye and inexpensive off-the-shelf components have become available for O2 measurements. We examined this system to demonstrate its utility in measuring respiration rates of Methylobacterium extorquens AM1 cultures. M. extorquens AM1 has the ability to grow on C1 substrates, e.g., methanol, as a sole source of carbon and energy and is an inexpensive renewable biofeedstock, which can reduce production costs of value-added products (5, 13). A broad range of biochemical and genetic tools along with a metabolic flux balance model has allowed a comprehensive mapping of central metabolism during C1 and multicarbon growth (19, 20).
In addition to the wild type, two mutant strains were analyzed. The first mutant (20) was null for NADH-ubiquinone oxidoreductase subunit B (NADH-UOR; NADH-UOR subunit B::Tetr), which couples NADH oxidation to the respiratory chain during multicarbon growth. The second mutant was null for PhaR (phaR::Kmr), which regulates carbon flux through acetyl-coenzyme A (acetyl-CoA) within the central metabolism (8).
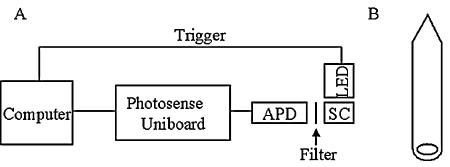
Cultures were grown aerobically in batches at 28°C using mineral salts medium supplemented with 50 μg/ml rifamycin (3) and either 0.3% methanol or 0.4% succinate (20). One-micrometer platinum luminescent Fluorspheres (Invitrogen, Carlsbad, CA) were used to monitor the O2 concentrations within cell solutions. Bead preparation entailed washing and resuspension of 50-μl aliquots of stock solution in 1 ml minimal medium. Modified VWR borosilicate culture tubes (13 mm × 100 mm) were used as sample cells because the inner diameter was approximately the same as that of a quartz cuvette and they could be flame sealed without heating the cell solution while minimizing the free air volume (Fig. 1B).
FIG. 1.
Lifetime detection apparatus. (A) Schematic of the detection system showing an LED set up at 90o to an APD while addressing the sample cell (SC). A standard-size cuvette holder held the sample cell with a magnetic stirrer underneath. (B) Schematic of a flame-sealed modified culture tube with a magnetic stir bar within the sample cell.
Microspheres were calibrated using a quartz cuvette and an unmodified culture tube. A 200-μl aliquot of prepared microspheres was diluted to 4 ml with minimal medium. A gas line and an O2 microelectrode from Microelectrodes, Inc. (model 16-730; Bedford, NH) were inserted, and O2 containing 5% CO2 and a nitrogen balance were bubbled in. Phosphorescence lifetimes were collected, with the oxygen concentrations verified with the microelectrode at 28°C. For the measurement of respiration rates, 200-μl aliquots of prepared microspheres were diluted to up to 4 ml with cultures with optical densities at 600 nm (OD600) of 0.15 to 0.19, injected into the modified tubes, and flame sealed, causing the sample cells to be airtight. Measurements were conducted at 28°C with stirring. The detection apparatus consisted of a 395-nm LED set up at 90° to an avalanche photodiode (APD; Hamamatsu Photonics, Bridgewater, NJ) (Fig. 1B) with a 600-nm long-pass emission filter. The LED and APD were connected to a PhotoSense Uniboard (Boulder, CO). The PhotoSense software calculated lifetimes via log ratios of two points during phosphorescence decays ranging from 15 to 60 μs.
Oxygen concentrations were calculated from the Stern-Volmer equation, T0/T = 1 + KQT0[O2] (T0 = lifetime at 0% oxygen, T = lifetime at [oxygen], and KQ = the Stern-Volmer constant [22]), and the atomic oxygen concentration in water of 489.7 μM O at 28°C (16). Oxygen uptake was calculated from initial rates at 5 to 30 min for succinate and 5 to 15 min for methanol data. Numbers of cells/ml were calculated from the OD600 by the equation y = 4e8x − 2e7 and were corrected for volume (x = OD600; y = CFU). Respiration rates were calculated as mol O/cell-min. Statistical significance was calculated using a two-sample t test.
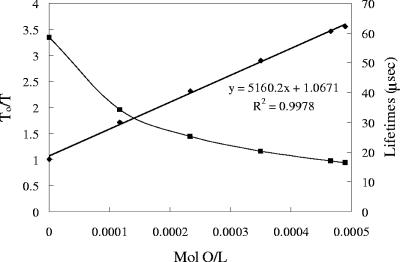
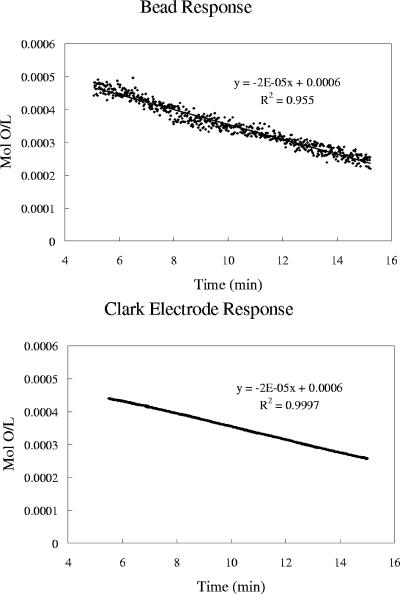
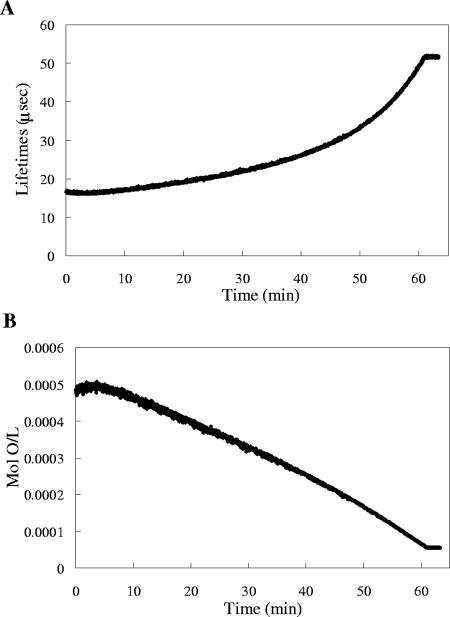
The sensor response was highly reproducible, and calibration plots exhibited a linear trend (Fig. 2). Calibration curves obtained using a quartz cuvette and the modified culture tube were superimposable (data not shown). The device functionality was tested with wild-type M. extorquens AM1 grown on succinate and methanol, using a Clark electrode and the sensor beads simultaneously, and both detection modalities were consistent (Fig. 3 and 4). Figure 4 illustrates oxygen uptake for the wild type during growth on succinate and is characteristic of the data collected (Table 1).
FIG. 2.
Calibration curves of porphyrin-doped polystyrene beads displayed as phosphorescence lifetime decay (squares) and Stern-Volmer (diamonds) plots.
FIG. 3.
Comparison of Pt-porphyrin-doped beads and a Clark electrode for measurement of wild-type M. extorquens AM1 respiration rate during growth on methanol.
FIG. 4.
Oxygen uptake data for wild-type M. extorquens AM1 grown on succinate. (A) Phosphorescence lifetimes collected. (B) Oxygen consumption over time.
TABLE 1.
Respiration rates calculated for wild-type and mutant strains of M. extorquens AM1 during growth on succinate and methanol
| Strain | Respiration rate (mol O/min-cell [e−17])a
|
|
|---|---|---|
| Growth on methanol | Growth on succinate | |
| Wild type | 5.4 ± 0.74 (10) | 3.8 ± 0.89 (12) |
| NADH-UOR mutant | 5.6 ± 0.56 (5) | 2.1 ± 0.58 (5) |
| PhaR mutant | 4.6 ± 0.71 (8) | 4.1 ± 1.6 (8) |
Data are means ± standard deviations; numbers in parentheses indicate numbers of samples.
Respiration rates of wild-type cultures grown on methanol were significantly higher than those of cultures grown on succinate (P < 0.001). This was surprising because the growth of bulk cultures on succinate is faster than that on methanol (∼4 h versus ∼6 h; data not shown). The increased rate during methanol growth may reflect the coupling of methanol oxidation with cytochrome c (2) and the more efficient energy metabolism during growth on succinate.
Respiration rates for the NADH-UOR mutant during growth on methanol were not different from those of the wild type (P > 0.25), consistent with the lack of a growth phenotype and predictions that methanol growth is reducing power limited (19). Growth on succinate resulted in a significant drop in oxygen uptake rates (P < 0.005). NADH-UOR subunit B is homologous to NouB, forming part of the catalytic core of complex I in electron transport (20). A deletion of subunit B would result in little or no electrons being derived from NADH (18). The O2 uptake rate during growth on succinate is predicted to come from electrons that enter the electron transport chain downstream of NADH (20).
Measurements of subtle phenotypes were tested with the PhaR mutant, which grows 15% slower than the wild type during growth on methanol (8). Respiration rates during growth on succinate were not different from those of the wild type (P > 0.25), consistent with the lack of a growth phenotype. However, rates detected during growth on methanol indicated a 15% decrease in oxygen consumption (P < 0.025), which is comparable to the difference in growth rates. 13C label tracing experiments indicated that 70% of acetyl-CoA during growth on methanol is redirected into the tricarboxylic acid cycle, which results in an increase in CO2 production (21). Our results likely reflect inefficiencies in converting methanol into acetyl-CoA and then reoxidizing the carbon to CO2 (21).
For this study, commercially available technology was used to measure the respiration rates of M. extorquens AM1. The results correlate with those obtained using a Clark electrode, and the optical method was found to be highly sensitive to environmental changes and was reproducible, with respiration rate changes as little as 5 to 10% being detected. The data indicate that respiration rates of M. extorquens AM1 differ significantly depending on the carbon source utilized and can be diagnostic for the metabolic mode under these growth conditions. In addition, we have demonstrated a correlation of mutant phenotypes to respiration rates and the ability to detect subtle phenotypes. This technique could also be expanded to the study of bacterial interactions and viable but nonculturable populations (6, 10). Overall, this method shows promise as a routine phenotypic screening tool for metabolic dynamics and mutant phenotypes and could be adapted to small-volume, high-density well formats for high-throughput screening.
Acknowledgments
We thank Gamal Khalil for access to the measurement device used in this study, Deirdre Meldrum for the use of facilities, Xiaofeng Guo for the calculations of cell numbers/OD600, the Microscale Life Sciences Center for support, and Steve Van Dien for invaluable advice.
This work was supported by a grant from NHGRI (P50 HG02360) for a Center of Excellence in Genomic Sciences.
REFERENCES
- 1.Alderman, J., J. Hynes, S. M. Floyd, J. Kruger, R. O'Connor, and D. B. Papkovsky. 2004. A low-volume platform for cell-respirometric screening based on quenched-luminescence oxygen sensing. Biosens. Bioelectron. 19:1529-1535. [DOI] [PubMed] [Google Scholar]
- 2.Anthony, C. 1982. The biochemistry of methylotrophs. Academic Press, London, United Kingdom.
- 3.Attwood, M. M., and W. Harder. 1972. A rapid and specific enrichment procedure for Hyphomicrobium spp. Antonie Leeuwenhoek 38:369-377. [DOI] [PubMed] [Google Scholar]
- 4.Buerk, D. G., A. G. Tsai, M. Intaglietta, and P. C. Johnson. 1998. In vivo tissue pO2 measurements in hamster skinfold by recessed pO2 microelectrodes and phosphorescence quenching are in agreement. Microcirculation 5:219-225. [PubMed] [Google Scholar]
- 5.FitzGerald, K. A., and M. E. Lidstrom. 2003. Overexpression of a heterologous protein, haloalkane dehalogenase, in a poly-beta-hydroxybutyrate-deficient strain of the facultative methylotroph Methylobacterium extorquens AM1. Biotechnol. Bioeng. 81:263-268. [DOI] [PubMed] [Google Scholar]
- 6.Katsifas, E. A., T. G. Koraki, and A. D. Karagouni. 2000. Determination of metabolic activity of streptomycetes in soil microcosms. J. Applied Microbiol. 89:178-184. [DOI] [PubMed] [Google Scholar]
- 7.Kaya, T., D. Numai, K. Nagamine, S. Aoyagi, H. Shiku, and T. Matsue. 2004. Respiration activity of Escherichia coli entrapped in a cone-shaped microwell and cylindrical micropore monitored by scanning electrochemical microscopy (SECM). Analyst 129:529-534. [DOI] [PubMed] [Google Scholar]
- 8.Korotkova, N., L. Chistoserdova, and M. E. Lidstrom. 2002. Poly-beta-hydroxybutyrate biosynthesis in the facultative methylotroph Methylobacterium extorquens AM1: identification and mutation of gap11, gap20, and phaR. J. Bacteriol. 184:6174-6181. [DOI] [PMC free article] [PubMed] [Google Scholar]
- 9.Lieberman, R. L., and A. C. Rosenzweig. 2004. Biological methane oxidation: regulation, biochemistry, and active site structure of particulate methane monooxygenase. Crit. Rev. Biochem. Mol. Biol. 39:147-164. [DOI] [PubMed] [Google Scholar]
- 10.Nebe-von-Caron, G., P. J. Stephens, P. J. Hewitt, J. R. Powell, and R. A. Badley. 2000. Analysis of bacterial function by multi-colour fluorescence flow cytometry and single cell sorting. J. Microbiol. Methods 42:97-114. [DOI] [PubMed] [Google Scholar]
- 11.Otterstedt, K., C. Larsson, R. M. Bill, A. Stahlberg, E. Boles, S. Hohmann, and L. Gustafsson. 2004. Switching the mode of metabolism in the yeast Saccharomyces cerevisiae. EMBO Rep. 5:532-537. [DOI] [PMC free article] [PubMed] [Google Scholar]
- 12.Papkovsky, D. B. 1995. New oxygen sensors and their application to biosensing. Sens. Actuat. B 29:226-230. [Google Scholar]
- 13.Peel, D., and J. R. Quayle. 1961. Microbial growth on C1 compounds. I. Isolation and characterization of Pseudomonas AM1. Biochem. J. 81:465-469. [DOI] [PMC free article] [PubMed] [Google Scholar]
- 14.Poughon, L., C. G. Dussap, and J. B. Gros. 2001. Energy model and metabolic flux analysis for autotrophic nitrifiers. Biotechnol. Bioeng. 72:416-433. [PubMed] [Google Scholar]
- 15.Ramamoorthy, R., P. K. Dutta, and S. A. Akbar. 2003. Oxygen sensors: materials, methods, designs, and applications. J. Mater. Sci. 38:4271-4282. [Google Scholar]
- 16.Rasmussen, H. N., and U. F. Rasmussen. 2003. Oxygen solubilities of media used in electrochemical respiration measurements. Anal. Biochem. 319:105-113. [DOI] [PubMed] [Google Scholar]
- 17.Reece, J. S., M. J. Miller, M. A. Arnold, C. Waterhouse, T. Delaplaine, L. Cohn, and T. Cannon. 2003. Continuous oxygen monitoring of mammalian cell growth on space shuttle mission STS-93 with a novel radioluminescent oxygen sensor. Appl. Biochem. Biotechnol. 104:1-11. [DOI] [PubMed] [Google Scholar]
- 18.Steuber, J. 2001. The Na+-translocating NADH:quinone oxidoreductase (NDH I) from Klebsiella pneumoniae and Escherichia coli: implications for the mechanism of redox-driven cation translocation by complex I. J. Bioenerg. Biomembr. 33:179-186. [DOI] [PubMed] [Google Scholar]
- 19.Van Dien, S. J., and M. E. Lidstrom. 2002. Stoichiometric model for evaluating the metabolic capabilities of the facultative methylotroph Methylobacterium extorquens AM1, with application to reconstruction of C(3) and C(4) metabolism. Biotechnol. Bioeng. 78:296-312. [DOI] [PubMed] [Google Scholar]
- 20.Van Dien, S. J., Y. Okubo, M. T. Hough, N. Kotokova, T. Taitano, and M. E. Lidstrom. 2003. Reconstruction of C(3) and C(4) metabolism in Methylobacterium extorquens AM1 using transposon mutagenesis. Microbiology 149:601-609. [DOI] [PubMed] [Google Scholar]
- 21.Van Dien, S. J., T. Strovas, and M. E. Lidstrom. 2003. Quantification of central metabolic fluxes in the facultative methylotroph Methylobacterium extorquens AM1 using 13C-label tracing and mass spectrometry. Biotechnol. Bioeng. 84:45-55. [DOI] [PubMed] [Google Scholar]
- 22.Wilson, D. F., J. M. Vanderkooi, T. J. Green, G. Maniara, S. P. Defeo, and D. C. Bloomgarden. 1987. A versatile and sensitive method for measuring oxygen. Adv. Exp. Med. Biol. 215:71-77. [DOI] [PubMed] [Google Scholar]
- 23.Wilson, D. F. 1992. Oxygen dependent quenching of phosphorescence: a perspective. Adv. Exp. Med. Biol. 317:195-201. [DOI] [PubMed] [Google Scholar]


