

Abstract
Zearalenone, a mycotoxin produced by several Fusarium spp., is most commonly found as a contaminant in stored grain and has chronic estrogenic effects on mammals. Zearalenone is a polyketide derived from the sequential condensation of multiple acetate units by a polyketide synthase (PKS), but the genetics of its biosynthesis are not understood. We cloned two genes, designated ZEA1 and ZEA2, which encode polyketide synthases that participate in the biosynthesis of zearalenone by Gibberella zeae (anamorph Fusarium graminearum). Disruption of either gene resulted in the loss of zearalenone production under inducing conditions. ZEA1 and ZEA2 are transcribed divergently from a common promoter region. Quantitative PCR analysis of both PKS genes and six flanking genes supports the view that the two polyketide synthases make up the core biosynthetic unit for zearalenone biosynthesis. An appreciation of the genetics of zearalenone biosynthesis is needed to understand how zearalenone is synthesized under field conditions that result in the contamination of grain.
The filamentous fungus Gibberella zeae (Schwein.) Petch (anamorph Fusarium graminearum Schwabe) is a worldwide pathogen of maize and small grains such as wheat, barley, and oats. In infected grain, G. zeae may produce several mycotoxins, including the trichothecene deoxynivalenol, and the polyketides zearalenone (ZEA) and fusarin C, thereby reducing grain yield and quality. The genetics and biosynthesis of both trichothecenes and fusarin C have been the subject of intensive study (6, 32), but the genetics and biosynthesis of ZEA have received comparatively little attention (30).
ZEA is produced by several other Fusarium species, including F. culmorum, F. sporotrichioides, F. equiseti, and F. semitectum (21). Zearanol, a derivative of ZEA, has been used commercially as a bovine growth promoter (18). However, in North America, ZEA is most commonly associated with G. zeae infections of maize (30). ZEA has relatively low toxicity and carcinogenicity levels (50% lethal dose of 2 to 10 g/kg), but chronic exposure and synergistic interactions with other environmental estrogens can elicit effects on mammals at levels as low as 1.5 to 3 mg/kg body weight (21). Surveys carried out in several countries indicate that these levels are present in food supplies worldwide (9).
The incorporation of [1-13C]acetate and [2-13C]acetate into ZEA illustrates that ZEA is a polyketide (24). In fungi, polyketides are produced by type I iterative polyketide synthases (PKSs). These large, multidomain enzymes iteratively catalyze several rounds of condensation of coenzyme A (CoA) thioesterified carboxylic acids, usually acetate and malonate. A minimal PKS contains β-ketoacyl synthase (KS), β-ketoacyl transferase (AT), and acyl carrier protein (ACP) domains. A PKS may also have one or more other domains, such as β-ketoacyl reductase (KR), dehydratase (DH), enoyl reductase (ER), methyltransferase, and cyclase (12). The number of reducing domains determines the extent of reduction of the keto group following each condensation event, and, in extreme cases, reduction can produce a linear polyketide such as fumonisin (28) or T toxin (39). In the absence of reducing domains, the keto group remains intact, resulting in unreduced and often cyclic polyketides such as bikaverin, the red mycelial pigment formed by Gibberella fujikuroi (22), and the green spore pigment of Aspergillus nidulans (36, 37). The type of polyketide (reducing or nonreducing) can be predicted either by identifying the conserved domains or based on the sequence of the highly conserved KS domains (4, 20). Recently, a phylogenetic analysis of the PKS genes identified in several filamentous fungi, including G. zeae, substantiated that the two groups were phylogenetically distinct (20).
In fungi, genes involved in the biosynthesis of a secondary metabolite are often clustered, and clusters may include one or more regulatory genes (8, 27). Most clusters associated with polyketide biosynthesis contain a single PKS gene and several genes encoding enzymes, e.g., P450 monooxygenases, that modify the polyketide backbone (17). Clusters that include two PKS genes exist for the biosynthesis of lovastatin (14) and compactin (1), which are very similar in chemical structure, as are the genes in their biosynthetic clusters (1). The two polyketides in lovastatin appear to be produced independently, and the shorter polyketide, a diketide, is subsequently added to the longer product, a nonaketide (14, 15). In contrast, aflatoxin biosynthesis involves two fatty acid synthases, which produce a fully reduced hexanoyl chain that acts as a primer for the PKS to complete the backbone (38).
The complete genome sequence of G. zeae has been released by the Broad Institute (http://www.broad.mit.edu). We analyzed the sequence to identify and characterize the PKS genes (13). Our objective in the present study was to disrupt and characterize two of the identified PKS genes that, when genetically disrupted, resulted in the loss of the ability to accumulate ZEA. We expected to find a cluster of genes that contained the PKS-encoding sequences and additional genes that participate in and regulate ZEA production.
MATERIALS AND METHODS
Fungal strains.
The strains of G. zeae used for this study were a Michigan field isolate, designated PH-1 (FGSC 9075, NRRL 31084), and nitM mutant Z3634 NitM, which has a defective molybdenum cofactor that prevents the utilization of nitrate as a nitrogen source (5). All strains were maintained on sterile soil at −20°C (3).
Fungal transformation.
Transformations were performed using protoplasts as previously published (29) with modifications as recently described (13). Putative transformants were selected for 4 to 7 days following transformation to hygromycin resistance, which was confirmed by growth on V8 juice medium amended with 450 μg/ml HygB. Resistant (Hygr) colonies were transferred to a 2% water agar medium, and a single conidium was isolated for each colony. The resulting colonies were used for further analysis.
Gene structure and analysis.
The predicted PKS protein sequences for ZEA1 (Fg02395) (GenBank accession no. XP_382571) and ZEA2 (Fg02396) (GenBank no. accession XP_382572) were analyzed by both CDART (http://www.ncbi.nih.gov) and RPSBLAST (http://www.ncbi.nih.gov) to identify putative functional domains. Subsequently, amino acid sequences of both genes were aligned with the conserved domains from previously characterized fungal PKS genes using ClustalW (http://www.ebi.ac.uk) (22, 28) to assist in the manual annotation.
The sequence of ZEA1 was incomplete, as it spans contigs 118 and 119 (http://www.broad.mit.edu), and the intercontig region has not been sequenced. We amplified the region spanning these two contigs using PCR with primers listed in Table 1. The amplicons were cloned into a pCR2.1-TOPO vector using the TOPO TA cloning kit (Invitrogen Life Technologies) and sequenced at the Genomic Technology Support Facility at Michigan State University. The BLAST tool (http://www.ncbi.nih.gov) was used to align the resulting sequences. The amplicon sequences were aligned with one another to determine a consensus sequence, and this sequence was then aligned with those of contigs 118 and 119 to confirm that these two contigs were physically linked and to identify the novel portions of the sequence. Using this complete sequence, FGENESH software (http://www.softberry.com) with organism-specific parameters for Fusarium graminearum was used to identify the entire gene for ZEA1 and the putative transcription start sites for both ZEA1 and ZEA2.
TABLE 1.
Primers used in this study
| Primer | Sequence |
|
|---|---|---|
| Forward (5′-3′) | Reverse (5′-3′) | |
| Gene disruption | ||
| ZEA1 | GCAATGCGTCCAGCTCCAAAAG | TCGGTTCACCTCGGTCAAATCCAG |
| ZEA2 | GGAGGATATGGGCGTGGTGAAGGA | GGCTGGCTGATCTCGGGCAAAGT |
| Sequencing intercontig region | ||
| 118A | GTGGCTGATCCCGCTCTTTGACG | TACAAGCATGGCGCAACAATAGAC |
| 118B | GACGGCCTCAACCTTTTCAGTG | TACAAGCATGGCGCAACAATAGAC |
| Expression analysis | ||
| ZEA1 | GAAGAGGCCCCGGTAGCGATAAC | TGAAGCCACTCCAGCAGCAGAATT |
| ZEA2 | GTCTCACTGACTTTGTTCGCAT | TCAAAGGATGTTCCTGGTTGCT |
| AUR1 | GGATTCACCGTGCCCGACAT | TTCAACGCAGAGCTCCATTACGC |
| Cluster analysis | ||
| Fg02393.1 | ACCATCCAATCTCGGGCTTT | TAACTTCAGTCGCCTCGCAAA |
| Fg02394.1 | TCGGGTCGAGGACTTCTGTG | GGTATGCTCCTGGACAGCGT |
| Fgd117-550 | CCAACGATTACACCAAGTCTCACTAT | GTTGTCTGGACGAGACAGGGTAC |
| Fg12015 | TGCTGGATAAGATTGCTCGTCTC | TCTCCAGTATCTGCTCCGGTCT |
| Fg12056 | AAATAATTTACCCGTTCTTCTGGGAACT | CTGAAACGGAGGTGTTGAGG |
| Fg02398.1 | GCTGTGGCCCAAATGCA | GCTATGATCGCCGATAGAAAGG |
| β-Tubulin | TCGACTGGATCCCCAACAAC | GAACTGGTCGTCGACACGCT |
| GAPDH | CTACATGCTCAAGTACGACTCTTCCC | GCCGGTCTCGGACCACTTG |
| ZEA1 | GGCACTTTGACAACCGCTTC | TTGCGCCGTCTGAGTACCC |
| ZEA2 | ACATGCGTGTCGTTGTTGTAAG | TGCACCGTGAGAAGCCGT |
Gene disruption.
Disruption vectors were generated by ligating a PCR-amplified fragment from each predicted gene into the SmaI site of pHYG4, a vector that carries the selectable marker hygromycin B phosphotransferase (hph) (7). The locations of the amplified fragments on contig 119 were as follows: ZEA1, positions 2628 to 3760 (1,133 bp) to yield the disruption vector pHYG4-ZEA1; ZEA2, positions 6149 to 7355 (1,207 bp) to yield the disruption vector pHYG4-ZEA2 based on the Broad sequence (Table 1). PH-1 was transformed independently with pHYG4-ZEA1 and pHYG4-ZEA2. Hygr colonies were identified and purified by single-spore subculture as previously described (13). Mutants were considered independent if they arose as discrete colonies on selective medium less than 10 days following transformation. Two independent disruption mutants of each PKS gene and one transformant resulting from ectopic integration of each vector were selected for further analysis. The ZEA1-disrupted mutants were designated zea1m1 and zea1m2, and the ectopic transformant was designated zea1E. The ZEA2-disrupted mutants were similarly designated zea2m1 and zea2m2, and the ectopic transformant was designated zea2E. Genomic DNA was isolated (16, 19) from transformants and cut independently with two different restriction enzymes, one with a site within the disruption vector (BseRI for ZEA1 mutants and SphI for ZEA2 mutants) and the other with no sites within the disruption vector (BbsI for ZEA1 mutants and BsaBI for ZEA2 mutants). Restricted fragments were resolved in 0.8% Tris-acetate-EDTA-agarose by electrophoresis and transferred onto a nylon membrane. The membranes were probed twice with 32P-labeled probes, once with the amplicon used to disrupt the specific gene and once with a portion of hph (588 bp long). The residual probe was removed by washing with boiling 0.1% sodium dodecyl sulfate in water between hybridizations.
The disrupted mutants were crossed with Z-3634 NitM, and cirrhi from perithecia developing on the interface line between the two parental colonies were analyzed. Hybrid cirrhi were identified by the presence of both wild-type and NitM phenotypes in an approximately 1:1 ratio when grown on minimal medium with tergitol and sorbose (MMTS) (5) agar. The progeny in these hybrid cirrhi were then analyzed for recombination between the Hygr and ZEA− phenotypes. The procedures to obtain the crosses and the ability to utilize nitrate as a nitrogen source were performed as previously described (5). All other nucleic acid manipulations and molecular procedures were carried out according to standard methods (31).
Expression analysis.
Reverse transcriptase PCR was used to determine whether ZEA1 and ZEA2 were expressed in the disrupted transformants. Eight plates (6-cm diameter) containing rice agar (25) were inoculated with approximately 106 spores and incubated at room temperature (24 to 26°C) for 5 days and then transferred to an incubator at 11°C for five additional days. Surface and subsurface mycelia were harvested with a scalpel. For noninducing conditions, three flasks (250-ml capacity) containing 100 ml Czapek-Dox broth (Becton Dickinson, Sparks, MD) were inoculated with approximately 106 spores and incubated at room temperature for 7 days. Although the noninducing conditions are not parallel to the inducing conditions, they ensured that no detectable ZEA was produced during the incubation time and therefore provided the best comparison for gene expression analyses. RNA was extracted from lyophilized hyphae harvested under both conditions using TRIzol reagent (Invitrogen Life Technologies, Carlsbad, CA) according to the manufacturer's instructions. First-strand cDNA synthesis was carried out with SuperScript II RNase H− reverse transcriptase (Invitrogen Life Technologies) and random hexamers. Gene-specific primers were used to amplify regions of each PKS gene to identify the conditions under which they were expressed. Primers (Table 1) were designed such that the annealing region of one primer of each pair spanned the exon junction in the mRNA so that only spliced mRNAs were amplified. As a control, the PKS gene AUR1 (Fg02324.1), known to be expressed under ZEA-inducing conditions (13), was used.
Expression of flanking genes.
Quantitative PCR was performed to identify genes flanking ZEA1 and ZEA2 that were coregulated. The wild-type strain was grown on rice as described above (the induced condition) and in liquid Czapek-Dox broth medium for 7 days (the noninduced condition). RNA was extracted as described above and treated with DNA-Free (Ambion, Austin, TX) to remove any contaminating genomic DNA. For each sample, 2.0 μg of treated RNA was converted to cDNA using Taqman reverse transcriptase reagents (Applied Biosystems, Foster City, CA) according to the manufacturer's directions. Relative levels of gene expression were determined by using SYBR Green PCR Mastermix (Applied Biosystems), the Applied Biosystems 7900HT sequence detection system (Genomics Technology Support Facility, Michigan State University), and appropriate primers (Table 1). PCRs were carried out in triplicate and were repeated a minimum of three times. All preparations were carried out according to the manufacturers' instructions. cDNA from the induced sample was used to generate standard curves for each gene of interest. The quantity mean of each gene was then normalized to the endogenous controls of β-tubulin and glyceraldehyde-3-phosphate dehydrogenase (GAPDH) to obtain the normalized value for each gene. The severalfold change for each gene was calculated as a ratio between the normalized values under inducing conditions and those under noninducing conditions for that gene. ZEA1 and ZEA2 were amplified and served as positive controls.
Two websites now document the functional assignments of genes in the G. zeae genome. The Broad Institute at the Massachusetts Institute of Technology website (http://www.broad.mit.edu) and the Munich Information Center for Protein Sequences (MIPS) website (http://mips.gsf.de/) both record gene calls using the same gene designations, with one exception: genes with designations above Fg12000 are recorded only on the MIPS website. In addition, Fgd117-550 was only recognized by the MIPS website. The designation “.1” after a gene indicates the annotation version of this gene. We will include this designation only in Materials and Methods.
Detection of ZEA.
Thin-layer chromatography (TLC) followed by spectrum analysis and competitive enzyme-linked immunosorbent assay (ELISA) were used to detect ZEA. Transformants were grown on Uncle Ben's converted rice (Master Food Services, San Antonio, TX), a vitamin-supplemented parboiled rice known to stimulate ZEA production (26, 33). Uncle Ben's converted rice (25 g) was aliquoted into Erlenmeyer flasks and soaked in 20 ml of distilled water for 2 h. After autoclaving for 1 h, the clumps of rice were broken up and allowed to stand overnight. The following day, the rice was reautoclaved for 1 h and inoculated with 106 to 108 conidia suspended in 2 ml of distilled water. This inoculated rice was transferred to petri dishes (100 by 25 mm), taped with Tenderskin hypoallergenic paper tape (The Kendall Company, Mansfield, MA), and incubated at room temperature for 1 week until the rice was fully colonized. The cultures were transferred to an incubator at 11°C for two more weeks (33). Samples were harvested by drying the open petri dishes in a forced-air oven at 55°C for 3 to 4 days. Samples were ground to a fine powder with a domestic coffee grinder and then analyzed.
For ZEA analysis, 200 mg of a rice sample was suspended in 1 ml 100% methanol, vortexed for 5 s, and sonicated for 15 min at room temperature. Resolution of ZEA in the extract was performed by TLC as previously described (35). Transformants that did not produce ZEA were rescreened with a commercial competitive ELISA-based Veratox kit for ZEA (Neogen Corp., Lansing, MI). Samples were prepared, diluted 50 times prior to the addition of assay reagents to ensure that ZEA levels were within the detection limits of the kit (50 to 600 ppb), and assayed according to the manufacturer's directions. Uninoculated Uncle Ben's rice was used as a control. Additionally, the area on the TLC plates comigrating with the ZEA control was collected and resuspended in minimal amounts of methanol, and the silica gel particles were removed by brief centrifugation at room temperature. Concentrations of ZEA were estimated by measuring the A274, and concentrations were adjusted to between 0.1 and 0.5 μg/ml as necessary. A spectrum analysis (200 to 350 nm) was performed with a Beckman DU 530 spectrophotometer (Beckman Instruments) according to a method described previously by Steele et al. (33). The ZEA production by progeny of crosses between ZEA1 and ZEA2 mutants and strain Z-3634 NitM was examined by TLC only.
RESULTS
Identification and disruption of ZEA1 and ZEA2.
ZEA1 and ZEA2 appear to be transcribed divergently, with 1,040 bp between their predicted start codons. Based on comparative sequence analysis, ZEA1 spanned contigs 118 and 119, with the 5′ end, including the KS and AT domains, located on contig 119 and the ACP domain at the 3′ end of contig 118. In the genomic sequence, there is a gap in the sequence between these two contigs, leaving ZEA1 incomplete. We used PCR to clone a fragment of the G. zeae genome spanning contigs 118 and 119 and sequenced the region (Fig. 1). We identified a 9-bp sequence (CAGGGCCAC) that linked the two contigs. Using this combined sequence (contig 118-9 bp-contig 119), the complete mRNA of ZEA1 was predicted to be 5,988 bp with a domain order of KS-AT-ACP. ZEA2 located entirely on contig 119 has a predicted size of 7,035 bp with a domain order of KS-AT-DH-ER-KR-ACP.
FIG. 1.

Chromosomal region of ZEA1 and ZEA2. Predicted genes and contigs are represented by a horizontal line. The direction of transcription of genes is indicated by arrows. Sequences of Fg12015 and Fg117-550 (crosshatching) are incomplete due to a gap in the genomic sequence between them. The novel sequence connecting contigs 118 and 119 is shown as a filled arrow. The contig numbers and coordinates are indicated across the bottom of the figure.
We used single-crossover integration of a unique internal fragment to disrupt ZEA1 and ZEA2. Southern analysis was performed on genomic DNA from the parental strain PH-1 and Hygr transformants that did not accumulate ZEA to confirm the integration of the disruption vectors into the corresponding gene (Fig. 2). For each disrupted transformant for each gene, the entire disruption plasmid integrated once at the appropriate site. For ZEA1 analysis, genomic DNA was cut with BseRI and probed with the radiolabeled gene fragment used in the disruption vector. As expected, this fragment hybridized with a 2.9-kb fragment and a 1.2-kb fragment in PH-1 and an additional 5.7-kb fragment corresponding to the inserted disruption vector in the two disrupted mutants (Fig. 2A). The 1.2-kb fragment is not shown in order to allow the resolution of the larger fragments. A 6.9-kb fragment, which is the product of a partial digest, was visible in the transformed mutants representing the combined 5.7-kb and 1.2-kb fragments (Fig. 2B). The genomic DNA of PH-1 had two additional bands with sizes of 6.3 and 5.6 kb, which are partial digests of the 2.9-kb fragment and a flanking 3.4-kb BseRI fragment as well as the 1.2-kb fragment and a flanking 4.4-kb fragment, respectively. The blot was stripped to remove the probe and reprobed with a radiolabeled fragment of hph1. The probe bound to the 5.7-kb fragment of the mutants as expected (not shown). No other DNA fragments hybridized with the probe in these transformants, indicating that ZEA1 was disrupted by the insertion of the vector into ZEA1. For ZEA2 analysis, genomic DNA was cut with BsaBI, which had no restriction sites within the disruption vector, and probed with the radiolabeled gene fragment used in the disruption vector. The probe hybridized to a fragment of 10.0 kb in the disrupted transformants and a fragment of 4.3 kb in the wild type, as predicted (Fig. 2A). The blot was stripped to remove the probe and reprobed with a fragment of hph1. The probe hybridized to the 10.0-kb fragment in the disrupted transformants but not in the PH-1 genomic DNA, as predicted (results not shown). The DNAs from the ectopic insertions of both genes had unique patterns of hybridization compared to PH-1 and the disrupted mutants. Reverse transcriptase PCR was used to confirm the loss of expression of both genes in the mutants (Fig. 3).
FIG. 2.

Genetic disruption of ZEA1 and ZEA2. (A) Schematic of disruption vectors integrated into the chromosome at the appropriate location and digested with BseRI (BR) and BsaBI (BB). Numbers indicate sizes of the predicted restriction fragments in kb. Genomic DNA, —; gene fragment used in disruption vector, ····; pHYG4, . (B) Southern hybridization analysis of genomic DNA from the disrupted transformants (M1 and M2), ectopic transformants (E), and PH-1. Probes were generated with the respective gene fragment used in the disruption vector. The sizes (kilobases) of the fragments are shown on the right of each autoradiogram.
FIG. 3.
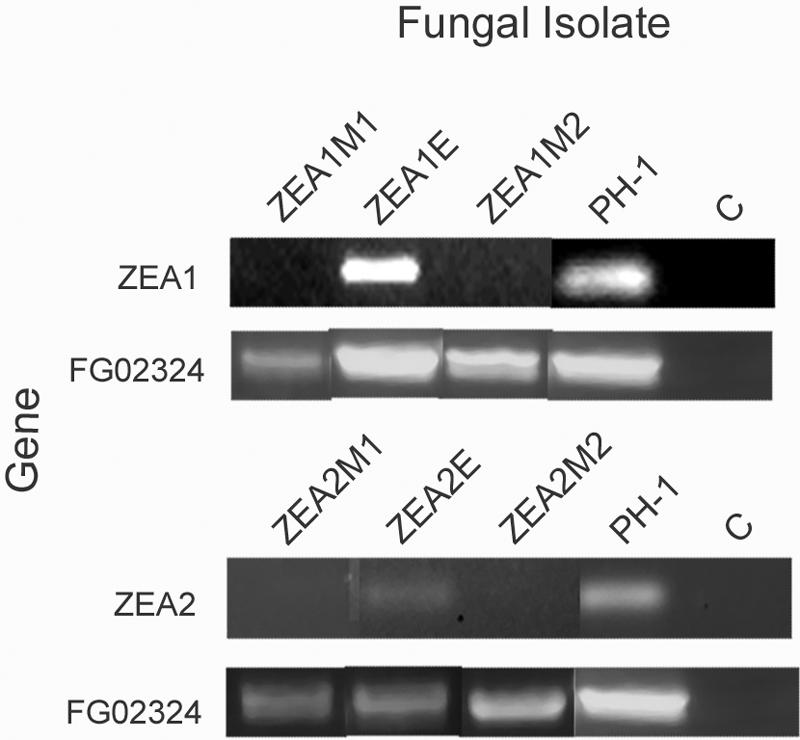
Expression analysis of ZEA1 and ZEA2 in disrupted mutants. Shown is PCR analysis of expression of genes ZEA1, ZEA2, and Fg02324 (positive control) in zea1 and zea2 mutants and in PH-1 under ZEA-inducing conditions. C, no cDNA added; E, ectopic insertion.
Analysis of zearalenone biosynthesis in ZEA1 and ZEA2 mutants.
Disruption of two PKS genes, designated ZEA1 and ZEA2, by insertional mutagenesis resulted in mutants that did not produce detectable quantities of ZEA when cultures were grown under inducing conditions. The ectopic transformants of both genes produced 31 ± 4.7 μg/g ZEA, a level similar to that produced by PH-1. The disrupted transformants produced 0.9 ± 0.2 μg/g ZEA, a much lower level and less than that found in the uninoculated rice control extracts (1.7 ± 0.2 μg/g). TLC analysis supported these findings (Fig. 4). The absorbance spectrum of the band that comigrated with ZEA in extracts of PH-1 and ectopic controls was indistinguishable from the spectrum for ZEA in having characteristic absorbance peaks at 236, 274, and 316 nm. This band was absent in extracts from disrupted transformants.
FIG. 4.
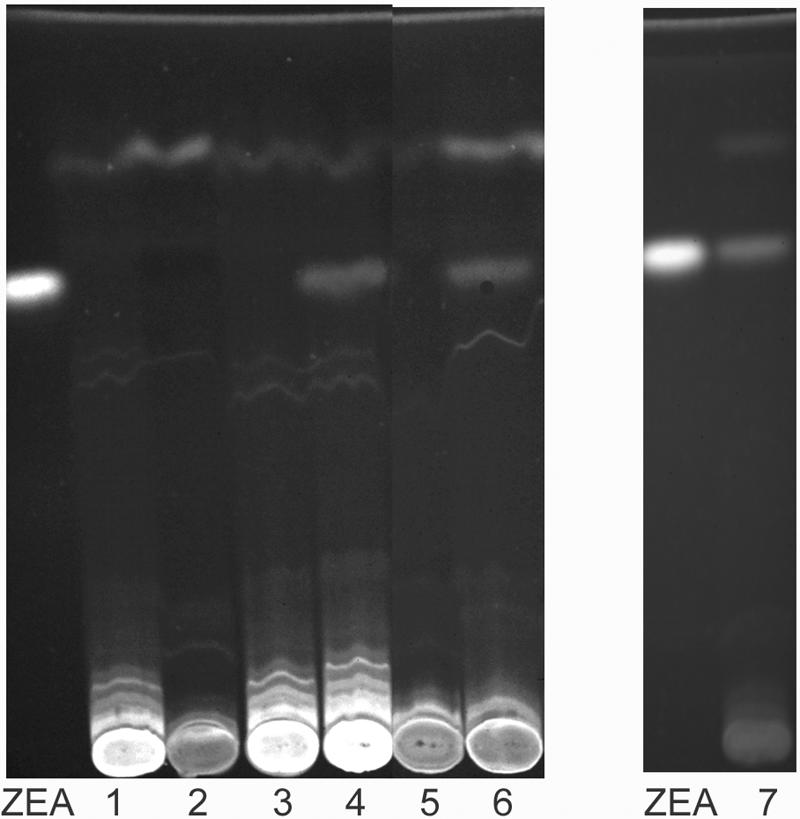
TLC analysis of ZEA1 and ZEA2 disruption mutants: ZEA, ZEA control. Lanes: 1, zea1m1; 2, zea2m1; 3, zea1m2; 4, PH-1; 5, zea2m2; 6, zea1 ectopic control; 7, zea2 ectopic control.
Individual colonies from single ascospores isolated from recombinant cirrhi from crosses between the ZEA1m1 and ZEA2m1 mutants and Z-3634 NitM were analyzed for segregation among the three phenotypes: NIT− (nitrate nonutilizing), Hygr, and ZEA−. Progeny from the cross with ZEAm1 resulted in a segregation ratio of eight NIT− Hygr ZEA− to NIT− Hygs (hygromycin sensitive) ZEA+ to six NIT+ Hygr ZEA− to six NIT+ Hygs ZEA+. Progeny from the cross with ZEA2m1 resulted in a segregation ratio of five NIT− Hygr ZEA− to six NIT− Hygs ZEA+ to six NIT+ Hygr ZEA− to five NIT+ Hygs ZEA+. Recombination between Hygr and ZEA− was not observed, indicating that hph1 cosegregated with each ZEA1 and ZEA2 in the mutants.
Expression of flanking genes.
Expression analysis of genes flanking ZEA1 and ZEA2 was done to identify a possible gene cluster. Quantitative PCR was performed to identify genes that were coregulated (Fig. 5). The analysis covered a region approximately 13.4 kb upstream (four predicted genes) and approximately 10.1 kb downstream (two predicted genes) of ZEA1 and ZEA2. Of the genes assayed, only Fg12015 (http://mips.gsf.de/) was expressed in a pattern similar to that of ZEA1 and ZEA2, all of which were up-regulated 105-fold in the induced cultures compared to the uninduced cultures. Fgd117-550 (upstream) and Fg12056 (downstream) flanking these genes were also upregulated to a slightly lower level of 104-fold.
FIG. 5.

Relative expression of genes adjacent to ZEA1 and ZEA2. Shown is quantitative PCR analysis of total RNA from the wild type under ZEA-inducing conditions relative to noninducing conditions, with each normalized to GAPDH (GAPD) and β-tubulin. Data presented are the averages of three replicates and are representative of a minimum of three independent amplification events. Standard deviations are indicated.
DISCUSSION
The disruption of ZEA1 and ZEA2 provides the first evidence that these two PKS genes are responsible for the biosynthesis of ZEA. Disruption of either gene results in transformants that do not accumulate ZEA. Genes for enzymes involved in the biosynthesis of mycotoxins are generally coregulated (17, 28). Of the six putative genes within approximately 13.4 kb upstream and approximately 10.1 kb downstream of ZEA1 and ZEA2, only one, Fg12015, was expressed in a manner similar to that of ZEA1 and ZEA2 (Fig. 5). Fg12015 is hypothesized to encode a putative K+-channel β subunit (http://www.mips.gsf.de), and there is no clear role for such a protein in ZEA biosynthesis. The other genes examined do not appear to be coregulated with ZEA1 and ZEA2. However, Fg12056 has a putative flavin adenine dinucleotide binding domain and may be an oxidoreductase. Such an enzyme could reduce the ketone groups at either C4 or C6 of ZEA to yield the observed natural variants (25). Fg02398, a putative GAL4 DNA-binding transcription factor, is upregulated under inducing conditions and could regulate ZEA biosynthesis even though transcription factors are not usually coregulated with biosynthetic genes in mycotoxin biosynthetic clusters (17). Although we cannot rule out the possibility that there are other biosynthetic genes present elsewhere in the genome, our data are consistent with a core biosynthetic cluster of ZEA1 and ZEA2 flanked by a possible modifying enzyme and one regulatory gene. Other regulatory genes are probably located elsewhere in the genome.
The ZEA1-ZEA2 intergenic region (contig 119; 4,296 to 5,336 bp) has three regions containing GAL4-binding motifs (contig 119; 4,574, 4,620, and 4,845 bp) and nine copies of the consensus sequence for binding GATA factors (contig 119; 4,380, 4,432, 4,539, 4,614, 4,764, 4,890, 4,970, 5,005, and 5,168 bp). The GAL4 family of Zn2Cys6 binuclear cluster protein transcription factors recognizes a palindromic sequence in which a 5′-CGG-3′ motif is separated by up to 11 nonconserved bases. The pathway-specific transcription factor for aflatoxin biosynthesis, AflR, belongs to this family (11). Fg02398 is one of six genes in the genome of F. graminearum that encodes a putative protein with a putative GATA-binding Zn finger domain. AbaA and two other transcription factors regulate genes expressed during asexual reproduction (2), and their recognition sites occur in the promoters of the aflatoxin biosynthesis genes (10). Two motifs recognized by AbaA-type transcription factors occur in the ZEA1-ZEA2 intergenic region (contig 119; 4,789 and 4,820 bp). The role of ZEA in development and the possible role of an AbaA-like protein need to be further investigated. A single consensus sequence for the PacC transcription factor was also present in the region (contig 119; 4,350 bp). Multiple copies of the PacC recognition site are usually present when PacC regulates a gene (23), so the importance of PacC as a regulator of ZEA production is likely to be less than that of other regulatory proteins.
We propose, based on the gene function and expression studies presented here, that ZEA1p and ZEA2p suffice for the biosynthesis of ZEA. The entire ZEA molecule would be synthesized from a single acetyl-CoA molecule and eight malonyl-CoA molecules (Fig. 6) as previously determined biochemically (24). The first 10 carbon additions are catalyzed by ZEA2p, which has the reductive domains KR, DH, and ER and could variably reduce the keto groups on the polyketide chain. The keto group can be partially reduced to yield an alkene or can be fully reduced to an alkane depending on the length of the carbon chain growing on the ACP domain (1). The remaining three rounds of C2 additions are generated by ZEA1p, which is a nonreducing PKS and which lacks KR, ER, and DH domains. The unreduced ketones added by ZEA1p are highly reactive and form a ring that is rapidly aromatized due to enolization of the ketone groups via a nonenzymatic process. An alternative mechanism is for C11 and C12 to be added by ZEA1p, not ZEA2p, an alternative that remains to be tested experimentally. The two ZEA proteins may be dimerized or may act independently. Dimerization would facilitate the transfer of the product of ZEA2p to ZEA1p (Fig. 6). In in vitro studies, PKSs can be promiscuous in terms of starter unit specificity (38). If ZEA1p and ZEA2p are associated, then ZEA1p should use the correct starter unit and thereby maximize the efficiency of ZEA biosynthesis. The ZEA1 and ZEA2 disruption mutants can be used to test the proposed biosynthetic pathway by examining the intermediates accumulated. The interactions between the two enzymes also need to be determined.
FIG. 6.

Proposed mechanism for ZEA biosynthesis by ZEA1p and ZEA2p. For step 1, the first 10 carbon additions are catalyzed by ZEA2p, the reducing PKS. As shown here, the chain may be subsequently transferred to the ACP domain of ZEA1p. For step 2, the remaining three rounds of C2 additions are catalyzed by ZEA1p, the nonreducing PKS. For step 3, the unreduced ketones in the portion of the molecule are highly reactive and are spontaneously aromatized. For step 4, the lactone ring is completed with the subsequent release of ZEA1p to yield the completed ZEA molecule.
Since 1962, when ZEA was first characterized (34), the mechanism of its biosynthesis and the regulation of expression have not been well described. With the identification of two polyketide synthases involved in ZEA biosynthesis and a putative regulatory protein, our understanding of the process of ZEA production in stored grain should be greatly facilitated. Such information will aid in the improved control of this toxin worldwide.
Acknowledgments
This work was supported by USDA-NRI-CGP grant no. 2001-35201-10062 and the Michigan State University Agricultural Experiment Station.
We thank Daren Brown and Mike Pollard for insightful discussions on zearalenone biosynthesis, Benjamin Munn for performing the ELISA analyses, Robert Bowden for providing the NitM mutant, and Annette Thelen for her help with the quantitative PCR.
REFERENCES
- 1.Abe, Y., T. Suzuki, C. Ono, K. Iwamoto, M. Hosobuchi, and H. Yoshikawa. 2002. Molecular cloning and characterization of an ML-236B (compactin) biosynthetic gene cluster in Penicillium citrinum. Mol. Genet. Genomics 267:636-646. [DOI] [PubMed] [Google Scholar]
- 2.Andrianopoulos, A., and W. E. Timberlake. 1994. The Aspergillus nidulans abaA gene encodes a transcriptional activator that acts as a genetic switch to control development. Mol. Cell. Biol. 14:2503-2515. [DOI] [PMC free article] [PubMed] [Google Scholar]
- 3.Atkinson, R. G. 1954. Quantitative studies on the survival of fungi in five-year-old dried soil cultures. Can. J. Bot. 32:673-678. [Google Scholar]
- 4.Bingle, L. E. H., T. J. Simpson, and C. M. Lazarus. 1999. Ketosynthase domain probes identify two subclasses of fungal polyketide synthase genes. Fungal Genet. Biol. 26:209-223. [DOI] [PubMed] [Google Scholar]
- 5.Bowden, R. L., and J. F. Leslie. 1999. Sexual recombination in Gibberella zeae. Phytopathology 89:182-188. [DOI] [PubMed] [Google Scholar]
- 6.Brown, D. W., R. B. Dyer, S. P. McCormick, D. F. Kendra, and R. D. Plattner. 2004. Functional demarcation of the Fusarium core trichothecene gene cluster. Fungal Genet. Biol. 41:454-462. [DOI] [PubMed] [Google Scholar]
- 7.Carroll, A. N., J. A. Sweigard, and B. Valent. 1994. Improved vectors for selecting resistance to hygromycin. Fungal Genet. Newsl. 41:22. [Google Scholar]
- 8.Chang, P. K., K. C. Ehrlich, J. E. Linz, D. Bhatnagar, T. E. Cleveland, and J. W. Bennett. 1996. Characterization of the Aspergillus parasiticus niaD and niiA gene cluster. Curr. Genet. 30:68-75. [DOI] [PubMed] [Google Scholar]
- 9.D'Mello, J. P. F., C. M. Placinta, and A. M. C. Macdonald. 1999. Fusarium mycotoxins: a review of global implications for animal health, welfare and productivity. Anim. Feed Sci. Technol. 80:183-205. [Google Scholar]
- 10.Ehrlich, K. C., B. G. Montalbano, J. W. Cary, and P. J. Cotty. 2002. Promoter elements in the aflatoxin pathway polyketide synthase gene. Biochim. Biophys. Acta 1576:171-175. [DOI] [PubMed] [Google Scholar]
- 11.Fernandes, M., N. P. Keller, and T. H. Adams. 1998. Sequence-specific binding by Aspergillus nidulans AflR, a C6 zinc cluster protein regulating mycotoxin biosynthesis. Mol. Microbiol. 28:1355-1365. [DOI] [PubMed] [Google Scholar]
- 12.Fujii, I., A. Watanabe, and Y. Ebizuka. 2004. More functions for multifunctional polyketide synthases, p. 97-125. In J. S. Tkacz and L. Lange (ed.), Advances in fungal biotechnology for industry, agriculture, medicine. Kluwer Academic/Plenum Publishers, New York, N.Y.
- 13.Gaffoor, I., D. W. Brown, R. D. Plattner, R. H. Proctor, W. Qi, and F. Trail. 2005. Functional analysis of the polyketide synthase genes in the filamentous fungus Gibberella zeae (anamorph Fusarium graminearum). Eukaryot. Cell 4:1926-1933. [DOI] [PMC free article] [PubMed] [Google Scholar]
- 14.Hendrickson, L., C. R. Davis, C. Roach, D. K. Nguyen, T. Aldrich, P. C. McAda, and C. D. Reeves. 1999. Lovastatin biosynthesis in Aspergillus terreus: characterization of blocked mutants, enzyme activities and a multifunctional polyketide synthase gene. Chem. Biol. 6:429-439. [DOI] [PubMed] [Google Scholar]
- 15.Hutchinson, C. R., J. Kennedy, C. Park, S. Kendrew, K. Auclair, and J. Vederas. 2000. Aspects of the biosynthesis of non-aromatic fungal polyketides by iterative polyketide synthases. Antonie Leeuwenhoek 78:287-295. [DOI] [PubMed] [Google Scholar]
- 16.Jurgenson, J. E., R. L. Bowden, K. A. Zeller, J. F. Leslie, N. J. Alexander, and R. D. Plattner. 2002. A genetic map of Gibberella zeae (Fusarium graminearum). Genetics 160:1451-1460. [DOI] [PMC free article] [PubMed] [Google Scholar]
- 17.Keller, N. P., and T. M. Hohn. 1997. Metabolic pathway gene clusters in filamentous fungi. Fungal Genet. Biol. 21:17-29. [PubMed] [Google Scholar]
- 18.Kennedy, D. G., S. A. Hewitt, J. D. G. McEvoy, J. W. Currie, A. Cannavan, W. J. Blanchflower, and C. T. Elliot. 1998. Zeranol is formed from Fusarium spp. toxins in cattle in vivo. Food Addit. Contam. 15:393-400. [DOI] [PubMed] [Google Scholar]
- 19.Kerényi, Z., K. Zeller, L. Hornok, and J. F. Leslie. 1999. Molecular standardization of mating type terminology in the Gibberella fujikuroi species complex. Appl. Environ. Microbiol. 65:4071-4076. [DOI] [PMC free article] [PubMed] [Google Scholar]
- 20.Kroken, S., N. L. Glass, J. W. Taylor, O. C. Yoder, and B. G. Turgeon. 2003. Phylogenomic analysis of type I polyketide synthase genes in pathogenic and saprobic ascomycetes. Proc. Natl. Acad. Sci. USA 100:15670-15675. [DOI] [PMC free article] [PubMed] [Google Scholar]
- 21.Kuiper-Goodman, T., P. M. Scott, and H. Watanabe. 1987. Risk assessment of the mycotoxin zearalenone. Regul. Toxicol. Pharmacol. 7:253-306. [DOI] [PubMed] [Google Scholar]
- 22.Linnemannstöns, P., J. Schulte, M. D. Prado, R. H. Proctor, J. Avalos, and B. Tudzynski. 2002. The polyketide synthase gene pks4 from Gibberella fujikuroi encodes a key enzyme in the biosynthesis of the red pigment bikaverin. Fungal Genet. Biol. 37:134-148. [DOI] [PubMed] [Google Scholar]
- 23.Martin, J. F. 2000. Molecular control of expression of penicillin biosynthesis genes in fungi: regulatory proteins interact with a bidirectional promoter region. J. Bacteriol. 182:2355-2362. [DOI] [PMC free article] [PubMed] [Google Scholar]
- 24.Mirocha, C. J., and S. V. Pathre. 1979. Mycotoxins—their biosynthesis in fungi—zearalenone biosynthesis. J. Food Prot. 42:821-824. [DOI] [PubMed] [Google Scholar]
- 25.Nelson, R. R. 1971. Hormonal involvement in sexual reproduction in the fungi with special reference to F-2, a fungal estrogen, p. 181-200. In S. Adai and S. Ouchi (ed.), Morphological and biochemical events in plant-parasite interaction. The Phytopathological Society of Japan, Tokyo, Japan.
- 26.Pathre, S. V., P. V. Khadikar, and C. J. Mirocha. 1989. Biosynthesis of zearalenone: a simple and efficient method to incorporate [13C]acetate label by using solid cultures. Appl. Environ. Microbiol. 55:1955-1956. [DOI] [PMC free article] [PubMed] [Google Scholar]
- 27.Proctor, R. H., D. W. Brown, R. D. Plattner, and A. E. Desjardins. 2003. Co-expression of 15 contiguous genes delineates a fumonisin biosynthetic gene cluster in Gibberella moniliformis. Fungal Genet. Biol. 38:237-249. [DOI] [PubMed] [Google Scholar]
- 28.Proctor, R. H., A. E. Desjardins, R. D. Plattner, and T. M. Hohn. 1999. A polyketide synthase gene required for biosynthesis of fumonisin mycotoxins in Gibberella fujikuroi mating population A. Fungal Genet. Biol. 27:100-112. [DOI] [PubMed] [Google Scholar]
- 29.Proctor, R. H., T. M. Hohn, and S. P. McCormick. 1995. Reduced virulence of Gibberella zeae caused by disruption of a trichothecene toxin biosynthetic gene. Mol. Plant-Microbe Interact. 8:593-601. [DOI] [PubMed] [Google Scholar]
- 30.Richard, J. L., and G. A. Payne. 2003. Mycotoxins: risks in plant, animal and human systems. CAST report. Council for Agricultural Science and Technology, Ames, Iowa.
- 31.Sambrook, J., and D. W. Russell. 2001. Molecular cloning: a laboratory manual, 3rd ed. Cold Spring Harbor Laboratory Press, Cold Spring Harbor, N.Y.
- 32.Song, Z. S., R. J. Cox, C. M. Lazarus, and T. J. Simpson. 2004. Fusarin C biosynthesis in Fusarium moniliforme and Fusarium venenatum. Chembiochem 5:1196-1203. [DOI] [PubMed] [Google Scholar]
- 33.Steele, J. A., J. R. Lieberman, and C. J. Mirocha. 1974. Biogenesis of zearalenone (F-2) by Fusarium roseum “graminearum.” Can. J. Microbiol. 20:531-534. [DOI] [PubMed] [Google Scholar]
- 34.Stob, M., S. Baldwin, J. F. Tuite, F. N. Andrews, and K. G. Gillette. 1962. Isolation of an anabolic, uterotrophic compound from corn infected with Gibberella zeae. Nature 196:1318. [DOI] [PubMed] [Google Scholar]
- 35.Swanson, S. P., R. A. Corley, D. G. White, and W. B. Buck. 1984. Rapid thin-layer chromatographic method for determination of zearalenone and zearalenol in grains and animal feeds. J. Assoc. Off. Anal. Chem. 67:580-582. [PubMed] [Google Scholar]
- 36.Watanabe, A., I. Fujii, U. Sankawa, M. E. Mayorga, W. E. Timberlake, and Y. Ebizuka. 1999. Re-identification of Aspergillus nidulans wA gene to code for a polyketide synthase of naphthopyrone. Tetrahedron Lett. 40:91-94. [Google Scholar]
- 37.Watanabe, A., Y. Ono, I. Fujii, U. Sankawa, M. E. Mayorga, W. E. Timberlake, and Y. Ebizuka. 1998. Product identification of polyketide synthase coded by Aspergillus nidulans wA gene. Tetrahedron Lett. 39:7733-7736. [Google Scholar]
- 38.Watanabe, C. M. H., D. Wilson, J. E. Linz, and C. A. Townsend. 1996. Demonstration of the catalytic roles and evidence for the physical association of type I fatty acid synthases and a polyketide synthase in the biosynthesis of aflatoxin B1. Chem. Biol. 3:463-469. [DOI] [PubMed] [Google Scholar]
- 39.Yang, G., M. S. Rose, B. G. Turgeon, and O. C. Yoder. 1996. A polyketide synthase is required for fungal virulence and production of the polyketide T-toxin. Plant Cell 8:2139-2150. [DOI] [PMC free article] [PubMed] [Google Scholar]