Abstract
Blackbody infrared radiative dissociation (BIRD) spectra of singly and doubly protonated bradykinin and its analogues are measured in a Fourier-transform mass spectrometer. Rate constants for dissociation are measured as a function of temperature with reaction delays up to 600 s. From these data, Arrhenius activation parameters in the zero-pressure limit are obtained. The activation parameters and dissociation products for the singly protonated ions are highly sensitive to small changes in ion structure. The Arrhenius activation energy (Ea) and pre-exponential (or frequency factor, A) of the singly protonated ions investigated here range from 0.6 to 1.4 eV and 105 to 1012 s−1, respectively. For bradykinin and its analogues differing by modification of the residues between the two arginine groups on either end of the molecule, the singly and doubly protonated ions have average activation energies of 1.2 and 0.8 eV, respectively, and average A values of 108 and 1012 s−1, respectively, i.e., the presence of a second charge reduces the activation energy by 0.4 eV and decreases the A value by a factor of 104. This demonstrates that the presence of a second charge can dramatically influence the dissociation dynamics of these ions. The doubly protonated methyl ester of bradykinin has an Ea of 0.82 eV, comparable to the value of 0.84 eV for bradykinin itself. However, this value is 0.21 ± 0.08 eV greater than that of singly protonated methyl ester of bradykinin, indicating that the Coulomb repulsion is not the most significant factor in the activation energy of this ion. Both singly and doubly protonated Lys-bradykinin ions have higher activation energies than the corresponding bradykinin ions indicating that the addition of a basic residue stabilizes these ions with respect to dissociation. Methylation of the carboxylic acid group of the C-terminus reduces the Ea of bradykinin from 1.3 to 0.6 eV and the A factor from 1012 to 105 s−1. This modification also dramatically changes the dissociation products. Similar results are observed for [Ala6]-bradykinin and its methyl ester. These results, in combination with others presented here, provide experimental evidence that the most stable form of singly protonated bradykinin is a salt-bridge structure.
Introduction
Tandem mass spectrometry (MS/MS) has become a powerful method for the structural elucidation of molecules, particularly those present in complex mixtures and/or at trace levels.1 With the development of ionization techniques, such as matrix assisted laser desorption ionization2 and electrospray ionization,3 extension of tandem mass spectrometry to large biomolecules has undergone rapid growth. A variety of dissociation methods have been successfully applied to large ions, including collisional activation,4 photodissociation with both IR5 and UV6 photons, and surface induced dissociation.7 Extensive sequence specific fragmentation can be obtained with these methods, even when applied directly to large DNA8,9 and protein ions4,10 with molecular masses above 10 000 Da. Although the information provided in these dissociation experiments is usually insufficient to provide complete sequences of these large ions, the application of these types of measurements for rapidly obtaining information about binding sites or location of mutations in biomolecules appears quite promising.11
Critical to the success of MS/MS is the ability to relate the fragmentation observed in a dissociation spectrum back to the original structure of the ion. A powerful arsenal of techniques including various spectroscopies,12 high pressure MS,13 ion–molecule chemistry,14 computational methods,15 etc., have greatly improved our understanding of the energetics and ion structures involved in dissociation processes of small ions. The information provided by these methods has ultimately made MS a more useful structural tool.
Despite the large effort in developing and using MS/MS as a structural tool for biomolecules, significantly less information about the structure and dissociation processes of larger biomolecule ions is known. Larger ions provide a difficult challenge to many of the conventional structural methods, such as spectroscopy and computational chemistry. Innovative mechanistic studies have been done to understand the fragmentation of biopolymers, and a variety of mechanisms for the formation of sequence specific ions for both peptides16,17 and DNA8 have been proposed. Elegant labeling studies have provided information about some of these process.18 This has been particularly useful in understanding some of the rearrangement reactions commonly observed for peptide ions. For example, from dissociation of [18O2]-labeled peptides, Gaskell and co-workers deduced a mechanism for loss of the C-terminus amino acid minus OH18a as well as multiple dehydration pathways.18c Several studies have suggested that the conformation of the ion may play an important role in the dissociation process.19 For large gas-phase protein ions, multiple distinct conformations have been observed using deuterium exchange,20 collisional cross section,21 and proton transfer reactivity measurements.22
In addition to mechanistic studies, information about the relative energetics of large ion dissociation has been inferred from effects of changes in ion internal energy. Effects of ion activation by low23 and high energy24 collisions and photodissociation with different wavelengths25 as well as collision energy in SID26 have been investigated. RRKM calculations have been compared to data obtained from low-energy CAD27 and laser desorption with subsequent chemical ionization28 to provide a qualitative understanding of the energetics and dynamics of the dissociation processes. However, the principle limitation in extracting energetic information from these types of measurements is that the internal energy distribution of the ion population is poorly characterized.
We recently demonstrated that information about the activation energies and dynamics of dissociation processes of large biomolecule ions can be obtained using blackbody infrared radiative dissociation (BIRD).29 With this method, trapped ions are activated by interaction with the blackbody radiation field inside the heated vacuum chamber of a Fourier-transform mass spectrometer at low pressures (<10−8 Torr). From the temperature dependence of the rate constants for unimolecular dissociation, Arrhenius activation parameters in the zero-pressure limit can be obtained. This method was first demonstrated by McMahon and Dunbar30 on small weakly bound cluster ions. From the measured values of activation energy, combined with calculations using the modified Tolman theorem, Dunbar demonstrated that activation energies but not dynamics of dissociation can be obtained for small ions.31 For larger ions, information about the dissociation dynamics can be inferred directly from the activation parameters.29 Dissociation efficiencies of as high as 100% can be obtained, even for ions as large as ubiquitin (8.6 kDa). The BIRD spectra contain structurally informative y and b fragments (nomenclature of Roepstorff32 ) as well as ions corresponding to loss of small neutral molecules such as ammonia and water. This type of fragmentation is characteristic of low energy dissociations, analogous to what is typically observed with low fluence IRMPD5b or SORI-CAD.4c
Previously, we reported activation energies and pre-exponential factors for the dissociation of singly and doubly protonated bradykinin (Arg-Pro-Pro-Gly-Phe-Ser-Pro-Phe-Arg) ions using BIRD.29 Here, these values for a series of bradykinin analogues are measured. We find that the activation parameters differ dramatically, even for formation of similar fragment ions, and are a highly sensitive probe of structure. The effects of intramolecular electrostatic interactions in the doubly protonated ion are directly reflected by these parameters. The role of conformation on the dissociation of these ions is discussed, and the first experimental evidence for a stable salt-bridge structure of a gaseous peptide ion is presented.
Experimental Section
Materials.
All peptides, except [Ala6]-bradykinin, were purchased from Sigma Chemical Company (St. Louis, MO) and used without further purification. [Ala6]-bradykinin was synthesized by Dr. David King (Department of Molecular and Cell Biology, University of California, Berkeley). Methyl esters of bradykinin, [Ala6]-bradykinin, des-Arg1-bradykinin, and des-Arg9-bradykinin were prepared by acid-catalyzed esterification, by adding approximately 2 mg of peptide to 5 mL of dry methanol containing 0.5% sulfuric acid. These solutions were allowed to stand at room temperature for 24 h. Methylation is expected to occur exclusively at the C-terminus, the most acidic site.33 This is consistent with the observed fragmentation for these compounds. Methylation of the serine hydroxyl group is significantly less favored33b and does not occur to a measurable extent as indicated by the methylation of [Ala6]-bradykinin in which the hydroxyl group is not present. Ions were formed by electrospraying directly from these solutions. All other peptides were electrosprayed from a 59.5%/39.5%/1.0% water/methanol/acetic acid solution at a concentration of ~10−5 M. A flow rate of ~2.0 μL/min was used for all solutions.
Mass Spectrometry.
Experimental measurements were performed on a 2.7-T external ion source ESI-FTMS instrument described elsewhere.29,34 This instrument was modified by adding liquid nitrogen traps to both diffusion pumps in the first two high vacuum stages. This modification reduces the background pressure of diffusion pump oil (Santovac 5) in the vacuum chamber which can interfere with these experiments at higher temperatures. Nitrogen gas was introduced through a pulsed valve to a pressure of approximately 10−6 Torr during ion accumulation (3–12 s) to improve ion trapping efficiency; these parameters were optimized for each experiment to maximize ion signal. Pressure was measured with an ion gauge that was previously calibrated by measuring the proton transfer rate between C2H5+ and NH3, which has a known rate constant of 2.0 × 10⁻⁹ cm3/molecule·s.35 A mechanical shutter, controlled by an electromagnetic solenoid, allows ions to pass through the ion injection system to the cell only during the ion accumulation event. Individual charge states are isolated using SWIFT36 and are stored/reacted for times ranging from 0 to 600 s. Data are acquired using an Odyssey data system (Finnigan-FTMS); a radio frequency sweep rate of 3200 Hz/μs is used to excite ions prior to detection.
The portion of the main vacuum chamber which contains the FTMS cell, located within the solenoid of the superconducting magnet, is heated using a resistive heating blanket. The temperature of this heating blanket is controlled with an Omega proportional temperature controller (Stamford, Ct., Model 4002A) to within ±0.5 °C. The vacuum chamber on both ends of the magnet are separately heated to within ±5 °C of the central portion. At 200 °C, the base pressure of the instrument is ~6 × 10⁻⁹ Torr. The temperature inside the main chamber is measured with two copper-constantan thermocouples, each mounted adjacent to an excite plate of the FTMS cell. One of these thermocouples was previously calibrated to a copper-constantan thermocouple placed directly in the center of the FTMS cell; this thermocouple was found to parallel the temperature in the center of the cell to within 2 °C over the temperature range 40–215 °C. All the temperatures reported here are calibrated to correspond to the temperature of the center of the cell. Typically, the temperature of the vacuum chamber is changed by less than 20 °C between kinetics measurements. The chamber is allowed to equilibrate to the new temperature, as indicated by the internal thermocouples, for a minimum of 2 h prior to starting measurements.
The dissociation spectra in the figures are taken from the kinetic data. The reaction delay and temperature for each spectrum were selected so that significant fragmentation is observed but some precursor ions remain; these values are reported in the figure captions for each spectrum. At higher temperatures and longer times, between 80 and 100% dissociation could be achieved for all molecular ions. This efficiency appears to be limited solely by the temperature and time frame of these experiments. The errors in the activation parameters reported in the tables are standard deviations obtained from a linear-least squares fit to the data. These values reflect the random error but do not account for any systematic deviations. Possible sources of the latter error would include nonuniform chamber temperature resulting in a deviation from a Planck blackbody distribution at a single temperature and differences in the relative detection efficiencies of the precursor and fragment ions. In cases where the internal energy distribution of the precursor ions is non-Boltzmann, the activation parameters will be lower than those measured in the high-pressure limit.
Molecular Modeling.
Molecular modeling calculations were performed using the InsightII/Discover molecular modeling suite of programs (Biosym Technologies, San Diego, CA), on an IBM RS/6000 computer. Protons in the doubly protonated bradykinin ion were fixed on the guanidine groups of the two terminal arginine residues. Both the CVFF and the second generation CFF91 force fields were used for molecular mechanics calculations to generate an ensemble of structures from which the lowest energy configurations were selected. All cross terms and anharmonicities were included in both force fields to compare the lowest energy structures found in each. Following an initial equilibration period of 10 ps at 800 K, a series of zero K structures were found with each force field by performing molecular dynamics for 10 ps at 800 K followed by gradual cooling to 200 K over a period of 4 ps. A step size of 1 fs was used for all simulations. The structure was then energy minimized to form a zero K structure. For the CFF91 and CVFF force fields 106 and 276 structures were generated, respectively. It has previously been observed that during high temperature conformational searches the peptide bond can easily undergo trans–cis conversions.37 To prevent this, an additional torsional restraint of 6 kcal/mol was included on each peptide bond except for proline which was allowed to undergo this conversion.
Because of the similarity in the lowest energy structures between the two force fields, dynamics were run only with the CVFF forcefield. Beginning with three different low energy structures, dynamics simulations were performed at 450 K for up to 11 ns, with 1 fs steps. The additional torsional restraints were removed for these simulations. Several intramolecular distances were monitored and saved at 200 fs intervals.
Results and Discussion
Blackbody Infrared Radiative Dissociation. Thermal Dissociation Kinetics.
For all precursor ions, plots of ln [M+]/[∑(M+ + F+)] vs time (M = precursor ion; F = fragment ions) are linear at long times indicating that these ions have reached a steady state and undergo unimolecular dissociation. From these data, rate constants (k) as a function of cell temperature are obtained. This is illustrated for two isomers, des-Arg1 and des-Arg9-bradykinin, which have significantly different dissociation kinetics (Figure 1) and dissociation pathways (Figure 2). For example, at 164 °C, des-Arg1 and des-Arg9-bradykinin have dissociation rate constants of 0.0058 and 0.035 s−1, respectively, nearly a 6-fold difference. This disparity becomes even larger at higher temperature; at 179 °C, a 15 °C increase, the rate constants are 0.014 and 0.098 s−1, a 7-fold difference. These data for des-Arg1-bradykinin have a zero y-intercept. This indicates that these ions have reached a steady state by the start of the reaction delay at all temperatures. Similar results were obtained for most of the other ions.
Figure 1.
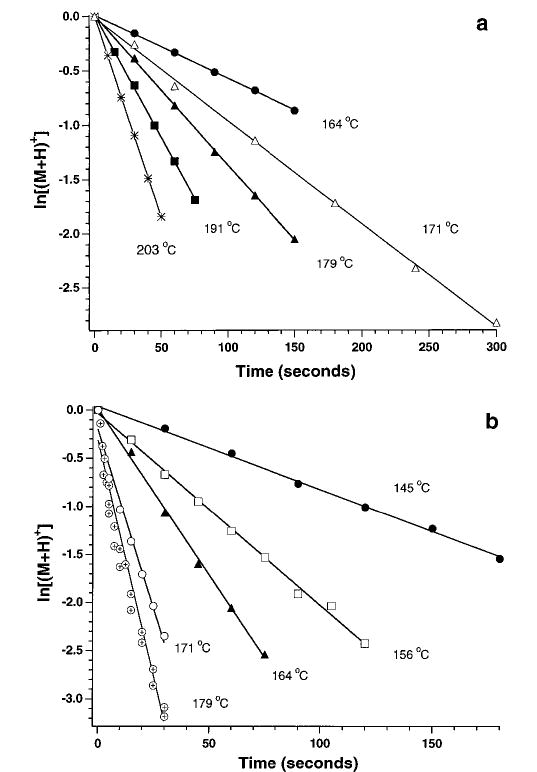
Data for the dissociation of (a) des-Arg1- and (b) des-Arg9-bradykinin fit to unimolecular kinetics at the temperatures indicated. The rate constants in order of increasing temperature are (a) 0.0058, 0.0095, 0.014, 0.023, 0.037 s−1 and (b) 0.0087, 0.020, 0.035, 0.066, 0.098 s−1.
Figure 2.
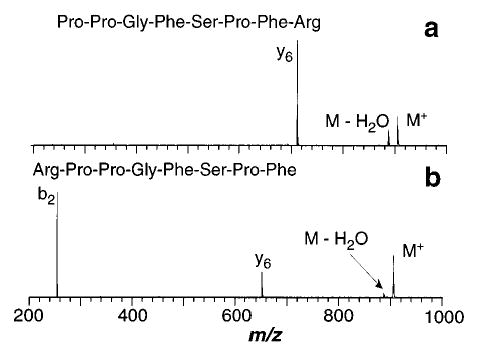
Blackbody infrared radiative dissociation spectra of singly protonated (a) des-Arg1-bradykinin with a reaction delay of 45 s and a cell temperature of 191 °C and (b) des-Arg9-bradykinin with a reaction delay of 10 s and a cell temperature of 179 °C.
However, kinetic data for some of the singly protonated ions have nonzero y-intercepts. A negative intercept is observed for des-Arg9-bradykinin at the higher temperatures (Figure 1b). Similar behavior has been observed for leucine enkephalin when a low pressure of collision gas is used to trap the ions. This suggests that the ions are introduced into the ion cell with an internal energy distribution which is greater than that corresponding to a steady-state distribution at the cell temperature. This indicates that the high pressure pulse of collision gas (N2) used to enhance ion trapping can significantly effect the internal energy of these ions. Similarly, different source conditions can influence the internal energy of the ions, although no obvious effect of different source conditions on the dissociation kinetics at early times was observed in these experiments.
As reported earlier,29 data for singly protonated bradykinin have a positive y-intercept or an induction period prior to the onset of dissociation (Figure 3). This does not appear to be due to the relatively high activation energy of this ion as no induction period is observed for Lys-bradykinin which has an even higher activation energy and a comparable pre-exponential (vide infra). This induction period was only observed for singly protonated ions that dissociate predominantly by loss of ammonia. It is possible that time may be required for these ions to isomerize to a structure that subsequently undergoes loss of NH3. All rate constants are obtained from times after this induction period.
Figure 3.
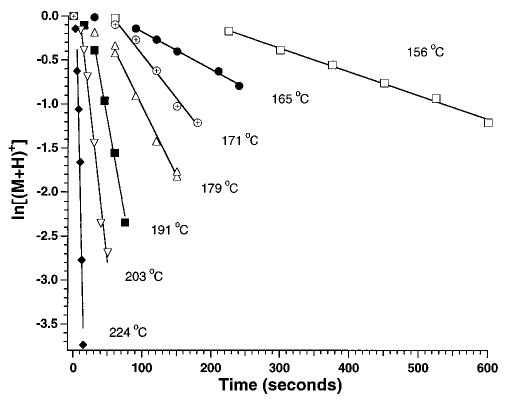
Data for the dissociation of bradykinin fit to unimolecular kinetics at the temperatures indicated. The rate constants in order of increasing temperature are 0.0027, 0.0042, 0.013, 0.016, 0.043, 0.068, and 0.32 s−1.
Pressure Dependence.
To confirm that, under the low pressure conditions of this experiment, ions are activated via absorption of blackbody photons and not through collisions with background neutral molecules, the pressure dependence of the rate constants for dissociation was investigated. For singly protonated bradykinin at 184 °C, k = 0.024 s−1 at a base pressure of 5 × 10⁻⁹ Torr. Increasing the pressure with nitrogen to a maximum pressure of 5 × 10⁻⁷ Torr had no measurable effect on this rate. Butane should be more effective at transferring internal energy into the ion. Butane introduced into the cell at a maximum pressure of 5 × 10⁻⁷ Torr again had no measurable effect on the dissociation rate. Measurement at even higher pressures was precluded by loss of ions, presumably due to increased magnetron motion over the long time scale of the experiment. These results clearly indicate that these ions are not significantly activated via collisions with neutral molecules at the low cell pressures maintained in this experiment. Results reported earlier for the pressure dependence of the dissociation rates of doubly protonated ions of bradykinin indicated that the rate constant decreased at pressures above 2 × 10⁻⁷ Torr. There is no obvious reason why thermal collisions would deactivate these ions. The most likely reason for this behavior is due to loss of fragment ion signal; the kinetic energy released due to Coulomb repulsion between the two charged products would result in excitation of the magnetron motion and thereby reduce the detection efficiency for these ions resulting in an apparent decrease in the dissociation rate.
In contrast, the dissociation rate of smaller weakly bound ions shows a pressure dependence at pressures above the low 10−8 Torr range.30,31 The significantly higher threshold for a pressure dependent rate constant for the larger ions reported here is consistent with the significantly higher rate of energy deposited from blackbody photon absorption vs collisional activation for these large ions (vide infra). Intermediate size ions, such as the proton bound dimer of N,N-dimethylacetamide, show a slight pressure dependence above 1 × 10⁻⁷ Torr,38 but this effect is not nearly as evident as has been reported with smaller, more weakly bound ions.
Arrhenius Parameters in the Zero-Pressure Limit.
From a plot of ln(k) vs 1/T, Arrhenius activation parameters in the zero-pressure limit are obtained. Examples of this data for several of the precursor ions are shown in Figure 4. The fits to this data have correlation coefficients exceeding 0.97 for all ions. The activation energy and pre-exponential factor for bradykinin and all analogues investigated in this study are reported in Table 1. To understand the precise meaning of the activation energies and pre-exponential factors obtained in these experiments, the relative rates of ion activation, deactivation, and dissociation must be known. We provide a brief discussion of these values with respect to large ions; a more detailed analysis will be reported elsewhere.39
Figure 4.
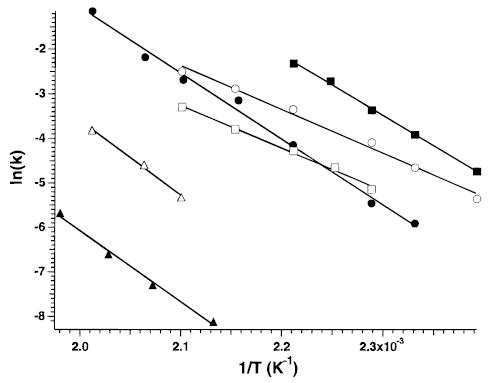
Arrhenius plot for the dissociation of singly protonated bradykinin (•), des-Arg1-bradykinin (□), des-Arg9-bradykinin (▪), methyl ester of des-Arg9-bradykinin (▵), Lys-bradykinin (▴), and doubly protonated bradykinin (○).
Table 1.
Measured Zero-Pressure Arrhenius Activation Parameters for the Dissociation of Singly Protonated Bradykinin and Its Variantsa
| peptide | activation energy (eV) | frequency factor (s−1) | major fragments | minor fragments |
|---|---|---|---|---|
| [Ala6]-bradykinin | 1.1 | 1011 | M+ – NH3 | y7, b2, b8, y6, y5, y8 |
| bradykinin | 1.3 | 1012 | M+ – NH3 | |
| des-Arg1-bradykinin | 0.82 | 107 | y6 | M+ – H2O |
| des-Arg9-bradykinin* | 1.2 | 1012 | b2 | y6, M+ – H2O |
| des-Pro2-bradykinin | 1.1 | 1011 | M+ – NH3 | y7 |
| [Lys1]-bradykinin | 1.0 | 109 | y7 | M+ – H2O, y6, y5 |
| Lys-bradykinin | 1.4 | 1012 | M+ – H2O, M+ – 60 | M+ – H2O, RP+, b9, y6, y5 |
| [Thr6]-bradykinin* | 1.2 | 1012 | M+ – NH3 | M+ – 60, y7, y6, y5, b2 |
| methyl ester of [Ala6]-bradykinin | 0.76 | 107 | M+ – NH3, M+ – MeOH | y7, y8, b8, M+ – 60 |
| methyl ester of bradykinin | 0.61 | 105 | M+ – MeOH | M+ – NH3, y7, c5, b8, y8, y4, b2 |
| methyl ester of des-Arg1-bradykinin | 0.94 | 107 | M+ – H2O | |
| methyl ester of des-Arg9-bradykinin | 1.3 | 109 | M+ – H2O | b2 |
Activation energies have standard deviations between 0.03 and 0.1 eV. Those processes for which calculations indicate the measured Arrhenius parameters are lower than the “high-pressure” limit values within the error of the experiment are indicated by an asterisk.
In the high pressure limit of the classical Lindemann–Hinshelwood mechanism for unimolecular dissociation, the rates of ion activation and deactivation by collisions are much faster than the rate of reaction or dissociation, that is, k1 , k−1 >> kd (reaction Scheme 1).
Scheme 1.

Implicit in the derivation of unimolecular rate constants from this mechanism is the assumption that the distribution of energy following a collision is completely randomized and that large amounts of energy are transferred during each collision (the strong collision approximation). The latter assumption becomes less valid when applied to large reactant species in a bath of small molecules. In this high-pressure regime and in the limit of the strong collision approximation, the internal energy of the ion, ABCD+, can be described by a Boltzmann distribution. Activation energies obtained from an Arrhenius plot are an approximate measure of the true dissociation threshold energy40a which equals the dissociation energy in the absence of a reverse activation barrier. At lower pressures, the rates of activation/deactivation become slower, and the rate of dissociation to produce AB+ can become competitive with the rate of activation. This results in a perturbation of the internal energy of the ion population away from a Boltzmann distribution. This is called the “fall-off region.” Extraction of energetics from reactions in this region requires accurate knowledge of collisional energy transfer, a process which is difficult at best to model.
As Dunbar and McMahon30 have demonstrated for small weakly bound cluster ions, it is possible to reduce the pressure in an FTMS cell such that collisions no longer play an important role in the activation of ions. Rather, ions absorb energy from the walls of the vacuum chamber by interaction with the blackbody field. For small weakly bound systems, the rate of activation by blackbody photons is slow. For example, Dunbar et al.30b calculated that the radiative rates for absorption and emissions for (H2O)2Cl− clusters with internal energies at the dissociation threshold are 3.4 and 26 s−1, respectively. In contrast, the microcanonical rates of dissociation of these simple ions when activated above the threshold energy is fast (k > 107 s−1). In this limit, where k−1 << kd, ions dissociate rapidly whenever they absorb a photon which raises their internal energy above the dissociation threshold energy. As Dunbar31b has reported, the internal energy distribution of the ion population can be estimated by a Boltzmann distribution which is truncated near the dissociation threshold. The true dissociation threshold energy can then be obtained from the measured Arrhenius activation energy by adding in a value corresponding to the average energy of the unreacted species as well as other minor corrections. For these small systems, the kinetics reflect only the rate of ion activation through the absorption of blackbody photons since this is the rate limiting step. In this limit, the pre-exponential factor contains information only on how fast a system absorbs photons and contains no dynamical information about the ion dissociation process itself.
For slightly larger ions with higher activation energies, even the size of proton bound dimers of N,N-dimethylacetamide, this analysis appears to break down.38 This is due to the rate of activation becoming competitive with the rate of dissociation. In this region, the kinetics reflect both the rates of photon absorption as well as the rates of dissociation, analogous to the fall-off region of the pressure dependent ion activation.
As the size of an ion increases, the rate of photon absorption increases. For polymers such as peptides and proteins, this rate will increase roughly linearly with ion size. However, for a fixed internal energy, the rate of ion dissociation decreases with ion size, reflecting the higher number of degrees of freedom in larger systems. The effect of increased degrees of freedom on ion dissociation has been well documented.40 At a given temperature, the internal energy will increase with the size of an ion. For reactions of structurally similar molecules that can be characterized by similar transition states, the Boltzmann weighted unimolecular rate constant is independent of molecular size at a given temperature. Thus, for larger ions, the rate of ion activation through the absorption of blackbody photons should become faster than the rate of ion dissociation. That is, k1, k−1 >> kd. Thus, for these large ions, one is in the regime of the high-pressure limit where the internal energy of the ion population should be characterized by a Boltzmann distribution. In this situation, the activation energies and pre-exponential factors measured in these experiments will approach those values measured in the high-pressure limit. That is, the activation energy will be approximately equal to the threshold dissociation energy,41 Eo, and the pre-exponential factor will reflect only the dissociation dynamics.
We will report elsewhere, a detailed analysis of the relative size ions where this analysis should apply. However, it is clear from the data reported here that the pre-exponential factors do indeed reflect the dissociation dynamics and not simply the rates of photon absorption. For example, singly protonated des-Arg1 (Ea = 0.82 eV, A = 107 s−1) and des-Arg9-bradykinin (Ea = 1.2 eV, A = 1012 s−1) have the same chemical formula and thus the same number of degrees of freedom. The vibrational frequencies and transition dipole moments of these ions should be comparable. Because the blackbody distribution is relatively broad, minor shifts in vibrational frequencies should not significantly influence the absorption rate. Thus, the photon absorption rate is expected to be nearly the same for both these ions. Yet, both the activation energies and frequency factors differ considerably. Similarly, the frequency factor for des-Arg9-bradykinin and its methyl ester differ by a factor of over 1000 despite the fact that they have nearly the same activation energy. Again, these ions should have nearly identical photon absorption rates so that differences in the frequency factors should directly reflect differences in the dissociation dynamics of these ions. These results clearly show that the frequency factor for formation of peptide fragment ions, e.g., b or y, can differ by over five orders of magnitude. Thus, without adequate knowledge of the frequency factor for a particular dissociation process, attempts to relate the energy deposited into an ion to the critical dissociation energy can result in significant errors.
It is important to reiterate that the absolute values of the Arrhenius parameters measured in these experiments are equal to those in the high-pressure limit only if the internal energy of a population of these ions is characterized by a Boltzmann distribution. Calculations based on the discrete value master equation formalism40a using the generic peptide (ala-gly)n as a model as well as experimental evidence indicates that the BIRD kinetics if the 11+ and 5+ charge states of ubiquitin (8.6 kDa) reflect the “high-pressure limit” values, i.e., these ions, under the experimental conditions employed, have equilibrated with the blackbody radiation field and have internal energies that can be characterized by a Boltzmann distribution.39 Similar calculations have been performed to model the dissociation process observed here. These calculations indicate that most of these processes are also approaching or are in the “high-pressure limit” within the experimental error. The dissociations that our calculations indicate may not be in this limit are noted in Tables 1 and 2. In these cases, the measured Ea and A will be lower than the high-pressure limit values. The modeling of these dissociation processes will be reported elsewhere.42
Table 2.
Measured Zero-Pressure Arrhenius Activation Parameters for the Dissociation of Doubly Protonated Bradykinin and Its Variantsa
| peptide | activation energy (eV) | frequency factor (s−1) | major fragments | minor fragments |
|---|---|---|---|---|
| [Ala6]-bradykinin | 0.74 | 107 | b2 | b3 – H2O, M2+ – H2O, y7 |
| bradykinin | 0.84 | 108 | b2 | b3 – H2O, M2+ – H2O, y7 |
| des-Pro2-bradykinin | 0.77 | 107 | b2 | M2+ – H2O, y6 |
| Lys-bradykinin* | 1.2 | 1010 | RP+ | M2+ – H2O, RPP+ – H2O, b2, y7 |
| methyl ester of bradykinin | 0.82 | 106 | M2+ – H2O | b2, b3 – H2O |
Activation energies have standard deviations between 0.04 and 0.1 eV. Those processes for which calculations indicate the measured Arrhenius parameters are lower than the “high-pressure” limit values within the error of the experiment are indicated by an asterisk.
Singly Protonated Ions. Dissociation Pathways and Energetics.
For the singly protonated ions, the dissociation pathways and activation parameters are highly sensitive to small changes in ion structure (Figures 2, 5, 6, 8, and 9). For example, bradykinin and [Thr6]-bradykinin differ by only a methyl group in the side chain of residue 6 (R = –CH2OH vs –CH(OH)-CH3). These ions have similar activation parameters, but the [Thr6]-bradykinin has a large fragment ion at (M – 60)+ (Figure 5b), a process not observed for bradykinin itself. This suggests that the side chain of serine, presumably the hydroxyl group, interacts with the charge site in these ions. The added methyl group may create a steric hindrance thereby destabilizing this interaction slightly resulting in a small lowering of the activation energy from 1.3 to 1.2 eV. Replacing residue 6 with alanine has a relatively small, but again, easily measured effect on the dissociation parameters and on the observed fragmentation (Figure 5c). Similarly, removal of the proline in position 3 has a small, but measurable effect on the activation parameters, but no measurable effect on the dissociation pathways.
Figure 5.
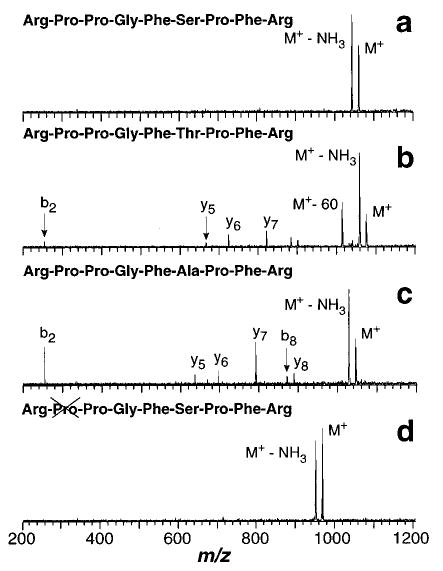
Blackbody infrared radiative dissociation spectra of singly protonated (a) bradykinin (45 s reaction delay), (b) [Thr6]-bradykinin (45 s reaction delay), (c) [Ala6]-bradykinin (45 s reaction delay), and (d) des-Pro2-bradykinin (15 s reaction delay) measured at 191 °C.
Figure 6.
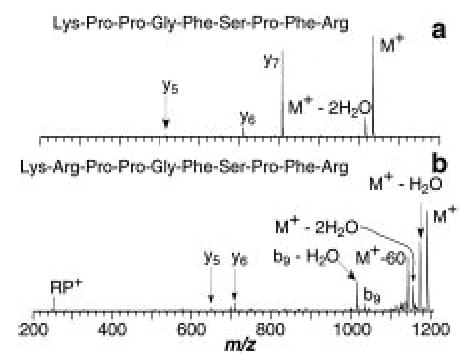
Blackbody infrared radiative dissociation spectra of singly protonated (a) [Lys1]-bradykinin (45 s reaction delay at 191 °C) and (b) Lys-bradykinin (240 s reaction delay at 203 °C). R ≡ arginine, P ≡ proline.
Figure 8.
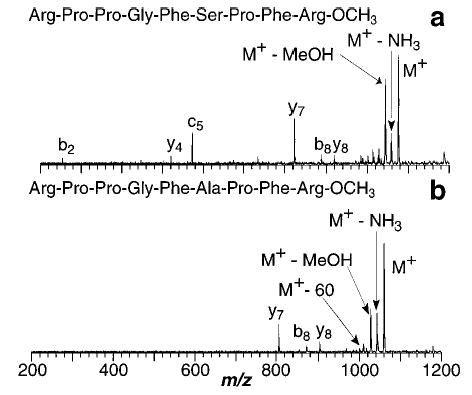
Blackbody infrared radiative dissociation spectra of the singly protonated (a) methyl ester of bradykinin and (b) methyl ester of [Ala6]-bradykinin measured at 197 °C with a 15 s reaction delay.
Figure 9.
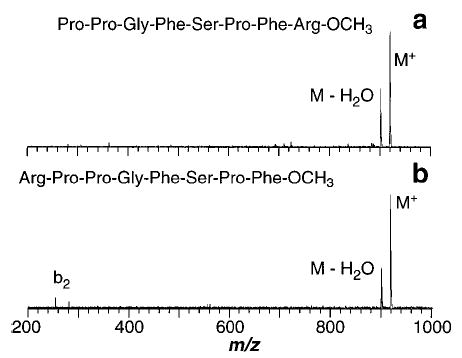
Blackbody infrared radiative dissociation spectra of the singly protonated (a) methyl ester of des-Arg1-bradykinin (420 s reaction delay at 219 °C) and (b) methyl ester of des-Arg9-bradykinin (480 s reaction delay at 215 °C).
The lowest energy dissociation process of bradykinin on the kinetic time scale of these experiments is loss of 17 Da, which presumably corresponds to loss of NH3. The most likely source for this loss is one of the two arginine residues present on either end of this molecule. Surprisingly, BIRD spectra of des-Arg1 and des-Arg9-bradykinin (Figure 2) show that neither of these ions lose NH3, indicating that this is not a simple loss involving only one of the terminal arginine residues. These ions dissociate to form y6 and b2/y6 ions, respectively; loss of H2O is observed for both. For des-Arg1-bradykinin, the charge is retained by the C-terminal fragment, consistent with the presence of the basic arginine residue on this fragment which should compete effectively for the proton due to its high basicity. The appearance of both b2 and y6 fragments for des-Arg9-bradykinin is somewhat surprising in that both ends of the molecule appear to be competitive for the proton. The gas-phase basicity (GB) of an individual arginine molecule is ~237.4 kcal/mol.43 The most basic amino acid in the y6 fragment is proline which has an individual GB of 221.9 kcal/mol.44 The presence of solvating groups is known to increase the basicity of a given protonation site.45–47 The competition for charge between the b2 and y6 fragments indicates that the transition state for dissociation is likely to have the molecule wrapping around and solvating the charge to increase the basicity of the C-terminal fragment which can then effectively compete for the charge with the arginine containing b2 ion. Similar results were observed previously in the BIRD spectra of leucine enkephalin-Lys.29 In these spectra, a b5 ion is observed which corresponds to loss of the basic amino acid lysine as a neutral; the most basic site on the b5 ion is the N-terminus, which, in the absence of self-solvation, is less basic than lysine. These results indicate that arguments about the protonation sites in dissociation complexes, which are based on the GB of the individual amino acids, must be approached with some caution since charge solvation can influence the basicity of these sites significantly.
For [Lys1]-bradykinin (N-terminus arginine replaced by lysine), loss of water is the primary fragment ion; no loss of NH3 is observed (Figure 6). From the dissociation spectra of all the bradykinin analogues investigated in this study, it is readily apparent that both arginine residues, one on the C-terminus and one of the N-terminus, are required to produce the loss of NH3. This suggests that the transition state for dissociation of this ion has a conformation in which both arginine residues interact to produce the observed loss of NH3. The A factor for this process is 1012 s−1. This value is indicative of a rearrangement as is required for loss of NH3. This value is comparable to, for example, that for the six-membered ring rearrangement of ethyl formate.48 In contrast, direct bond cleavages of small molecular ions have much higher values, typically 1015–1017 s−1.
The A factors reported here range from 105 to 1012 s−1. A value of 105 is unusually small compared to any values of which we are aware. A lower value than the “high-pressure” limit value can occur if the higher energy tail of the Boltzmann distribution is depleted.31b However, our calculations indicate that this is not the case for most of these dissociation processes.42 A value of 1012 s−1 reflects a relatively simple rearrangement process or a relatively “loose” transition state by comparison to the other dissociation processes observed here. This indicates that the conformation of the transition state and reactant ions around the portion of the ion involved in the dissociation is similar. In contrast, a value of 105 s−1 indicates a complex dissociation process involving major structural changes, with the probability of the reactant ion finding the necessary transition state structure extraordinarily low.
Note that Lys-bradykinin has two arginine residues but does not lose NH3 (Figure 6b). This ion falls apart predominantly by loss of H2O and loss of 60 Da corresponding to loss of the arginine side chain. Its relatively high activation energy of 1.4 eV is consistent with the additional basic residue creating a more stable ion. This phenomenon has been reported previously by Wysocki and co-workers who found that peptides with many basic sites require higher threshold collision energies to produce fragment ions by surface induced dissociation.26
Evidence for a Salt-Bridge Structure.
In solution, peptides are known to exist in their zwitterionic form (within a range of pH). In the gas phase, charge separation is destabilized by the absence of solvation from the surrounding media. Both experimental results49 and ab initio molecular orbital calculations50 indicate that glycine does not exist as a zwitterion in the gas phase. Recently, Beauchamp and co-workers51 have reported evidence that gas-phase H/D exchange can proceed through formation of a salt-bridge intermediate. Calculations at the PM3 level indicate that formation of a salt-bridge structure between deprotonated betaine, (CH3)3N+—CH2-CO2−, and protonated ammonia is exothermic by 18 kcal/mol. However, similar calculations indicate that the zwitterion form of peptide ions such as (Gly)n (n = 3–5) is not stable, in agreement with H/D exchange results.51
For bradykinin, the presence of two highly basic arginine residues should enhance the possibility of salt-bridge formation (Figure 7). Recent calculations by Beauchamp and co-workers52 suggest that a salt-bridge structure in which a proton is transferred from the carboxylic acid to one of the arginine residues is the most stable form of this ion. Bowers and coworkers53 have measured the ion mobility of singly protonated bradykinin ions and found that these measurements are consistent with a tightly folded ion conformation in which the ion folds up around the charge. However, the authors were not able to distinguish if a salt-bridge occurs in these ions.
Figure 7.
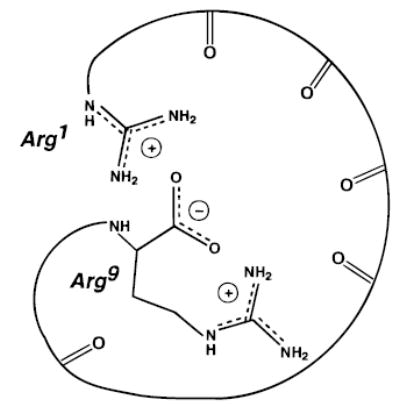
Illustration of a salt-bridge for singly protonated bradykinin in which both arginines are protonated and the C-terminus is deprotonated.
To test whether singly protonated bradykinin exists as a salt-bridge structure under our experimental conditions, methyl esters of bradykinin and several analogues were investigated (methyl esters eliminate the possibility of salt bridge formation). There are two possible sites that can readily donate a proton to an arginine residue; serine-6 and the C-terminus carboxylic acid. The latter is significantly more acidic and should be the preferred site.49,54 [Ala6]-bradykinin (serine replaced by alanine) has a slightly lower Ea and A factor than bradykinin, but loss of NH3 is still the predominant fragment (Figure 5c). The results for [Thr6]-bradykinin (addition of a methylene group to the side chain) discussed previously indicates that the hydroxyl group likely interacts with the charge site and does have a slight influence on the dissociation process. Nevertheless, no large change is observed by modification or removal of the serine hydroxyl group indicating that this group is not directly involved in a salt-bridge.
In contrast, methylation of the C-terminus carboxylic acid has a tremendous effect on the activation parameters as well as the observed fragmentation. For the methyl ester of bradykinin, the Ea is lowered from 1.3 to 0.6 eV, and A is reduced from 1012 to 105 s−1. Loss of NH3 is now a minor process with loss of methanol and formation of the y7 ion being the major processes (Figure 8a). Thus, methylation lowers the Ea by 0.7 eV, decreases the value of A by a factor of 107, and dramatically changes the observed fragmentation. The small pre-exponential factor indicates that the methyl ester dissociates through a “tight” transition state. Similar results are observed when the C-terminus of [Ala6]-bradykinin is methylated. The Ea and A for this ion are 0.7 eV and 107 s−1, respectively; loss of methanol and formation of the y7 ion are major processes, and the loss of NH3 is significantly lowered (Figure 8b).
The dramatic reduction in the activation energy and A factor of these methylated species as well as the change in observed fragmentation could be due to three possible factors. The primary fragment ion corresponds to loss of methanol which could simply be due to a lower energy dissociation process for loss of this neutral product. However, methyl esters of des-Arg1 and des-Arg9-bradykinin do not undergo loss of methanol (Figure 9). They both exclusively lose water; no b2 or y7/y6 ions are observed. The activation energies for both these ions are 0.1 eV higher than their unmethylated counterparts. This suggests that loss of methanol is not an intrinsically low energy process. A second possibility is that the C-terminus is involved in solvating the charge; changes in this group would then have some effect on the structure of this ion. The lowest energy structure reported by Bowers53 indicates that the carbonyl oxygens of the peptide backbone are the primary functional groups involved in this solvation. Thus, methylation of the C-terminus should not have such a dramatic influence on the dissociation processes if its only role is simple charge solvation.
The most plausible explanation for our results is that methylation eliminates the salt-bridge form of the parent ion which results in another ion conformation that is destabilized relative to the transition state for dissociation. The transition state is likely to be roughly the same since some loss of NH3 is observed for the methylated ion, although there obviously could be other pathways for this loss. Thus, we conclude that the lowest energy structure of bradykinin is a salt-bridge in which both arginine residues are protonated and interact with a negatively charged carboxylate of the C-terminus (Figure 7). A salt-bridge structure is consistent with the high A factor for bradykinin indicating that the two arginine residues, which are apparently required for the loss of NH3, interact in both the reactant and transition state structures. The dramatically lower A factor for the methylated species indicates that the most stable structure for this ion is one in which the two arginine residues do not interact. This is the first experimental evidence for a stable salt-bridge form of a peptide in the gas phase.
Our results also indicate that the salt-bridge structure is stable at temperatures of up to 220 °C. The stability of this structure is undoubtedly enhanced by two factors. First, the presence of two highly basic residues reduces the energy required to transfer a proton from the carboxylic group. Second, the relatively large size of this ion makes possible a folded structure in which the charges are solvated by other polarizable groups in the ion, such as the carbonyl oxygens of the backbone, the side chain hydroxyl group of serine, and the aromatic side chain of phenylalanine. Thus, in the absence of any solvent molecules, the ion provides its own solvation “sphere” or environment around the charge.
It is interesting to compare the results obtained with BIRD of bradykinin, des-Arg9-bradykinin, and their methyl esters to those obtained by metastable decomposition measured by Gaskell and co-workers.18a The predominant fragment in the metastable decomposition spectrum of bradykinin is (b8 + OH)+. This product was attributed to rearrangement and retention of one of the C-terminus oxygens with corresponding loss of (Arg – OH). Little if any loss of NH3 is observed. The different fragmentation process observed with BIRD is attributable to the significantly longer time frame of the BIRD experiment which favors even lower energy fragmentation. The abundance of the (bn−1 + OH)+ ion in the metastable ion spectra of des-Arg1-bradykinin and the methyl ester of bradykinin was found to be greatly reduced over that of bradykinin, indicating that both the C-terminal carboxyl group and residues remote from this site influence this dissociation. This observation is consistent with our results which indicate that a salt-bridge structure is the most stable form of this ion.
Doubly Protonated Ions. Dissociation Pathways.
The fragmentation processes for the doubly protonated ions differ dramatically from those of their singly protonated counterparts. For ions that differ by changes to the sequence between the two terminal arginine residues, the principle dissociation products are the b2 and y7/y6 complementary ions as well as loss of water (Figure 10). For Lys-bradykinin, some b2 ions are observed, but the most abundant ion corresponds to an internal fragment, (Arg-Pro)+ (Figure 11a). This may be due to an unusually high stability for this ion. For methylated bradykinin, loss of water is the primary product (Figure 11b). No loss of NH3 is observed for any of the doubly protonated ions. This is consistent with the proposed mechanism for this loss which requires both arginine residues to interact. Such a conformation would be highly destabilized by the Coulomb repulsion between the two charges.34,47,55
Figure 10.
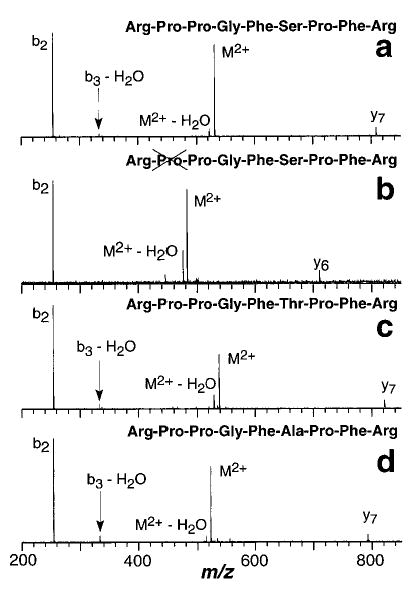
Blackbody infrared radiative dissociation spectra of doubly protonated (a) bradykinin, (b) des-Pro2-bradykinin, (c) [Thr6]-bradykinin, and (d) [Ala6]-bradykinin measured at 191 °C with a 15 s reaction delay.
Figure 11.
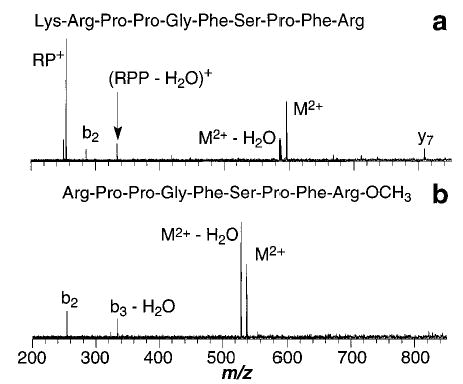
Blackbody infrared radiative dissociation spectra of doubly protonated (a) Lys-bradykinin (45 s reaction delay at 210 °C) and (b) methyl ester of bradykinin (180 s reaction delay at 215 °C). R ≡ arginine, P ≡ proline.
The complementary y and b ions are formed in equal abundance. No further dissociation of these ions was apparent. Thus, the lower abundance of the y7/y6 than of the b2 ions in the BIRD spectra (Figure 10) indicates a significant detection bias for the lower mass ions under these experimental conditions.56 Multiplying the abundance of the y7 ion of bradykinin by 7 so that its abundance roughly equals the abundance of the b2 ion results in a 22% increase in the reported rate constants. However, this does not significantly affect the temperature dependence of the rate constants; the reported activation energy increases by less than 3% with this correction. Since the Arrhenius activation parameters are the principle values of interest, not the absolute value of the rate constants, no correction for the ion detection efficiency was made.
Activation Parameters.
The values of Ea and A for all doubly charged ions are lower than their singly charged counterparts with only one exception. Doubly protonated bradykinin has an activation energy of 0.84 eV and an A of 108 s−1. Minor changes in the sequence between the two arginine residues have a relatively minor effect on both these values which range from 0.74 to 0.84 eV and 107–108 s−1, respectively (Table 2). For these ions, the addition of a second charge results in an average lowering of the Ea and A by 0.4 eV and more than a factor of 104, respectively. The low A indicates that these ions dissociate via a tight transition state which is not significantly influenced by the identity of the intervening residues.
The values of Ea and A for Lys-bradykinin are substantially higher than for the other doubly protonated ions with values of 1.2 eV and 1010 s−1, respectively. The Ea was also the highest of the singly protonated ions (1.4 eV). The addition of a second charge has a much smaller effect on lowering the dissociation energy than for the other ions discussed above. Again, the addition of the basic residue appears to stabilize the precursor ion with respect to dissociation, possibly by solvating the charge on the N-terminus more effectively thereby reducing its influence on the ion dissociation (vide infra).
A striking exception to the charge-induced lowering of the activation energy and A factor is observed for the doubly protonated methyl ester of bradykinin which dissociates primarily by loss of water. The Ea and A factor for this process are 0.82 eV and 106 s−1, respectively. These values are comparable to the other doubly protonated ions that differ by internal changes to the sequence. However, the Ea and A factor of the singly protonated methyl ester of bradykinin, which dissociates by loss of methanol, are 0.61 eV and 105 s−1, respectively. Thus, the Ea for dissociation of the doubly protonated ion is actually higher than that of the singly protonated ion, despite the added Coulomb repulsion between charges. The similar activation parameters for doubly protonated bradykinin and its methylated counterpart indicate that methylation does not perturb the structure of the doubly protonated ion as significantly as it does for the singly protonated ion, although differences in the product ion intensities are observed. This is consistent with the proposed salt-bridge structure for the singly protonated bradykinin ion.
Conformation.
The dissociation of the doubly protonated ions is less sensitive to internal changes of sequence than for singly protonated ions. The origin of this difference was investigated using molecular modeling. The most likely sites of protonation in the doubly protonated species are the two basic arginine residues. This places the charge on the residues that have the highest individual gas-phase basicity and potentially maximizes the distance between charges. Minimized (0 K) structures for the doubly protonated ion of bradykinin have been reported by Fenselau and co-workers57 and Salvino and coworkers58 in which the charge separation distances were 26 and ~10 Å, respectively. However, the precursor ions in this experiment have significant internal energies which could produce significant changes of conformation over the course of this experiment.59 In order to obtain an estimate for the range of molecular motion, dynamics simulations were performed at 450 K for 11 ns. Distances between the charges on the side-chain arginines to several other atoms in the ion were monitored and are shown in Figure 12. The distance between charges ranges from 7.8 to 27.2 Å over this relatively short time frame. Thus, at this temperature, a significant amount of molecular motion occurs. The average charge separation distance is 15.8 Å , remarkably different from that in the lowest energy structures reported previously,57,58 but similar to the majority of the lowest energy structures we find. This illustrates the problem of finding a global minimum on a complex potential energy surface for large ions. Three different optimized starting geometries were used in our dynamics simulations with charge separations of 10, 14, and 16 Å. After a few tens of picoseconds, no memory of the starting geometries was retained, indicating that 0 K minimized structures are not necessarily indicative of dissociation processes.
Figure 12.
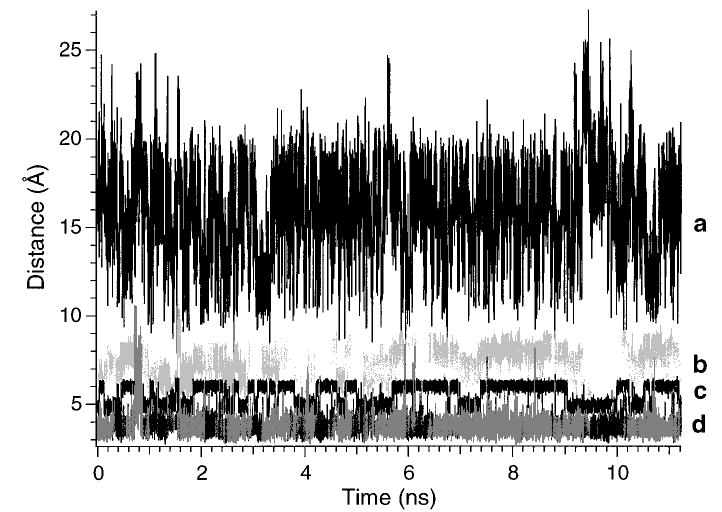
Molecular dynamics simulation of doubly protonated bradykinin at 450 K for 11 ns: (a) distance between the charges on the arginine residues (charge sites are represented by location of the central carbon atom on each guanidine group), (b) distance between the charge on Arg9 and the α-carbon of the phenyl side chain located on Phe8, (c) distance between the charge on Arg9 the C-terminus carboxyl carbon, and (d) distance between the charge on Arg1 and the carbonyl oxygen of Pro2.
The distance between the charge of the N-terminus arginine to the backbone carbonyl oxygen of proline 2 varies somewhat over the course of the simulations but has an average value of 3.7 Å. This clearly indicates that there is a close association of the charge with the backbone carbonyl oxygen at this positions even at this elevated temperature. A similar result is observed for the carbonyl oxygen of proline 3. Thus, significant charge interactions should occur near these backbone sites; this is consistent with the observed cleavage between these residues to form the b2 and y7 ions.
The simulations indicate that the charge on the C-terminus arginine is also solvated part of the time by either or both the phenyl ring of phenylalanine and the carboxylic acid group of the C-terminus. The distance between this charge and the first carbon of the phenyl ring varies from 3.6 to 10.6 Å. The simulations indicate that this interaction is kinetically stable, forming and breaking on the picosecond time frame. The solvation of a charged group by a phenyl group has been reported previously with alkali metal ions.60 This type of interaction has also been implicated in the binding of cationic ligands or substrates to proteins in solution.61 The interaction of the charge on arginine-9 with the C-terminus is consistent with the change in fragmentation that is observed with the methyl ester of bradykinin (Figure 11b). It is possible that a salt-bridge could be formed in the doubly charged ion between the N-terminal arginine and the carboxylate group, with the second proton located elsewhere in the ion. We are not able to determine if this occurs, although the small ΔEa upon formation of the methyl ester indicates if this occurs, the resulting structure is not nearly as stabilized in the 2+ as it is in the 1+ ion.
These dynamics simulations indicate that even though the entire peptide ion is undergoing large-amplitude motion, local charge-induced interactions are relatively stable even at 450 K. This is in agreement with conclusion based on gas-phase basicity measurements34,47 and calculations.62 The relatively low A factor found for these doubly charged ions could be due to the large difference in basicity of the arginine side chain compared to the peptide backbone. This would reduce the probability of proton transfer to the backbone site to produce the cleavage. It should also be noted that the degree of charge solvation is highly dependent on the force fields used in these simulations. Thus, any quantitative information obtained from these types of simulations must be approached with healthy skepticism.
The molecular modeling indicates that BIRD product ions for the singly and doubly protonated ions can be entirely rationalized based on differences in ion conformation; local folding of the ion can bring the proton to different sections of the peptide backbone. Transfer of the proton from the basic side chain to various sites along the backbone could then initiate bond cleavage to form b and y fragment ions. The higher sensitivity of the singly protonated ion to small changes in sequence is consistent with a tightly folded singly protonated ion structure which would have significant partial charge at many sites along the backbone. These results indicate that the observed fragmentation can be rationalized by a “mobile” proton,23,63 but it is not necessary for a proton to move along the backbone of the ion, but rather conformational changes can bring the proton directly to the necessary site for cleavage. This type of mechanism could also explain some cleavages observed in peptide ions that appear to be charge remote. The general applicability of the role of ion conformation on the dissociation of ions is under further investigation.
Conclusions
We have measured blackbody infrared radiative dissociation spectra of singly and doubly protonated bradykinin and several of its analogues. From the temperature dependence of the unimolecular rate constants for dissociation of these ions, Arrhenius activation parameters are obtained. For these relatively large ions, activation by blackbody photons should be rapid compared to the dissociation kinetics. Thus, the activation parameters reflect primarily the kinetics of dissociation. BIRD spectra and activation parameters of the singly protonated ions are more sensitive to small changes in ion structure than their doubly protonated counterparts. Even minor differences, such as changing residue 6 from serine to threonine, results in easily measured differences in the activation parameters and dissociation products. These results are consistent with a tightly folded precursor ion conformation in which the ion wraps around the protonation site to solvate the charge. Such a structure induces significant partial charge to many sites along the peptide backbone which can then induce fragmentation at multiple backbone sites.
While salt-bridge structures of proteins in solution are common and have been implicated in the biological activity of larger proteins, the existence of salt-bridge structures in the gas phase has been debated for many years. Experimental49 and theoretical50 studies demonstrate that the zwitterion form of small amino acids, such as glycine, are not stable in the gas phase. Very recently, evidence for a salt-bridge intermediates in H/D exchange reactions has been reported.51 However, no stable salt-bridge form of a gas-phase peptide or protein ion has been observed. We believe that the results reported here for bradykinin are the first example of a stable salt-bridge form of a peptide in the gas phase. Although by no means definitive, several pieces of evidence presented here suggest that a salt-bridge structure in which the two arginine residues are protonated and one or both interact with the deprotonated C-terminal carboxylate group is the most stable form of the singly protonated ion of bradykinin. Both the N and C-terminal arginine residues appear to be required to produce loss of NH3, the lowest energy fragmentation process for bradykinin. The A factor for this process is relatively large. This suggests that both arginine residues interact in both the reactant ion and transition state to produce this loss. Methylation of the C-terminus of bradykinin results in a dramatic lowering of the activation energy, from 1.3 to 0.6 eV, and lowers the A factor from 1012 to 105 s−1. In addition, loss of NH3 is dramatically reduced. Similar results are observed for the methyl ester of [Ala6]-bradykinin. Methylation eliminates the possibility of salt-bridge formation with the C-terminal carboxylate group; the lower activation energy for this ion is attributed to a destabilization of the reactant ion relative to the transition state for dissociation. The lowering of the A factor is attributed to breaking the interaction between the two arginine residues in the reactant ion. Salt-bridge structures of biomolecules will be enhanced by the presence of highly basic groups, such as arginine, as well as overall ion size which makes possible intramolecular solvation of the charge. Thus, it is likely that salt-bridge structures will be important in large gas-phase biomolecule ions, as they are in solution.
Smaller differences are observed in BIRD spectra of doubly protonated ions that differ by small changes between the N-and C-terminal arginine residues. This is consistent with a more extended ion conformation for these ions which reduces the charge–charge repulsion and reduces folding interactions. For these ions, we observe an average lowering of the activation energy from the singly to doubly protonated species from 1.2 to 0.8 eV, respectively. Smaller differences were observed for Lys-bradykinin (1.4 and 1.2 eV, respectively). For the methyl ester of bradykinin, the activation energy of the doubly protonated ion (0.8 eV) is higher than that of the singly protonated ion (0.6 eV). Thus, factors other than charge–charge repulsion, such as local charge solvation and ion conformations, play an important role in the dissociation dynamics of these ions. The principle fragmentation is consistent with dynamics simulations that indicate that the charge on the N-terminal arginine side chain is solvated by the backbone carbonyl oxygen at the second proline. This indicates that major product ions, b2/y7, can be entirely rationalized by a charge-induced cleavage via a partially folded ion conformation.
BIRD appears to be a highly promising technique for obtaining accurate activation energies and dynamical information on the dissociation of large ions, information that is difficult to obtain by conventional methods. The use of BIRD for measuring the effects of charge–charge repulsion on the dissociation of large multiply protonated biomolecules and for measuring strengths of interactions of gaseous noncovalent complexes is currently under investigation.
Acknowledgments
The authors would like to acknowledge helpful discussions with Profs. J. L. Beauchamp, P. A. Demirev, and Ms. D. S. Gross and are grateful to Prof. R. N. Zare for the generous and timely loan of a liquid N2 trap and to Dr. D. King for the synthesis of [Ala6]-bradykinin. This research would not have been possible if not for the generous financial support provided by the National Science Foundation (CHE-9258178), National Institutes of Health (1R29GM50336-01A2 and S10 RR05651-01 for partial support of our computer graphics facility), and Finnigan MAT through sponsorship of the 1994 American Society for Mass Spectrometry Research Award (E.R.W.).
References
- 1.(a) McLafferty, F. W. Tandem Mass Spectrometry; John Wiley and Sons: New York, 1983. (b) Busch, K. L.; Glish, G. L.; McLuckey, S. A. Mass Spectrometry/mass spectrometry: Techniques and Applications of Tandem Mass Spectrometry; VCH Publishers: New York, 1988.
- 2.Hillenkamp F, Karas M, Beavis RC, Chait BT. Anal Chem. 1991;63:1193A–1202A. doi: 10.1021/ac00024a002. [DOI] [PubMed] [Google Scholar]
- 3.a Fenn JB, Mann M, Meng CK, Wong SF, Whitehouse CM. Science. 1989;246:64–71. doi: 10.1126/science.2675315. [DOI] [PubMed] [Google Scholar]; b Smith RD, Loo JA, Ogorzalek Loo RR, Busman M, Udseth HR. Mass Spectrom Rev. 1991;10:359–452. [Google Scholar]
- 4.a Hunt DF, Yates JR, III, Shabanowitz J, Winston S, Hauer CR. Proc Natl Acad Sci USA. 1986;83:6233–6237. doi: 10.1073/pnas.83.17.6233. [DOI] [PMC free article] [PubMed] [Google Scholar]; b Loo JA, Edmonds CG, Smith RD. Anal Chem. 1993;65:425–438. doi: 10.1021/ac00052a020. [DOI] [PubMed] [Google Scholar]; c Senko MW, Speir JP, McLafferty FW. Anal Chem. 1994;66:2801–2808. doi: 10.1021/ac00090a003. [DOI] [PubMed] [Google Scholar]
- 5.a Woodin RL, Bomse DS, Beauchamp JL. J Am Chem Soc. 1978;100:3248–3250. [Google Scholar]; b Little DP, Speir JP, Senko MW, O’Connor PB, McLafferty FW. Anal Chem. 1994;66:2809–2815. doi: 10.1021/ac00090a004. [DOI] [PubMed] [Google Scholar]
- 6.a Hunt DF, Shabanowitz J, Yates JR. J Chem Soc, Chem Commun. 1987:548–550. [Google Scholar]; b Lebrilla CB, Wang DTS, Mizoguchi TJ, McIver RT., Jr J Am Chem Soc. 1989;111:8593–8598. [Google Scholar]; c Williams ER, Furlong JJP, McLafferty FW. J Am Soc Mass Spectrom. 1990;1:288–294. doi: 10.1016/1044-0305(90)85003-5. [DOI] [PubMed] [Google Scholar]
- 7.a Bier ME, Schwartz JC, Schey KL, Cooks RG. Int J Mass Spectrom Ion Processes. 1990;103:1–19. [Google Scholar]; b Williams ER, Henry KD, McLafferty FW, Shabanowitz J, Hunt DF. J Am Soc Mass Spectrom. 1990;1:413–416. doi: 10.1016/1044-0305(90)85022-E. [DOI] [PubMed] [Google Scholar]; c McCormack AL, Somogyi A, Dongré AR, Wysocki VH. Anal Chem. 1993;65:2859–2872. doi: 10.1021/ac00068a024. [DOI] [PubMed] [Google Scholar]
- 8.McLuckey SA, Habibigoudarzi S. J Am Chem Soc. 1993;115:12085–12095. [Google Scholar]
- 9.a McLuckey SA, VanBerkel GJ, Glish GL. J Am Soc Mass Spectrom. 1992;3:60–70. doi: 10.1016/1044-0305(92)85019-G. [DOI] [PubMed] [Google Scholar]; b Little DP, Chorush RA, Speir JP, Senko MW, Kelleher NL, McLafferty FW. J Am Chem Soc. 1994;116:4893–4897. [Google Scholar]; c Little DP, McLafferty FW. J Am Chem Soc. 1995;117:6783–6784. [Google Scholar]
- 10.Loo JA, Edmonds CG, Smith RD. Anal Chem. 1991;63:2488–2499. doi: 10.1021/ac00021a018. [DOI] [PubMed] [Google Scholar]
- 11.Kelleher NL, Costello CA, Begley TP, McLafferty FW. J Am Soc Mass Spectrom. 1995;6:981–984. doi: 10.1016/1044-0305(95)00584-Z. [DOI] [PubMed] [Google Scholar]
- 12.Maier, J. P. Ion and Cluster Ion Spectroscopy and Structure; Maier, J. P., Ed.; Elsevier: New York, 1989.
- 13.a Kebarle P. Ann Rev Phys Chem. 1977;28:445–476. [Google Scholar]; b Sieck LW, Meot-Ner (Mautner) M. J Phys Chem. 1984;88:5324–5327. [Google Scholar]; c Bouchard F, Hepburn JW, McMahon TB. J Am Chem Soc. 1989;111:8934–8935. [Google Scholar]
- 14.(a) Meot-Ner, M. Molecular Structures and Energetics; VCH Publishers: New York, 1986; Vol. 4. ; (b) Bohme, D. K. Interactions Between Ions and Molecules; Luenum: New York, 1975.
- 15.(a) Wilson, S. Methods in Computational Chemistry; Plenum: New York, 1987; Vol. 1.; (b) Hirst, D. M. A Computational Approach to Chemistry; Blackwell Scientific Publications: London, 1990.
- 16.Biemann K, Martin SA. Mass Spectrom Rev. 1987;6:1–76. [Google Scholar]
- 17.a Zhao H, Adams J. Int J Mass Spectrom Ion Processes. 1993;125:195–205. [Google Scholar]; b Yalcin T, Csizmadia IG, Peterson MR, Harrison AG. J Am Soc Mass Spectrom. 1996;7:233–242. doi: 10.1016/1044-0305(95)00677-X. [DOI] [PubMed] [Google Scholar]
- 18.a Thorne TC, Ballard KD, Gaskell SJ. J Am Soc Mass Spectrom. 1990;1:249–257. [Google Scholar]; b Ballard KD, Gaskell SJ. J Am Chem Soc. 1992;114:64–71. [Google Scholar]; c Ballard KD, Gaskell SJ. J Am Soc Mass Spectrom. 1993;4:477–481. doi: 10.1016/1044-0305(93)80005-J. [DOI] [PubMed] [Google Scholar]
- 19.a Burlet O, Chao-Yuh Y, Gaskell SJ. J Am Soc Mass Spectrom. 1992;3:337–344. doi: 10.1016/1044-0305(92)87061-3. [DOI] [PubMed] [Google Scholar]; b Wu Q, Van Orden S, Cheng X, Bakhtiar R, Smith RD. Anal Chem. 1995;67:2498–2509. doi: 10.1021/ac00110a027. [DOI] [PubMed] [Google Scholar]
- 20.a Suckau D, Shi Y, Beu SC, Senko MW, Quinn JP, Wampler FW, McLafferty FW. Proc Natl Acad Sci USA. 1993;90:790–793. doi: 10.1073/pnas.90.3.790. [DOI] [PMC free article] [PubMed] [Google Scholar]; b Wood TD, Chorush RA, Wampler FM, Little DP, O’Connor PB, McLafferty FW. Proc Natl Acad Sci USA. 1995;92:2451–2454. doi: 10.1073/pnas.92.7.2451. [DOI] [PMC free article] [PubMed] [Google Scholar]; c Winger BE, Light-Wahl KJ, Rockwood AL, Smith RD. J Am Chem Soc. 1992;114:5897–5898. [Google Scholar]
- 21.a Covey T, Douglas DJ. J Am Soc Mass Spectrom. 1993;4:616–623. doi: 10.1016/1044-0305(93)85025-S. [DOI] [PubMed] [Google Scholar]; b Cox KA, Julian RK, Cooks RG, Kaiser RE. J Am Soc Mass Spectrom. 1994;5:127–136. doi: 10.1016/1044-0305(94)85025-9. [DOI] [PubMed] [Google Scholar]; c Clemmer DE, Hudgins RR, Jarrold MF. J Am Chem Soc. 1995;117:10141–10142. [Google Scholar]; (d) Collings, B. A.; Douglas, D. J. J. Am. Chem. Soc. in press.
- 22.a Gross DS, Schnier PD, Rodriguez-Cruz SE, Fagerquist CK, Williams ER. Proc Natl Acad Sci USA. 1996;93:3143–3148. doi: 10.1073/pnas.93.7.3143. [DOI] [PMC free article] [PubMed] [Google Scholar]; b Ogorzalek-Loo RR, Smith RD. J Am Soc Mass Spectrom. 1994;5:207–220. doi: 10.1016/1044-0305(94)85011-9. [DOI] [PubMed] [Google Scholar]
- 23.Tang X, Thibault P, Boyd RK. Anal Chem. 1993;65:2824–2834. doi: 10.1021/ac00068a020. [DOI] [PubMed] [Google Scholar]
- 24.a Downard KM, Biemann K. J Am Soc Mass Spectrom. 1994;5:966–975. doi: 10.1016/1044-0305(94)80015-4. [DOI] [PubMed] [Google Scholar]; b Vachet RW, Winders AD, Glish GL. Anal Chem. 1996;68:522–526. doi: 10.1021/ac950893r. [DOI] [PubMed] [Google Scholar]
- 25.Tecklenburg RE, Jr, Miller MN, Russell DH. J Am Chem Soc. 1989;111:1161–1171. [Google Scholar]
- 26.Jones JL, Dongre AR, Somogyi A, Wysocki VH. J Am Chem Soc. 1994;116:8368–8369. [Google Scholar]
- 27.Marzluff EM, Campbell S, Rodgers MT, Beauchamp JL. J Am Chem Soc. 1994;116:7787–7796. [Google Scholar]
- 28.Speir JP, Amster IJ. J Am Soc Mass Spectrom. 1995;6:1069–1078. doi: 10.1016/1044-0305(95)00547-1. [DOI] [PubMed] [Google Scholar]
- 29.Price WD, Schnier PD, Williams ER. Anal Chem. 1996;68:859–866. doi: 10.1021/ac951038a. [DOI] [PubMed] [Google Scholar]
- 30.a Thölmann D, Tonner DS, McMahon TB. J Phys Chem. 1994;98:2002–2004. [Google Scholar]; b Dunbar RC, McMahon TB, Tholmann D, Tonner DS, Salahub DR, Wei D. J Am Chem Soc. 1996;117:12819–12825. [Google Scholar]
- 31.a Lin C, Dunbar RC. J Phys Chem. 1996;100:655–659. [Google Scholar]; b Dunbar RC. J Phys Chem. 1994;98:8705–8712. [Google Scholar]
- 32.Roepstorff P, Fohlman J. J Biomed Environ Mass Spectrom. 1984;11:601. doi: 10.1002/bms.1200111109. [DOI] [PubMed] [Google Scholar]
- 33.(a) Carey, F. A.; Organic Chemistry; McGraw-Hill Book Company, New York, 1987.; (b) Creighton, T. E. Proteins; 2nd ed.; W. H. Freeman & Co.: New York, 1993.
- 34.Gross DS, Williams ER. J Am Chem Soc. 1995;117:883–890. [Google Scholar]
- 35.Su T, Bowers MT. Int J Mass Spectrom Ion Phys. 1973;12:347–356. [Google Scholar]
- 36.Marshall AG, Wang TCL, Ricca TL. J Am Chem Soc. 1985;107:7893–7897. [Google Scholar]
- 37.Mackay, D. H., Cross, A. J., Hagler, A. T. The Role of Energy Minimization in Simulation Strategies of Biomolecular Systems; Mackay, D. H.; Cross, A. J.; Hagler, A. T., Ed.: New York, 1989; pp 317–358.
- 38.Manuscript in preparation.
- 39.Price, W. D.; Schnier, P. D.; Jockusch, R. A.; Stritmatter, E. F.; Williams, E. R. J. Am. Chem. Soc., submitted for publication.
- 40.(a) Gilbert, R. C.; Smith, S. C. Theory of Unimolecular and Recombination Reactions; Blackwell Scientific Publications: London, 1990. ; b Griffin LL, McAdoo DJ. J Am Soc Mass Spectrom. 1993;4:11–15. doi: 10.1016/1044-0305(93)85037-X. [DOI] [PubMed] [Google Scholar]
- 41.Steinfeld, J. I.; Francisco, J. S.; Hase, W. L. Chemical Kinetics and Dynamics; Prentice Hall: New Jersey, 1989.
- 42.Manuscript in preparation.
- 43.Wu Z, Fenselau C. Rap Commun Mass Spectrom. 1992;6:403–405. [Google Scholar]
- 44.Gorman GS, Speir JP, Turner CA, Amster IJ. J Am Chem Soc. 1992;114:3986–3988. [Google Scholar]
- 45.Wu J, Lebrilla CB. J Am Chem Soc. 1993;115:3270–3275. [Google Scholar]
- 46.Wu Z, Fenselau C. J Am Soc Mass Spectrom. 1992;3:863–866. doi: 10.1016/1044-0305(92)80011-9. [DOI] [PubMed] [Google Scholar]
- 47.Schnier PD, Gross DS, Williams ER. J Am Chem Soc. 1995;117:6747–6757. [Google Scholar]
- 48.Benson, S. W. Thermochemical Kinetics. Methods for the Estimation of Thermochemical Data and Rate Parameters; John Wiley & Sons: New York, 1968.
- 49.Locke MJ, McIver JRT. J Am Chem Soc. 1983;105:4226–4232. [Google Scholar]
- 50.a Yu D, Armstrong DA, Rauk A. Can J Chem. 1992;70:1762–1772. [Google Scholar]; b Ding YB, Krogh-Jespersen K. Chem Phys Lett. 1992;199:261–266. [Google Scholar]
- 51.Campbell S, Rodgers MT, Marzluff EM, Beauchamp JL. J Am Chem Soc. 1995;117:12840–12854. [Google Scholar]
- 52.Beauchamp, J. L. personal communication.
- 53.Wyttenbach, T.; von Helden, G.; Bowers, M. T. J. Am. Chem. Soc., submitted for publication.
- 54.Lias SG, Bartness JE, Liebman JF, Holmes JL, Levin RD. Gas Phase Ion Neutral Thermochem J Phys Chem Ref Data. 1988;17(Suppl 1) [Google Scholar]
- 55.Gross DS, Rodriguez-Cruz SE, Bock S, Williams ER. J Phys Chem. 1995;99:4034–4038. [Google Scholar]
- 56.The ratio of these fragments is different to that reported earlier (ref 29) because a different chirp excitation rate was used.
- 57.Kaltashov IA, Fabris D, Fenselau CC. J Phys Chem. 1995;99:10046–10051. [Google Scholar]
- 58.Salvino JM, Seoane PR, Dolle RE. J Comput Chem. 1993;14:438–444. [Google Scholar]
- 59.a von Helden G, Wyttenbach T, Bowers MT. Science. 1995;267:1483–1485. doi: 10.1126/science.267.5203.1483. [DOI] [PubMed] [Google Scholar]; b Adams J, Strobel FH, Reiter A, Sullards MC. J Am Soc Mass Spectrom. 1996;7:30–41. doi: 10.1016/1044-0305(95)00604-4. [DOI] [PubMed] [Google Scholar]
- 60.a Grese RP, Cerny RL, Gross ML. J Am Chem Soc. 1989;111:2835–2842. [Google Scholar]; b Gross DS, Williams ER. J Am Chem Soc. 1996;118:202–204. [Google Scholar]
- 61.Dougherty DA. Science. 1996;271:163–168. doi: 10.1126/science.271.5246.163. [DOI] [PubMed] [Google Scholar]
- 62.Schnier PD, Gross DS, Williams ER. J Am Soc Mass Spectrom. 1995;6:1086–1097. doi: 10.1016/1044-0305(95)00532-3. [DOI] [PubMed] [Google Scholar]
- 63.Johnson RS, Krylov D, Walsh KA. J Mass Spectrom. 1995;30:386–387. [Google Scholar]


