

Abstract
Cerebellar cortical contributions to eyeblink conditioned excitation have been examined extensively. In contrast, very little evidence exists concerning the role of the cerebellar cortex in eyeblink conditioned inhibition. In the current study, rats were given intraventricular infusions of the immunotoxin OX7-saporin to selectively destroy Purkinje cells throughout the cerebellar cortex following excitatory conditioning. After a 2-week postinfusion period, the rats were given reacquisition training. After reacquiring excitatory conditioning, the rats were trained in a feature-negative discrimination procedure to establish conditioned inhibition. Rats treated with OX7-saporin showed impaired reacquisition of excitatory conditioning and acquisition of conditioned inhibition. The results suggest that Purkinje cells play important, but different, roles in conditioned excitation and inhibition in rats.
The role of the cerebellar cortex in excitatory eyeblink conditioning has been examined extensively (Christian & Thompson, 2003). Lesions of the ansiform, paramedian, and simple lobules of the cerebellar hemisphere or the lateral anterior lobe ipsilateral to the trained eye impair acquisition of eyeblink conditioning (Garcia, Steele, & Mauk, 1999; Lavond & Steinmetz, 1989). Cerebellar cortical lesions made after conditioning produce a complete or partial loss of conditioned responses (CRs) that is transient or persistent, depending on the locus of damage, the amount of pretraining, and perhaps procedural factors (Harvey, Welsh, Yeo, & Romano, 1993; Lavond, Steinmetz, Yokaitis, & Thompson, 1987; McCormick & Thompson, 1984a; Perret, Ruiz, & Mauk, 1993; Woodruff-Pak, Lavond, Logan, Steinmetz, & Thompson, 1993; Yeo & Hardiman, 1992; Yeo, Hardiman, & Glickstein, 1985). Reversible inactivation of cerebellar lobule HVI abolishes CRs, blocks acquisition, and prevents consolidation of eyeblink conditioning (Attwell, Cooke, & Yeo, 2002; Attwell, Rahman, Ivarsson, & Yeo, 1999; Attwell, Rahman, & Yeo, 2001). Pharmacological disconnection of the cerebellar cortex from the deep nuclei with gamma aminobutyric acid (GABA) antagonists reduces CR amplitude and disrupts CR timing (Garcia & Mauk, 1998; Mamounas, Thompson, & Madden, 1987; Medina, Garcia, & Mauk, 2001). CR acquisition and CR timing are impaired by sequential administration of the GABA agonist muscimol and the GABA antagonist picrotoxin, which disconnects the cerebellar cortex from the nuclei while preventing hyperexcitability in the nuclei (Bao, Chen, Kim, & Thompson, 2002). The lesion and neuropharmacology studies indicate that the cerebellar cortex plays critical roles in acquisition of excitatory eyeblink conditioning and CR timing.
The relative roles of the different cerebellar cortical neurons in eyeblink conditioning have not been fully elucidated. However, studies using multiunit cluster or single-unit recording techniques demonstrate that cerebellar cortical neurons exhibit CR-related activity that emerges as CRs are acquired and persists during overtraining (Berthier & Moore, 1986; Gould & Steinmetz, 1994, 1996; Hesslow & Ivarsson, 1994; McCormick, Clark, Lavond, & Thompson, 1982; McCormick & Thompson, 1984b). Single-unit analyses of Purkinje cell activity show conditioning-specific increases and decreases in activity (Berthier & Moore, 1986; Gould & Steinmetz, 1996; Hesslow & Ivarsson, 1994). The study by Hesslow and Ivarsson found that Purkinje cells within blink zones of the cerebellar cortex (defined by eyelid electromyography [EMG] activity elicited by stimulation of the cerebellar cortical surface) showed only learning-specific decreases in simple spike activity. Purkinje cells that show reduced activity are thought to play a role in CR production, whereas the role of the Purkinje cells that show increased activity has not been determined (Mauk & Donegan, 1997; Thompson, 1986). A possible function for increased Purkinje cell activity could be to shape the topography of the CR by inhibiting eyelid movement early in the conditioned stimulus (CS) period (Medina, Garcia, Nores, Taylor, & Mauk, 2000). Intracellular recordings from Purkinje cell dendrites indicate a conditioning-specific increase in membrane excitability (Schreurs, Gusev, Tomsic, Alkon, & Shi, 1998; Schreurs, Sanchez-Andres, & Alkon, 1991; Schreurs, Tomsic, Gusev, & Alkon, 1997). Increased Purkinje cell excitability could be a mechanism underlying the conditioning-specific increases in Purkinje cell activity seen in unit recording studies. The electrophysiology studies of cerebellar cortical function suggest that Purkinje cells play important roles in acquisition and CR topography during excitatory eyeblink conditioning.
In contrast to the extensive analysis of cerebellar cortical contributions to conditioned excitation, the role of the cerebellar cortex in conditioned inhibition has not been examined thoroughly. Conditioned inhibition training establishes a CS as a signal indicating that an otherwise expected unconditioned stimulus (US) will not occur. On the basis of the idea that the associations underlying conditioned excitation and inhibition have opposite effects on behavior (Rescorla & Wagner, 1972), some have speculated that conditioned inhibition of the eyeblink CR might be mediated by synaptic plasticity mechanisms within the cerebellum that have postsynaptic effects opposite to those of the synaptic plasticity mechanisms underlying conditioned excitation (Freeman & Nicholson, 1999; Mauk & Donegan, 1997; Moore & Choi, 1997). Models of cerebellar learning posit that excitatory conditioning is mediated by decreases in Purkinje cell activity caused by long-term depression of excitatory synaptic inputs to Purkinje cells (Albus, 1971; Mauk & Donegan, 1997; Moore & Choi, 1997). Conditioned inhibition, in contrast, might be mediated by long-term enhancement of excitatory inputs to Purkinje cells (Freeman & Nicholson, 1999; Mauk & Donegan, 1997; Moore & Choi, 1997). A study that used picrotoxin to block Purkinje cell inhibition of the cerebellar deep nuclei during conditioned inhibition training found a disruption of excitatory conditioning, but failed to find a change in behavioral inhibition (Nolan, Nicholson, & Freeman, 2002). However, this study examined the effects of blocking cortical inhibition of the nuclei after conditioned inhibition was well established, leaving open the possibility that the cerebellar cortex could be involved in the acquisition of conditioned inhibition.
The current study examined the role of the cerebellar cortex in acquisition of conditioned inhibition by depleting Purkinje cells throughout the cortex with the immunotoxin OX7-saporin. OX7 is a monoclonal antibody for the cell surface antigen Thy-1 (Morris & Raisman, 1983). Conjugating OX7 and saporin (a ribosome inactivation protein) results in a toxin that specifically targets cells that express the Thy-1 antigen. Purkinje cells express high levels of Thy-1 (Angner, Kelly, Wiley, Walsh, & Reuhl, 2000; Morris, Beech, Barber, & Raisman, 1985). In addition, there are other features of Purkinje cells that make them a very susceptible target for a molecule like OX7-saporin. Specifically, Purkinje cells are known to actively uptake large molecules from cerebrospinal fluid, and injecting OX7-saporin into the ventricular system gives it relatively direct access to Purkinje cells (Borges, Elliott, Gill, Iversen, & Iversen, 1985). As a result of these features, OX7-saporin infused into the ventricular system selectively kills Purkinje cells (Angner et al., 2000; Davis & Wiley, 1989; Gandhi, Kelly, Wiley, & Walsh, 2000; Waite, Wardlow, & Power, 1999; Wrenn & Wiley, 2001). The OX7-saporin method has advantages over focal lesions because there is less concern about missing an unidentified but important cortical region for eyeblink conditioning, which is plausible because there are multiple blink zones throughout the cerebellar cortex (Hesslow, 1994). OX7-saporin also has advantages over using Purkinje cell degeneration ( pcd) mutant mice because the pcd mice lose their Purkinje cells during development, and there could be developmental compensation in the cerebellar nuclei or brainstem following early Purkinje cell loss (Freeman, Carter, & Stanton, 1995). In addition, it is not possible to use pcd mice to evaluate the effects of Purkinje cell loss on retention of CRs or acquisition of conditioned inhibition after establishing a baseline of CRs with conditioned excitation. The pcd mice also experience significant degeneration of photoreceptors during the 3rd and 5th postnatal weeks (Blanks & Spee, 1992), making it difficult to use a light stimulus, which is often used in conditioned inhibition experiments (Freeman & Nicholson, 1999; Logan, 1991; Marchant, Mis, & Moore, 1972; Nolan et al., 2002; Nicholson & Freeman, 2002).
In the current experiment, rats were given initial training (Phase 1) using excitatory eyeblink conditioning with a tone CS paired with a periorbital shock US (see Table 1). They were then given an infusion of OX7-saporin or saline into the right lateral ventricle, followed by a 2-week period for the toxin to have its maximum effect. The rats were then given reacquisition training (Phase 2) using excitatory conditioning with the same tone CS (see Table 1). The rats that reacquired a high level of excitatory CRs were given conditioned inhibition training (Phase 3) in which half of the trials in each session included paired presentations of a different tone CS and US (T+) and the other half of the trials included simultaneous presentations of the tone CS and a light CS (TL−) with no US. This procedure was designed to establish the light as an inhibitory CS (Freeman & Nicholson, 1999; Nolan et al., 2002; Nicholson & Freeman, 2002). After conditioned inhibition training, the rats were given two standard tests for inhibition (Rescorla, 1969), a summation test (Phase 4) and a retardation test (Phase 5).
Table 1.
Training Procedure With OX7-Saporin Infusion
| Training phase | Description | Stimuli |
|---|---|---|
| 1 | Acquisition | T1+ |
| Infusion of OX7-saporin or saline | ||
| 2 | Reacquisition | T1+ |
| 3 | Feature-negative discrimination | T2+, T2L− |
| 4 | Summation test | T1−, T1L− |
| 5 | Retardation test | L+ |
Note. += unconditioned stimulus; −= no unconditioned stimulus; T1 = 8-kHz tone; T2 = 2-kHz tone; L = light.
Method
Subjects
Subjects were 27 adult male Long–Evans rats (250–350 g). The rats were housed in the animal colony in Spence Laboratories of Psychology at the University of Iowa. They were allowed free food and water and kept on a 12-hr light–dark cycle. All procedures were approved by the Institutional Animal Care and Use Committee at the University of Iowa.
Surgery and Recovery
Surgery was performed 1 week prior to training. Each rat was anesthetized with an intraperitoneal injection of sodium pentobarbital (60 mg/kg) and atropine sulfate (0.67 mg/kg). After the onset of anesthesia, the rat was placed in a stereotaxic apparatus. A 23-gauge (ga) guide cannula was lowered into the brain, with a 30-ga stylet inserted within the guide cannula during stereotaxic placement. The stylet extended 0.5 mm beyond the end of the guide cannula. The cannula was lowered so that the tip of the stylet penetrated the left lateral ventricle (from bregma: AP = −1.2 mm, ML = +1.5 mm, DV = −4.0 mm). Differential EMG electrodes were then implanted in the left upper eyelid muscle (orbicularis oculi), with a ground wire attached to a skull screw. The two EMG wires and a ground wire were attached to a small plastic connector with gold pins. A bipolar stimulating electrode (Plastics One, Roanoke, VA) was implanted subdermally, caudal to the left eye, for delivery of the shock US. The bipolar electrode was attached to a plastic connector. All components were then cemented in place with dental acrylic, and sutures were made as necessary. Rats were monitored after surgery until they recovered from the anesthetic and then were returned to the colony room.
Training Apparatus
The conditioning apparatus consisted of four small-animal sound-attenuating chambers (BRS/LVE, Laurel, MD). Within each sound-attenuating chamber was a small-animal operant chamber (BRS/LVE), which was fitted with two speakers that independently produce tones up to 120 dB, frequencies of 1000 to 9000 Hz, and a small light. The sound-attenuating chambers also contained a mounted fan that produced background noise (65 dB).
The plugs on the rat’s head stage were connected to lightweight cables and a commutator. The cables were connected to peripheral equipment for recording EMG activity and delivering stimuli. The EMG signal was recorded differentially, filtered (500–5000 Hz), amplified (×2000), integrated, and then input to a computer where it was recorded and displayed by custom software (JSA Designs, Raleigh, NC). The JSA software controlled the delivery of the stimuli (light, tone, and shock). The shock stimulus (2–3 mA, DC) was produced by a stimulus isolator (Model 365A; World Precision Instruments, Sarasota, FL).
Training Procedure
Training sessions were performed once daily and consisted of 100 trials (except where noted below). The internal chamber lights were off during training and testing. The CSs used were an 8-kHz tone (85 dB), a 2-kHz tone (85 dB), and a light (4 W). Each CS occurred for 500 ms. The US was a periorbital shock delivered at 2–3 mA during the last 25 ms of the CS period. The average intertrial interval was 30 s (ranging from 20 to 40 s).
Training consisted of five phases: acquisition, reacquisition, feature-negative discrimination (FND), summation, and retardation (see Table 1). Phase 1 involved paired training, (8-kHz tone paired with shock) until a performance criterion of 80% CRs for 2 consecutive sessions was reached. The next day, the rats were infused with OX7-saproin or saline (see drug infusion procedure). The rats were returned to their home cages for 15–17 days while OX7-saporin depleted Purkinje cells. In Phase 2, reacquisition, training was exactly the same as in Phase 1 and continued until rats reached 80% CRs for 2 consecutive sessions. Feature-negative discrimination training sessions (Phase 3) consisted of 50 trials of a 2-kHz tone paired with the US (T+) and 50 trials in which the 2-kHz tone was presented concurrently with a light with no US (TL−). This procedure was designed to establish the light as an inhibitory CS. After rats reached a criterion of at least 40% discrimination (difference in percentage of CRs) between T+ and TL− trials for 2 consecutive sessions, summation and retardation tests were performed. The discrimination criterion was set to be slightly lower than the asymptotic level of discrimination observed in previous studies (Freeman & Nicholson, 1999; Nicholson & Freeman, 2002; Nolan, Nicholson, & Freeman, 2002). The summation test (Phase 4) consisted of 40 trials of the 8-kHz tone (used in Phase 1) and 40 trials of the 8-kHz tone concurrent with the light. The retardation test (Phase 5) consisted of two 100-trial sessions of the light paired with the shock US. If a rat failed to reach the performance criterion during reacquisition after 50 sessions, training was terminated.
Drug Infusion Procedure
The infusions were performed under moderate sodium pentobarbital anesthesia (45 mg/kg). After Phase 1, an infusion was administered with a 30-ga infusion cannula attached to 30 cm of polyethylene tubing (PE 10), which was then attached to a 25-μl gas-tight syringe (Hamilton, Reno, NV). Because of differences in diameter, the PE 10 tubing had to be attached to a short section of 30-ga cannula, which was glued to a short section of 23-ga cannula and then attached to the syringe needle with a short section of PE 50 tubing. The syringe was placed in an infusion pump (Pump 11; Harvard Apparatus, Holliston, MA). The stylet was removed, and the infusion cannula was inserted into the guide cannula. OX7-saporin (Chemicon, Temecula, CA) or phosphate-buffered saline (PBS) was then infused at 25 μl/hr (15.0 μg OX7-saporin at 0.861 μg/μl or 17.4 μl of 0.1 M PBS). After the infusion, the cannula remained in place for an additional 15 min before removal. A new stylet was then inserted and covered with dental acrylic. The rats were monitored following the infusion until they recovered from the anesthesia.
During the rest period, the rats were monitored daily for signs of ataxia and possible weight loss. When weight loss occurred, supplementing their diet with moistened food (dry rat pellets soaked in water overnight) placed on a small glass tray (inverted staining dish lid) in the cage was sufficient to maintain body weight. Ataxia was assessed by means of a subjective rating that ranged from a score of 0 (no ataxia, normal gait and posture) to 7 (very severe ataxia, unable to walk or maintain upright posture).
Histology
After completion of training the rats were administered a lethal injection of sodium pentobarbital (120 mg/kg) and transcardially perfused with physiological saline followed by 3% (wt/vol) formaldehyde. The brains were removed and the forebrains were placed in 10% (wt/vol) sucrose dissolved in PBS and allowed to soak for at least 24 hr. A microtome was used to prepare 50-μm horizontal sections of the forebrain. The sections were then stained with cresyl violet. Sections were inspected under a light microscope to confirm that the cannula was placed in the left lateral ventricle.
The cerebellum of each rat was embedded in paraffin. A rotary microtome was used to cut 5-μm horizontal sections. The sections were then stained with cresyl violet as described above. Slices were examined under a light microscope, and representative horizontal sections of the cerebellum were selected at three different levels (from bregma: DV −5.7 mm, −5.0 mm, −4.4 mm). The first section (−5.7 mm) was used for obtaining cell counts of the interpositus nucleus. The other two sections were used for obtaining Purkinje cell counts. The −5.0-mm section was defined by the anatomical marker at the dorsal tip of the fastigial nucleus. The −4.4-mm section was defined by the anatomical marker at the point where white matter is no longer visible in lobule III. At each of these levels (−5.0 mm and −4.4 mm) Purkinje cells were counted through the whole section, lobule HVI, and the anterior lobe. The Purkinje cell counts from each of these two levels were combined for subsequent analyses. Purkinje cells were counted by visual inspection under a 40× objective. Cells were included in the count if they were stained neuronal cell bodies of sufficient size and in the appropriate location to be considered Purkinje cells.
A different counting technique was used to assess the number of neurons in the interpositus nucleus. Light microscope photographs were taken of the interpositus nucleus of each subject at equivalent anatomical levels, as mentioned above, defined by the dorsoventral level where the dorsal tip of the dentate nucleus is barely visible. The images were processed with Image J software (Rasband, 2004). The images were trimmed so they only included the interpositus nucleus. Then a threshold analysis was applied which kept only the objects of sufficient darkness in the field of view. Finally, a count was performed by the program, which counted any object larger than 150 pixels.
Data Analysis
The behavioral data were examined for each training session. Repeated measures analysis of variance (ANOVA) was performed for the CR percentage, CR amplitude, CR onset latency, and CR peak latency. The amplitude and latency data were taken from CS-alone trials in which a response occurred. Significant differences were evaluated by Tukey’s honestly significant difference (HSD) test (all ps < .05).
The conditioned inhibition (Phase 3) discrimination data were analyzed two ways. First, the number of sessions to reach a discrimination criterion of 40% greater responding on T+ trials relative to the TL− trials for two consecutive sessions was calculated (Nicholson & Freeman, 2002, FND 40). A potential problem with this measure is that it does not account for differences in the overall rate of responses. The OX7-saporin rats may show impaired FND because of low responding during T+ trials, which would indicate a deficit in excitatory conditioning, not impaired discrimination. The second method was to calculate a discrimination ratio for the performance of each rat during FND to examine the magnitude of discrimination while controlling for overall rates of responding. The discrimination ratio was calculated by the formula (CRs during T+ trials) ÷ (CRs during T+ trials) + (CRs during TL− trials). A criterion ratio of 0.6 was used for the purposes of analysis in this experiment (FND 0.6) on the basis of performance levels achieved by the control rats. The number of sessions to criterion was calculated on the basis of two consecutive sessions of a responding ratio of 0.6 or higher. Measures of CR topography were taken from the criterion session for the discrimination ratio measure.
Linear relationships between the number of Purkinje cells (whole section, lobule HVI, and anterior lobe) and behavioral performance in Phases 2 and 3 (sessions to criterion, CR onset latency, CR peak latency, and CR amplitude) were examined with regression analysis.
Results
Excitatory Conditioning
The performance of both OX7-saporin and saline groups were equivalent in Phase 1 (predrug, T + excitatory acquisition). The group means for sessions to criterion were 5.2 sessions for the OX7-saporin group and 6.8 sessions for the saline group. A t test indicated that there was no significant difference between the groups in Phase 1, t(24) = 1.61, p = .12.
Rats given OX7-saporin were severely impaired during reacquisition training (see Figure 1). Two of the rats failed to reach the reacquisition criterion within 50 sessions (5,000 trials). A t test performed on the Phase 2 (reacquisition) sessions-to-criterion data revealed a significant group difference, t(24) = 3.91, p < .002. However there were no significant differences in CR onset latency (see Figure 2), t(24) = 1.67, p = .108; CR peak latency (Figure 2), t(24) = 1.01, p = .321; or CR amplitude, t(24) = 1.10, p = .280. Figure 3 displays the CR percentage, CR onset latency, and CR peak latency for 3 OX7-saporin treated rats, 1 of which failed to reach the reacquisition criterion (filled circles).
Figure 1.
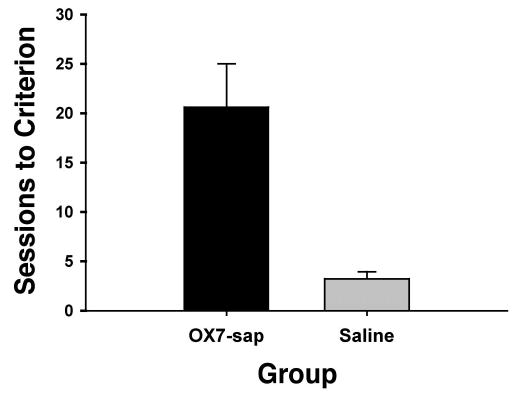
Mean (+ SEM) sessions to criterion for Phase 2 (8-kHz tone reacquisition) for the OX7-saporin (OX7-sap) and saline groups.
Figure 2.
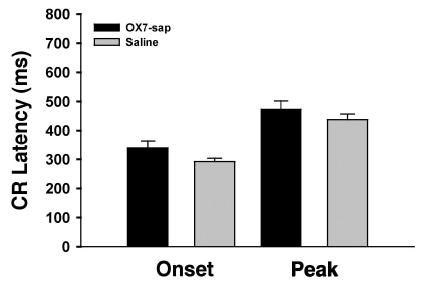
Mean (+ SEM) conditioned response (CR) onset latency and CR peak latency for Phase 2 (8-kHz tone reacquisition) for the OX7-saporin (OX7-sap) and saline groups.
Figure 3.
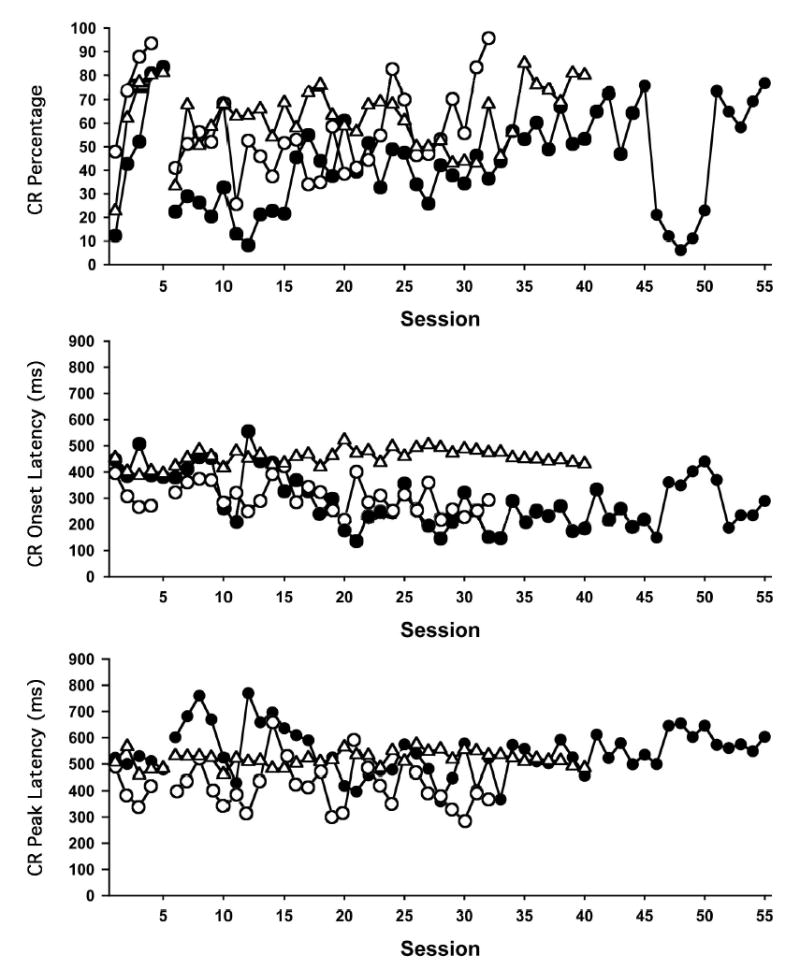
Percentage of conditioned responses (CRs; top graph), CR onset latency (middle graph), and CR peak latency (bottom graph) during 100-trial sessions of acquisition training (Sessions 1–5) and reacquisition training (starting on Session 6) for 3 rats that were given OX7-saporin. The performance of each rat is indicated by a different symbol (solid circles = R1249, open circles = R1463, open triangles = R1248). The break in data lines denotes the 2-week interval between acquisition and reacquisition training. Unconditioned stimulus onset was at 475 ms. Note that 1 of the rats (R1249) failed to reach the reacquisition criterion of two consecutive sessions with CRs on 80% of the trials.
The difference in performance on the first session of acquisition (Phase 1) and the first session of reacquisition (Phase 2) was analyzed to assess the retention and savings. A t test indicated that there was a significant within-group difference in the percentage of CRs between Phase 2 and Phase 1 for the saline rats, t(24) = 10.10, p < .001, but not for the OX7-saporin rats, t(24) = 1.54, p < .137.
Inhibitory Conditioning
t tests on the Phase 3 (FND) data indicated that there was a significant group difference in the number of sessions to criterion for the FND 40 measure, t(21) = 2.71, p < .02, and with the FND 0.6 measure, t(21) = 2.75, p < .02 (see Figure 4). Figure 5 displays the Phase 3 discrimination performance of 3 rats that were given OX7-saporin and 1 rat that was given saline. For the CR onset latency, responses to the T+ trials and TL− trials were analyzed separately. For CRs during the T+ trials there were no significant group differences for FND 40, t(21) = 0.29, p = .775, or FND 0.6, t(21) = 0.56, p = .579. However, for CRs during the TL− trials, there was a significant group difference for FND 40, t(21) = −2.72, p < .02, but not FND 0.6, t(21) = 1.87, p = .075, indicating that that the OX7-saporin group had an earlier CR onset during the TL− trials than the saline rats.
Figure 4.
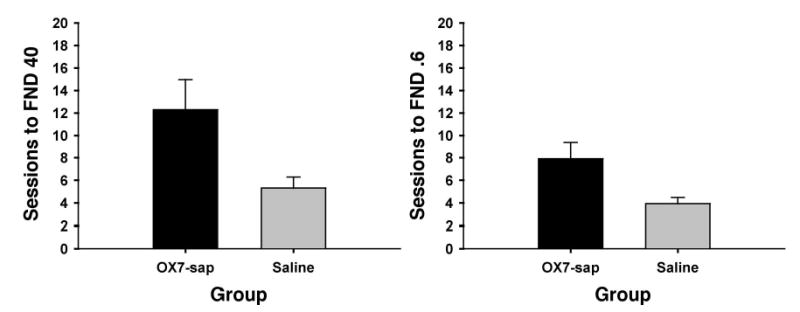
Mean (+ SEM) sessions to criterion for Phase 3 (2-kHz tone [T+] and 2-kHz tone plus light [TL−] acquisition) for the OX7-saporin (OX7-sap) and saline groups using the feature-negative discrimination (FND) 40 criterion (left) and the FND 0.6 criterion (right). See Method section for description of the criteria.
Figure 5.
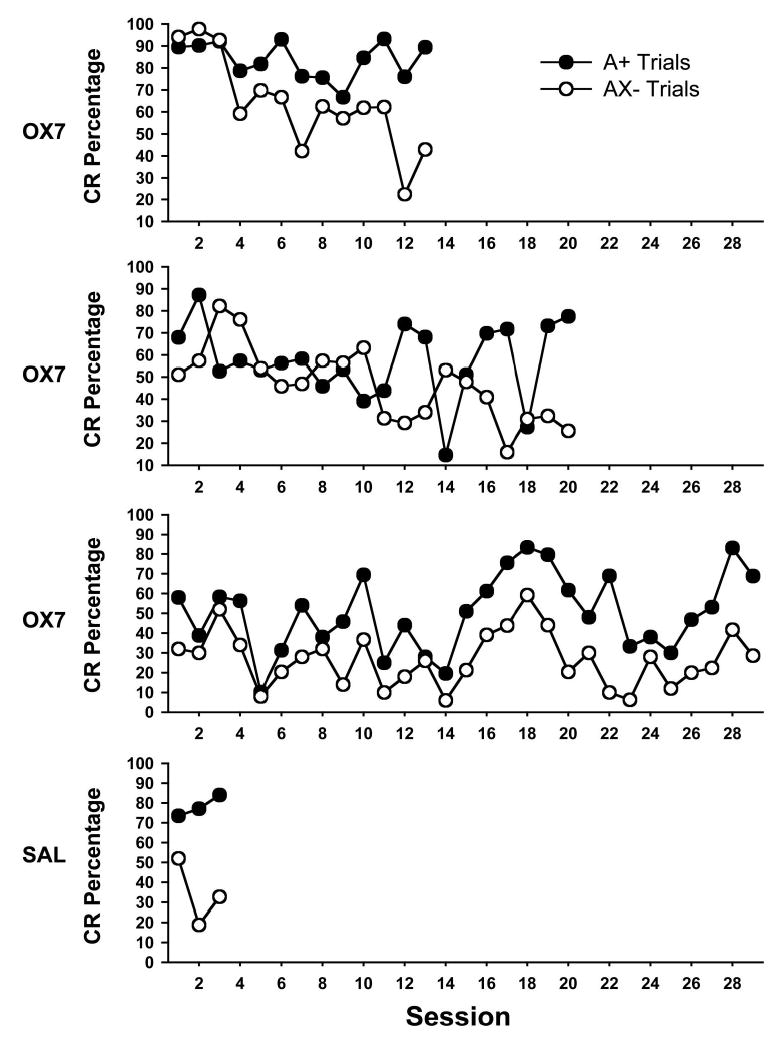
Percentage of conditioned responses (CRs) during conditioned inhibition training (Phase 3) for 3 rats that were given OX7-saporin (OX7) and 1 rat that was given saline (SAL). Solid circles indicate CR percentage during the trials with reinforced presentations of the excitatory stimulus (A+), and open circles indicate CR percentage during trials with unreinforced presentations of the inhibitory compound stimulus (AX−).
Both OX7-saporin and saline groups showed a summation effect. An ANOVA was performed on the summation test data, which indicated no significant group effects, F(1, 14) = 1.15, p = .303. For the retardation test, the OX7-saporin group showed lower percentages of CRs during both sessions. A repeated measures ANOVA was performed on the retardation data, which indicated a main effect by group, F(1, 21) = 5.82, p < .03, and by session, F(1, 21) = 34.71, p < .001, but no interaction of the group and sessions factors, F(1, 21) = 2.36, p = .139. Because the retardation test involves new excitatory learning, and the current data clearly indicate an impairment of excitatory conditioning for OX7-saporin rats, the lower rate of responding in this group does not indicate stronger inhibitory conditioning.
Cannula Placement
Histological analysis of forebrain sections was conducted on all rats. Because the 23-ga guide cannula remained in place until after the perfusion, there was typically a very clear indication of the cannula location. Subjects that showed cannula placements outside the lateral ventricle were excluded from further analysis.
General Histology
Previous studies using OX7-saporin indicated that its effects are selective for Purkinje cells (Angner et al., 2000; Davis & Wiley, 1989; Gandhi et al., 2000; Waite et al., 1999; Wrenn & Wiley, 2001). However, it was possible that OX7-saporin could affect other neuronal populations that contribute to excitatory or inhibitory eyeblink conditioning. A qualitative analysis of the entire brain indicated that cell loss was selective for Purkinje cells and neurons in the inferior olive. Figure 6 shows example photographs of the cerebellar cortex for saline and OX7-saporin rats. The moderate cell loss in the inferior olive associated with Purkinje cell depletion is also seen following cerebellar cortical lesions (Harvey et al., 1993; Lavond et al., 1987; Woodruff-Pak et al., 1993; Yeo et al., 1985) and in pcd mice (Chen, Bao, Lockard, Kim, & Thompson, 1996; Chen, Bao, & Thompson, 1999). Other components of the eyeblink conditioning circuitry, including the cochlear nuclei, pontine nuclei, red nucleus, facial motor nucleus, and deep nuclei (see below), were unaffected by OX7-saporin.
Figure 6.
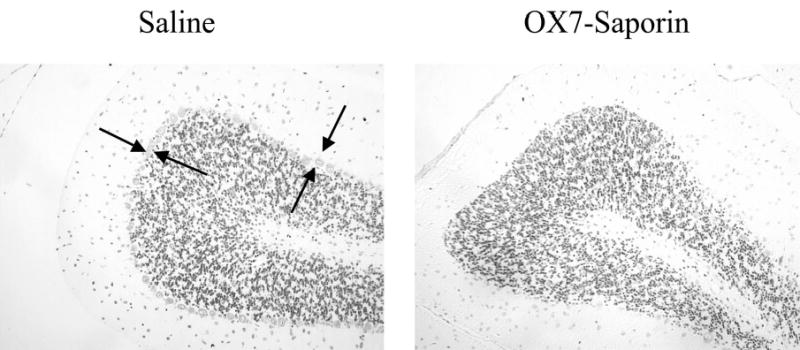
Light photomicrographs of rat cerebellar cortex showing the Purkinje cell layer (between arrows) in a rat infused with saline (left) and a rat infused with OX7-saporin (right).
Purkinje and Interpositus Nucleus Cell Counts
Purkinje cell and interpositus nucleus cell counts were performed as described above for all OX7-saporin rats that had properly placed cannulas and 6 of the saline rats. Administration of OX7-saporin reduced Purkinje cells by 64.7% (range = 14%–90%) in counts of the whole cerebellum, 68.4% (range = 2%–97%) in lobule HVI, and 73.0% (range = 10%–96%) in the anterior lobe when compared with the mean counts in the saline group. t tests revealed significant group differences for the Purkinje cell counts of the whole section, t(18) = 5.48, p < .001; lobule HVI, t(18) = 5.37, p < .001; and anterior lobe, t(18) = 5.35, p < .001, but not for the interpositus neuron counts, t(18) = 0.31, p= .757.
Regression Analysis
Table 2 summarizes the F value, p value, and Pearson’s r for relationships between Purkinje cell counts and CR measures from Phase 2 (reacquisition) and Phase 3 (conditioned inhibition), as well as comparisons between the first acquisition session and the first reacquisition session. For the reacquisition phase, there was a significant negative relationship between the number of sessions to criterion and Purkinje cell counts in the whole cerebellum, lobule HVI, and anterior lobe (see Figure 7). There were no other significant correlations between Purkinje cell counts and behavioral measures during reacquisition. For conditioned inhibition training (Phase 3), there was no significant relationship between Purkinje cell counts and any of the behavioral measures with the FND 40 criterion. However, for the FND 0.6 criterion, there were significant negative correlations between the number of sessions to criterion and Purkinje cell counts in the anterior lobe and whole sections (see Figure 8). There was a significant negative relationship between the difference in percentage of CRs from the first session of reacquisition and the first session of acquisition and Purkinje cell counts in the whole cerebellum, lobule HVI, and anterior lobe (see Figure 9).
Table 2.
Regression Analysis and Pearson’s r for Purkinje Cell Count Numbers Versus the Behavioral Measures
| Cell count and behavioral measure | F | p | Pearson’s r |
|---|---|---|---|
| Phase 2 (reacquisition, df = 1, 17) | |||
| Whole section | |||
| Sessions to criterion | 6.151 | .024* | −.515 |
| CR onset latency | 0.517 | .482 | .172 |
| CR peak latency | 0.279 | .604 | .172 |
| CR amplitude | 1.291 | .272 | .266 |
| Lobule HVI | |||
| Sessions to criterion | 6.427 | .021* | −.524 |
| CR onset latency | 0.367 | .552 | .145 |
| CR peak latency | 0.118 | .735 | .083 |
| CR amplitude | 0.477 | .499 | .165 |
| Anterior lobe | |||
| Sessions to criterion | 4.802 | .043* | −.469 |
| CR onset latency | 0.618 | .443 | .187 |
| CR peak latency | 0.315 | .582 | .135 |
| CR amplitude | 1.699 | .210 | .301 |
| Phase 3 (FND 40, df = 1, 14) | |||
| Whole section | |||
| Sessions to criterion | 2.092 | .170 | −.361 |
| CR onset latency T+ | 3.171 | .097 | .430 |
| CR onset latency TL− | 3.240 | .093 | .434 |
| Lobule HVI | |||
| Sessions to criterion | 0.625 | .425 | −.214 |
| CR onset latency T+ | 2.038 | .175 | .357 |
| CR onset latency TL− | 2.108 | .169 | .362 |
| Anterior lobe | |||
| Sessions to criterion | 2.703 | .122 | −.402 |
| CR onset latency T+ | 4.145 | .061 | .478 |
| CR onset latency TL− | 3.457 | .084 | .445 |
| Phase 3 (FND 0.6, df = 1, 14) | |||
| Whole section | |||
| Sessions to criterion | 7.860 | .014* | −.600 |
| CR onset latency T+ | 0.822 | .380 | .235 |
| CR onset latency TL− | 2.879 | .112 | .413 |
| Lobule HVI | |||
| Sessions to criterion | 4.301 | .057 | −.485 |
| CR onset latency T+ | 0.568 | .464 | .197 |
| CR onset latency TL− | 2.194 | .161 | .368 |
| Anterior lobe | |||
| Sessions to criterion | 8.588 | .011* | −.617 |
| CR onset latency T+ | 1.098 | .312 | .270 |
| CR onset latency TL− | 2.981 | .106 | .419 |
| R1 (Phase 2) − A1 (Phase 1), (df = 1, 17) | |||
| Whole section | |||
| Difference in CR% | 20.294 | .000* | .738 |
| Difference in CR onset latency | 1.668 | .219 | −.337 |
| Difference in CR peak latency | 0.006 | .941 | .021 |
| Difference in CR amplitude | 0.311 | .586 | .153 |
| Lobule HVI | |||
| Difference in CR% | 13.883 | .002* | .670 |
| Difference in CR onset latency | 0.606 | .450 | −.211 |
| Difference in CR peak latency | 0.224 | .644 | .130 |
| Difference in CR amplitude | 0.425 | .526 | .178 |
| Anterior lobe | |||
| Difference in CR% | 18.987 | .000* | .726 |
| Difference in CR onset latency | 1.276 | .279 | −.299 |
| Difference in CR peak latency | 0.034 | .856 | .051 |
| Difference in CR amplitude | 0.320 | .581 | .155 |
Note. CR = conditioned response; FND = feature-negative discrimination; T+ = 2-kHz tone paired with the shock unconditioned stimulus (US); TL− =2-kHz tone presented concurrently with a light with no US; R = reacquisition; A = acquisition.
p < .05.
Figure 7.
Scatter plots of the number of sessions to criterion during reacquisition versus the Purkinje cell counts in the entire cortex (top), lobule HVI (middle), and anterior lobe (bottom) for OX7-saporin (OX7-sap) and saline groups.
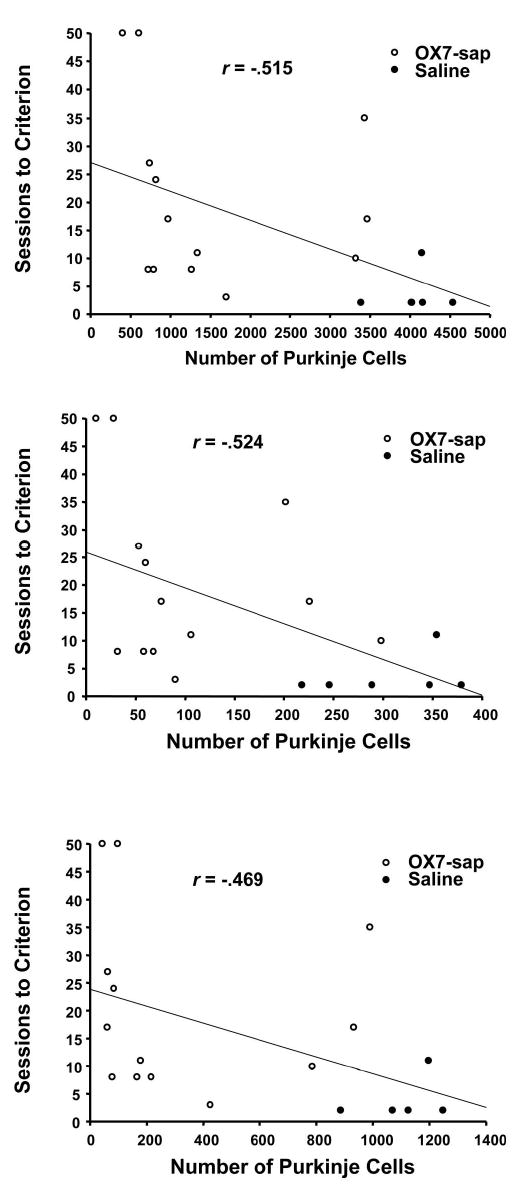
Figure 8.
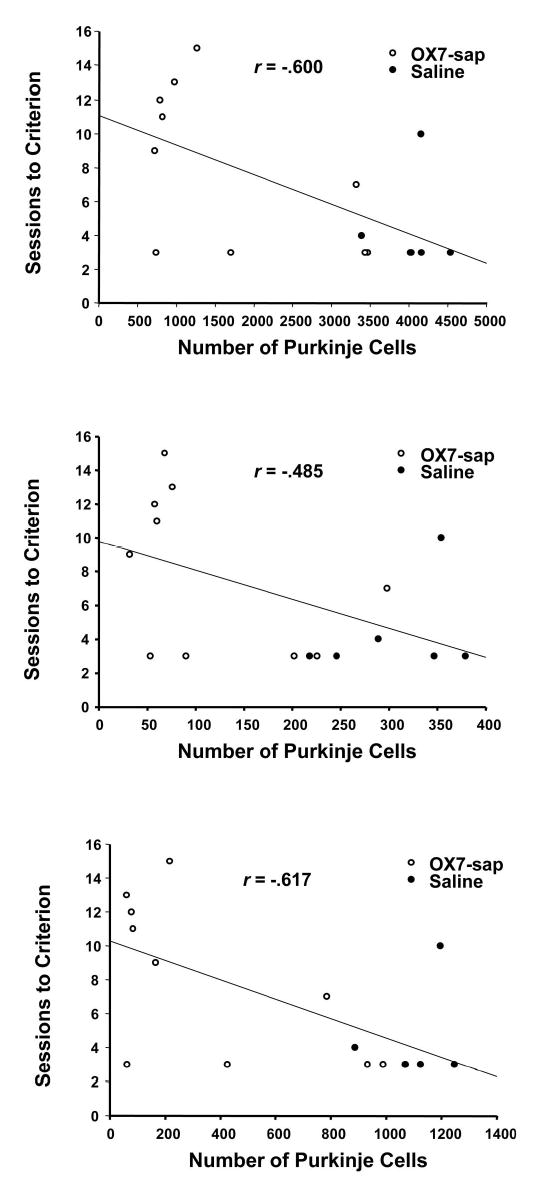
Scatter plots of the number of sessions to criterion versus the Purkinje cell counts for the entire cortex (top), lobule HVI (middle), and anterior lobe (bottom) for OX7-saporin (OX7-sap) and saline groups on T+ and TL− acquisition (FND 0.6), with regression line included. T+ =2-kHz tone; TL− =2-kHz tone plus light; FND = feature-negative discrimination.
Figure 9.
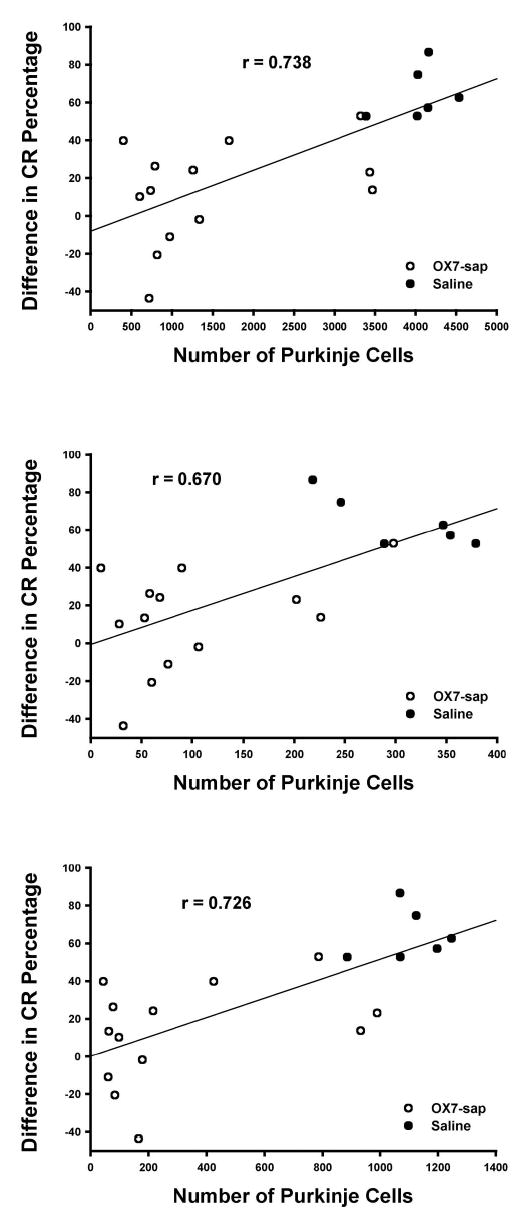
Scatter plots of the difference in conditioned response (CR) percentage between first session reacquisition and first session acquisition (R1–A1) versus the Purkinje cell counts for the entire cerebellum (top), lobule HVI (middle), and the anterior lobe (bottom) for OX7-saporin (OX7-sap) and saline groups.
The relationship between subjective ataxia scores and Purkinje cell counts was also examined with linear regression. The ataxia scores showed a significant positive linear relationship with the whole section count, F(1, 17) = 131.66, p = .000; HVI count, F(1, 17) = 85.30, p = .000; and the anterior lobe count, F(1, 17) = 129.33, p = .000.
Discussion
OX7-saporin administration reduced the number of Purkinje cells throughout the cerebellar cortex by an average of 64.7% (range = 14%–90%). Rats with Purkinje cell loss were severely impaired during reacquisition of excitatory eyeblink conditioning. The magnitude of the reacquisition deficit was correlated with the magnitude of Purkinje cell loss. Comparison of the first day of acquisition training and the first day of reacquisition training indicated that the rats with Purkinje cell depletion showed very little retention or savings. Purkinje cell loss also produced a deficit in acquisition of conditioned inhibition. Although impaired, reacquisition of excitatory conditioning and acquisition of conditioned inhibition were not prevented by Purkinje cell loss.
Rats with Purkinje cell depletion reacquired conditioning at a slower rate than they initially acquired CRs. The reacquisition deficit in the current study is more severe than seen in some of the lesions studies (Lavond et al., 1987; Perret et al., 1993; Woodruff-Pak et al., 1993) but less severe than seen in other lesion studies (Yeo et al., 1985; Yeo & Hardiman, 1992). The effects of OX7-saporin on reacquisition may be more severe than the effects of lesions used in some of the previous studies (Lavond et al., 1987; Perret et al., 1993; Woodruff-Pak et al., 1993) because the Purkinje cell depletion following OX7-saporin treatment is more widespread, affecting posterior lobules and the contralateral hemisphere. The more widespread effects of OX7-saporin could have affected cortical blink zones (Hesslow, 1994) that were not included in the lesions in previous studies. On the other hand, the effects of OX7-saporin may be less severe than the effects of lesions in other studies (Yeo et al., 1985; Yeo & Hardiman, 1992) because some of the Purkinje cells survived in the critical cortical regions (i.e., lobule HVI and lobules IV and V of the anterior lobe). The remaining Purkinje cells in the critical regions may also be responsible for producing CRs with normal topographies after extensive retraining.
The deficit in acquisition of conditioned inhibition following Purkinje cell depletion is similar in magnitude to the deficit produced by large cerebellar cortical lesions (Logan, 1991). The impairment and subsequent acquisition of conditioned inhibition in depleted rats suggests that Purkinje cell inhibition plays a role in the acquisition process. However, another neural system must be necessary for maintenance of conditioned inhibition because pharmacological blockade of Purkinje cell inhibition of the cerebellar nuclei with picrotoxin does not affect CR inhibition during discrimination sessions in well-trained rats (Nolan et al., 2002). One possibility is that the deep nuclei fulfill this role, as seen with excitatory conditioning. Evidence against a role for the cerebellar deep nuclei in conditioned inhibition comes from a preliminary study, which found that muscimol inactivation of the cerebellar nuclei during acquisition of conditioned inhibition blocks CR production but does not prevent acquisition of inhibitory conditioning (Freeman & Halverson, 2003). On the basis of the present findings and those of muscimol inactivation studies, it is likely that acquisition and maintenance of conditioned inhibition depend on extracerebellar structures.
Clues about extracerebellar systems that could influence the eyeblink conditioning circuitry during conditioned inhibition can be found in a study that used transynaptic tracing of rabies virus from the eyelid muscle into the brain in rats (Morcuende, Delgado-Garcia, & Ugolini, 2002). Monosynaptic projections to the facial motor nucleus (the neurons that produce the blink response) from many brainstem regions, including the red nucleus, the reticular areas of the pons and medulla, auditory nuclei, and some of the oculomotor nuclei, were identified. Multisynaptic projections to the facial motor nucleus from the superior colliculus, thalamic areas, and cerebral cortex were observed. Evidence supporting a role for the red nucleus in conditioned inhibition comes from unit recording studies, which found that neuronal activity in the red nucleus exhibits a stronger correlation with conditioned inhibition in rabbits than neuronal activity in the interpositus nucleus (Britton, Brown, & Steinmetz, 2000; Brown, Britton, & Steinmetz, 2000). Inhibitory learning in the red nucleus could affect eyeblink CRs by directly modifying excitatory input to the facial nucleus. Evidence supporting a role for the superior colliculus in conditioned inhibition comes from a study that found that lesions of this structure impaired FND in the fear potentiated startle paradigm (Waddell, Heldt, & Falls, 2003). Conditioning-specific changes in metabolic activity in the medial geniculate area and other auditory areas have also been demonstrated during FND paradigms (McIntosh & Gonzalez-Lima, 1993, 1994, 1995, 1998). Midbrain regions associated with oculomotor responses including the nucleus of Darkschewitsch and interstitial nucleus of Cajal have been implicated in the acquisition of eyeblink conditioned inhibition, but the precise roles of these nuclei are not clear (Berthier & Moore, 1980; Blazis & Moore, 1991; Mis, 1977). The highest order multisynaptic connections to the facial motor nucleus include areas of the neocortex. However, lesions of the hippocampus or decortication do not disrupt eyeblink conditioned inhibition acquisition or retention (Moore, Yeo, Oakley, & Russell, 1980; Solomon, 1977; Yeo, Hardiman, Moore, & Russell, 1983). As indicated above, there are multiple brain systems outside of the cerebellum that could play a role in acquisition and retention of conditioned inhibition. Current studies are examining the roles of midbrain and forebrain structures in eyeblink conditioned inhibition.
The current findings are somewhat consistent with models of eyeblink conditioning that posit a role for cerebellar cortical plasticity in acquisition of conditioned inhibition (Freeman & Nicholson, 1999; Mauk & Donegan, 1997; Moore & Choi, 1997). Purkinje cell loss is associated with an impairment in acquisition of inhibitory conditioning. In addition, the magnitude of Purkinje cell loss was negatively correlated with the rate of acquisition of inhibitory conditioning. However, other findings of the current study are not consistent with models and experimental findings that indicate a role for the cerebellar cortex in CR timing (Bao et al., 2002; Garcia et al., 1999; Garcia & Mauk, 1998; Mauk & Donegan, 1997; McCormick & Thompson, 1984a; Perret et al., 1993). The reduction in CR latency observed in studies that used lesions or GABA receptor blockade was not seen after substantial Purkinje cell loss. Moreover, there were no significant correlations between the magnitude of Purkinje cell loss and CR latency. The largest and most consistent alterations in CR latency are seen when the anterior lobe is damaged in lesion studies (Garcia et al., 1999; Perret et al., 1993). The anterior lobe was severely affected by OX7-saporin, resulting in a Purkinje cell reduction of as much as 96%, but this did not consistently result in shorter latency CRs. The lack of an effect on CR topography following Purkinje cell depletion suggests that CR timing can be controlled by the cerebellar nuclei or an extracerebellar system. Alternatively, the remaining Purkinje cells might be sufficient for controlling CR timing despite the massive deficit in CR percentage, which would suggest that each Purkinje cell plays a relatively greater role in CR timing than CR acquisition.
The effects of Purkinje cell depletion following intraventricular infusion of OX7-saporin indicate that the cerebellar cortex plays important, but different, roles in excitatory and inhibitory eyeblink conditioning in rats. The current findings suggest that Purkinje cells are essential for maintenance of excitatory eyeblink conditioning. Rats with severe loss of Purkinje cells showed impaired retention and savings of preinfusion excitatory conditioning. Purkinje cells are also involved in acquisition of conditioned inhibition but are not essential. Purkinje cell loss did not prevent acquisition of conditioned inhibition, and blockade of GABAergic inhibition in the cerebellar nuclei does not impair retention of CR inhibition (Nolan et al., 2002), suggesting that extracerebellar structures play a critical role in conditioned inhibition. Current studies are examining the roles of midbrain and forebrain structures in eyeblink conditioned inhibition.
Footnotes
This research was supported by National Institute for Neurologic Disorders and Stroke Grant NS38890 and National Institute of Mental Health Grant MH065483 to John H. Freeman Jr.
References
- Albus JS. A theory of cerebellar function. Mathematical Biosciences. 1971;10:25–61. [Google Scholar]
- Angner RT, Kelly RM, Wiley RG, Walsh TJ, Reuhl KR. Preferential destruction of cerebellar Purkinje cells by OX7-saporin. Neurotoxicology. 2000;21:395–404. [PubMed] [Google Scholar]
- Attwell PJE, Cooke SF, Yeo CH. Cerebellar function in consolidation of a motor memory. Neuron. 2002;34:1011–1020. doi: 10.1016/s0896-6273(02)00719-5. [DOI] [PubMed] [Google Scholar]
- Attwell PJE, Rahman S, Ivarsson M, Yeo CH. Cerebellar cortical AMPA-kainate receptor blockade prevents performance of classically conditioned nictitating membrane responses. Journal of Neuroscience. 1999;19(RC45):1–6. doi: 10.1523/JNEUROSCI.19-24-j0003.1999. [DOI] [PMC free article] [PubMed] [Google Scholar]
- Attwell PJE, Rahman S, Yeo CH. Acquisition of eyeblink conditioning is critically dependent on normal function in cerebellar cortical lobule HVI. Journal of Neuroscience. 2001;21:5715–5722. doi: 10.1523/JNEUROSCI.21-15-05715.2001. [DOI] [PMC free article] [PubMed] [Google Scholar]
- Bao S, Chen L, Kim JJ, Thompson RF. Cerebellar cortical inhibition and classical eyeblink conditioning. Proceedings of the National Academy of Sciences, USA. 2002;99:1592–1597. doi: 10.1073/pnas.032655399. [DOI] [PMC free article] [PubMed] [Google Scholar]
- Berthier NE, Moore JW. Disrupted conditioned inhibition of the rabbit nictitating membrane response following mesencephalic lesions. Physiology & Behavior. 1980;25:667–673. doi: 10.1016/0031-9384(80)90368-6. [DOI] [PubMed] [Google Scholar]
- Berthier NE, Moore JW. Cerebellar Purkinje cell activity related to the classically conditioned nictitating membrane response. Experimental Brain Research. 1986;63:341–350. doi: 10.1007/BF00236851. [DOI] [PubMed] [Google Scholar]
- Blanks JC, Spee C. Retinal degeneration in the pcd/pcd mutant mouse: Accumulation of spherules in the interphotoreceptor space. Experimental Eye Research. 1992;54:637–644. doi: 10.1016/0014-4835(92)90019-o. [DOI] [PubMed] [Google Scholar]
- Blazis DEJ, Moore JW. Conditioned inhibition of the nictitating membrane response in rabbits following hypothalamic and mesencephalic lesions. Behavioural Brain Research. 1991;46:71–81. doi: 10.1016/s0166-4328(05)80098-1. [DOI] [PubMed] [Google Scholar]
- Borges LF, Elliott PJ, Gill R, Iversen SD, Iversen LL. Selective extraction of small and large molecules from the cerebrospinal fluid by Purkinje neurons. Science. 1985 April 19;228:346–348. doi: 10.1126/science.2580350. [DOI] [PubMed] [Google Scholar]
- Britton, G., Brown, T. C., & Steinmetz, J. E. (2000). Single-unit activity from interpositus nucleus during conditioned inhibition of the eyeblink response [Abstract]. Poster session presented at the annual meeting of the Society for Neuroscience (Program No. 268.7). Retrieved from http://sfn.scholarone.com/itin2000
- Brown, T. C., Britton, G., & Steinmetz, J. E. (2000). The role of the red nucleus in conditioned inhibition of the rabbit eyeblink response [Abstract]. Poster session presented at the annual meeting of the Society for Neuroscience (Program No. 268.8) Retrieved from http://scholarone.com/itin2000
- Chen L, Bao S, Lockard JM, Kim JJ, Thompson RF. Impaired classical eyeblink conditioning in cerebellar-lesioned and Purkinje cell-degeneration ( pcd) mutant mice. Journal of Neuroscience. 1996;16:2829–2838. doi: 10.1523/JNEUROSCI.16-08-02829.1996. [DOI] [PMC free article] [PubMed] [Google Scholar]
- Chen L, Bao S, Thompson RF. Bilateral lesions of the interpositus nucleus completely prevent eyeblink conditioning in Purkinje cell-degeneration mutant mice. Behavioral Neuroscience. 1999;113:204–210. doi: 10.1037//0735-7044.113.1.204. [DOI] [PubMed] [Google Scholar]
- Christian KM, Thompson RF. Neural substrates of eyeblink conditioning: Acquisition and retention. Learning & Memory. 2003;10:427–455. doi: 10.1101/lm.59603. [DOI] [PubMed] [Google Scholar]
- Davis TL, Wiley RG. Anti-thy-1 immunotoxin, OX7-saporin, destroys cerebellar Purkinje cells after intraventricular injection in rats. Brain Research. 1989;504:216–222. doi: 10.1016/0006-8993(89)91360-7. [DOI] [PubMed] [Google Scholar]
- Freeman JH, Jr, Carter CS, Stanton ME. Early cerebellar lesions impair eyeblink conditioning in developing rats: Differential effects of unilateral lesions on postnatal day 10 or 20. Behavioral Neuroscience. 1995;109:893–902. doi: 10.1037//0735-7044.109.5.893. [DOI] [PubMed] [Google Scholar]
- Freeman, J. H., Jr., & Halverson, H. E. (2003, November). Differential effects of cerebellar inactivation on eyeblink conditioned excitation and inhibition in rats Poster session presented at the annual meeting of the Society for Neuroscience (Program No. 87.2). Retrieved from http://sfn.scholarone.com/itin03/html [DOI] [PMC free article] [PubMed]
- Freeman JH, Jr, Nicholson DA. Neuronal activity in the cerebellar interpositus and lateral pontine nuclei during inhibitory classical conditioning of the eyeblink response. Brain Research. 1999;833:225–233. doi: 10.1016/s0006-8993(99)01547-4. [DOI] [PubMed] [Google Scholar]
- Gandhi CC, Kelly RM, Wiley RG, Walsh TJ. Impaired acquisition of a Morris water maze task following selective destruction of Purkinje cells with OX7-saporin. Behavioural Brain Research. 2000;109:37–47. doi: 10.1016/s0166-4328(99)00160-6. [DOI] [PubMed] [Google Scholar]
- Garcia KS, Mauk MD. Pharmacological analysis of cerebellar contributions to the timing and expression of conditioned eyelid responses. Neuropharmacology. 1998;37:471–480. doi: 10.1016/s0028-3908(98)00055-0. [DOI] [PubMed] [Google Scholar]
- Garcia KS, Steele PM, Mauk MD. Cerebellar cortex lesions prevent acquisition of conditioned eyelid responses. Journal of Neuroscience. 1999;19:10940–10947. doi: 10.1523/JNEUROSCI.19-24-10940.1999. [DOI] [PMC free article] [PubMed] [Google Scholar]
- Gould TJ, Steinmetz JE. Multiple-unit activity from rabbit cerebellar cortex and interpositus nucleus during classical discrimination/reversal eyelid conditioning. Brain Research. 1994;652:98–106. doi: 10.1016/0006-8993(94)90322-0. [DOI] [PubMed] [Google Scholar]
- Gould TJ, Steinmetz JE. Changes in rabbit cerebellar cortical and interpositus nucleus activity during acquisition, extinction, and backward classical conditioning. Neurobiology of Learning and Memory. 1996;65:17–34. doi: 10.1006/nlme.1996.0003. [DOI] [PubMed] [Google Scholar]
- Harvey JA, Welsh JP, Yeo CH, Romano AG. Recoverable and nonrecoverable deficits in conditioned responses after cerebellar cortical lesions. Journal of Neuroscience. 1993;13:1624–1635. doi: 10.1523/JNEUROSCI.13-04-01624.1993. [DOI] [PMC free article] [PubMed] [Google Scholar]
- Hesslow G. Correspondence between climbing fiber input and motor output in eyeblink-related areas in cat cerebellar cortex. Journal of Physiology. 1994;476:229–244. doi: 10.1113/jphysiol.1994.sp020126. [DOI] [PMC free article] [PubMed] [Google Scholar]
- Hesslow G, Ivarsson M. Suppression of cerebellar Purkinje cells during conditioned responses in ferrets. NeuroReport. 1994;5:649–652. doi: 10.1097/00001756-199401000-00030. [DOI] [PubMed] [Google Scholar]
- Lavond DG, Steinmetz JE. Acquisition of classical conditioning without cerebellar cortex. Behavioural Brain Research. 1989;33:113–164. doi: 10.1016/s0166-4328(89)80047-6. [DOI] [PubMed] [Google Scholar]
- Lavond DG, Steinmetz JE, Yokaitis MH, Thompson RF. Reacquisition of classical conditioning after removal of cerebellar cortex. Experimental Brain Research. 1987;67:569–593. doi: 10.1007/BF00247289. [DOI] [PubMed] [Google Scholar]
- Logan, C. G. (1991). Cerebellar cortical involvement in excitatory and inhibitory classical conditioning. Unpublished doctoral dissertation, Stanford University.
- Mamounas LA, Thompson RF, Madden JIV. Cerebellar GABAergic processes: Evidence for critical involvement in a form of simple associative learning in the rabbit. Proceedings of the National Academy of Sciences, USA. 1987;84:2101–2105. doi: 10.1073/pnas.84.7.2101. [DOI] [PMC free article] [PubMed] [Google Scholar]
- Marchant HG, Mis FW, Moore JW. Conditioned inhibition of the rabbit’s nictitating membrane response. Journal of Experimental Psychology. 1972;95:408–411. doi: 10.1037/h0033698. [DOI] [PubMed] [Google Scholar]
- Mauk MD, Donegan NH. A model of Pavlovian eyelid conditioning based on the synaptic organization of the cerebellum. Learning & Memory. 1997;3:130–158. doi: 10.1101/lm.4.1.130. [DOI] [PubMed] [Google Scholar]
- McCormick DA, Clark GA, Lavond DG, Thompson RF. Initial localization of the memory trace for a basic form of learning. Proceedings of the National Academy of Sciences, USA. 1982;79:2731–2735. doi: 10.1073/pnas.79.8.2731. [DOI] [PMC free article] [PubMed] [Google Scholar]
- McCormick DA, Thompson RF. Cerebellum: Essential involvement in the classically conditioned eyelid response. Science. 1984a January 20;223:296–299. doi: 10.1126/science.6701513. [DOI] [PubMed] [Google Scholar]
- McCormick DA, Thompson RF. Neuronal responses of the rabbit cerebellum during acquisition and performance of a classically conditioned nictitating membrane-eyelid response. Journal of Neuroscience. 1984b;11:2811–2822. doi: 10.1523/JNEUROSCI.04-11-02811.1984. [DOI] [PMC free article] [PubMed] [Google Scholar]
- McIntosh AR, Gonzalez-Lima F. Network analysis of functional auditory pathways mapped with fluorodeoxyglucose: Associative effects of a tone conditioned as a Pavlovian excitor or inhibitor. Brain Research. 1993;627:129–140. doi: 10.1016/0006-8993(93)90756-d. [DOI] [PubMed] [Google Scholar]
- McIntosh AR, Gonzalez-Lima F. Network interactions among limbic cortices, basal forebrain, and cerebellum differentiate a tone conditioned as a Pavlovian excitor of inhibitor: Fluorodeoxyglucose mapping and covariance structural modeling. Journal of Neurophysiology. 1994;72:1717–1733. doi: 10.1152/jn.1994.72.4.1717. [DOI] [PubMed] [Google Scholar]
- McIntosh AR, Gonzalez-Lima F. Functional network interactions between parallel auditory pathways during Pavlovian conditioned inhibition. Brain Research. 1995;683:228–241. doi: 10.1016/0006-8993(95)00378-4. [DOI] [PubMed] [Google Scholar]
- McIntosh AR, Gonzalez-Lima F. Large-scale functional connectivity in associative learning: Interrelations of the rat auditory, visual, and limbic systems. Journal of Neurophysiology. 1998;80:3148–3162. doi: 10.1152/jn.1998.80.6.3148. [DOI] [PubMed] [Google Scholar]
- Medina JF, Garcia KS, Mauk MD. A mechanism for savings in the cerebellum. Journal of Neuroscience. 2001;21:4081–4089. doi: 10.1523/JNEUROSCI.21-11-04081.2001. [DOI] [PMC free article] [PubMed] [Google Scholar]
- Medina JF, Garcia KS, Nores WL, Taylor NM, Mauk MD. Timing mechanisms in the cerebellum: Testing prediction of a large-scale computer simulation. Journal of Neuroscience. 2000;20:5516–5525. doi: 10.1523/JNEUROSCI.20-14-05516.2000. [DOI] [PMC free article] [PubMed] [Google Scholar]
- Mis FW. A midbrain-brainstem circuit for conditioned inhibition of the nictitating membrane response in the rabbit (Oryctolagus cuniculus) Journal of Comparative and Physiological Psychology. 1977;91:975–988. [Google Scholar]
- Moore JW, Choi JS. Conditioned response timing and integration in the cerebellum. Learning & Memory. 1997;4:116–129. doi: 10.1101/lm.4.1.116. [DOI] [PubMed] [Google Scholar]
- Moore JW, Yeo CH, Oakley DA, Russell IS. Conditioned inhibition of the nictitating membrane response in decorticate rabbits. Behavioural Brain Research. 1980;1:397–409. doi: 10.1016/0166-4328(80)90037-6. [DOI] [PubMed] [Google Scholar]
- Morcuende S, Delgado-Garcia JM, Ugolino G. Neuronal premotor networks involved in eyelid responses: Retrograde transneuronal tracing with rabies virus from the orbicularis oculi muscle in the rat. Journal of Neuroscience. 2002;22:8808–8818. doi: 10.1523/JNEUROSCI.22-20-08808.2002. [DOI] [PMC free article] [PubMed] [Google Scholar]
- Morris RJ, Beech JN, Barber PC, Raisman G. Early stages of Purkinje cell maturation demonstrated by Thy-1 immunohistochemistry on postnatal rat cerebellum. Journal of Neurocytology. 1985;14:427–452. doi: 10.1007/BF01217754. [DOI] [PubMed] [Google Scholar]
- Morris RJ, Raisman G. Estimation of Thy-1 in cryostat sections of nervous tissue. Journal of Neurochemistry. 1983;40:637–644. doi: 10.1111/j.1471-4159.1983.tb08028.x. [DOI] [PubMed] [Google Scholar]
- Nicholson DA, Freeman JH., Jr Neuronal correlates of conditioned inhibition of the eyeblink response in the anterior interpositus nucleus. Behavioral Neuroscience. 2002;116:22–36. [PubMed] [Google Scholar]
- Nolan BC, Nicholson DA, Freeman JH., Jr Blockade of GABAA receptors in the interpositus nucleus modulates conditioned excitation but not conditioned inhibition of the eyeblink response. Integrative Physiological and Behavioral Science. 2002;37:293–310. doi: 10.1007/bf02734250. [DOI] [PMC free article] [PubMed] [Google Scholar]
- Perret SP, Ruiz BP, Mauk MD. Cerebellar cortex lesions disrupt learning-dependent timing of conditioned eyelid responses. Journal of Neuroscience. 1993;13:1708–1718. doi: 10.1523/JNEUROSCI.13-04-01708.1993. [DOI] [PMC free article] [PubMed] [Google Scholar]
- Rasband, W. (2004). Image J [Computer software]. Retrieved from http://rsb.info.nih.gov/ij/
- Rescorla RA. Pavlovian conditioned inhibition. Psychological Bulletin. 1969;72:77–94. [Google Scholar]
- Rescorla, R. A., & Wagner, A. R. (1972). A theory of Pavlovian conditioning; Variations in the effectiveness of reinforcement and nonreinforcement. In A. H. Black & W. F. Prokasy (Eds.), Classical conditioning II: Current research and theory (pp. 64–99). New York: Appleton-Century-Crofts.
- Schreurs BG, Gusev PA, Tomsic D, Alkon DL, Shi T. Intracellular correlates of acquisition and long-term memory of classical conditioning in Purkinje cell dendrites in slices of rabbit cerebellar lobule HVI. Journal of Neuroscience. 1998;18:5498–5507. doi: 10.1523/JNEUROSCI.18-14-05498.1998. [DOI] [PMC free article] [PubMed] [Google Scholar]
- Schreurs BG, Sanchez-Andres JV, Alkon DL. Learning-specific differences in Purkinje cell dendrites of lobule HVI (lobulus simplex): Intracellular recording in a rabbit cerebellar slice. Brain Research. 1991;548:18–22. doi: 10.1016/0006-8993(91)91100-f. [DOI] [PubMed] [Google Scholar]
- Schreurs BG, Tomsic D, Gusev PV, Alkon DL. Dendritic excitability microzones and occluded long-term depression after classical conditioning of the rabbit’s nictitating membrane response. Journal of Neurophysiology. 1997;77:86–92. doi: 10.1152/jn.1997.77.1.86. [DOI] [PubMed] [Google Scholar]
- Solomon PR. Role of the hippocampus in blocking and conditioned inhibition of the rabbit’s nictitating membrane response. Journal of Comparative and Physiological Psychology. 1977;91:407–417. doi: 10.1037/h0077330. [DOI] [PubMed] [Google Scholar]
- Thompson RF. The neurobiology of learning and memory. Science. 1986 August 29;233:941–947. doi: 10.1126/science.3738519. [DOI] [PubMed] [Google Scholar]
- Waddell J, Heldt S, Falls WA. Posttraining lesion of the superior colliculus interferes with feature-negative discrimination of fear-potentiated startle. Behavioural Brain Research. 2003;142:115–124. doi: 10.1016/s0166-4328(02)00405-9. [DOI] [PubMed] [Google Scholar]
- Waite JJ, Wardlow ML, Power AE. Deficit in selective and divided attention associated with cholinergic basal forebrain immunotoxic lesion produced by 192-saporin; motoric/sensory deficit associated with Purkinje cell immunotoxic lesion produced by OX7-saporin. Neurobiology of Learning and Memory. 1999;71:325–352. doi: 10.1006/nlme.1998.3884. [DOI] [PubMed] [Google Scholar]
- Woodruff-Pak DS, Lavond DG, Logan CG, Steinmetz JE, Thompson RF. Cerebellar cortical lesions and reacquisition in classical conditioning of the nictitating membrane response in rabbits. Brain Research. 1993;608:67–77. doi: 10.1016/0006-8993(93)90775-i. [DOI] [PubMed] [Google Scholar]
- Wrenn CC, Wiley RG. Lack of effect of moderate Purkinje cell loss on working memory. Neuroscience. 2001;107:433–455. doi: 10.1016/s0306-4522(01)00326-8. [DOI] [PubMed] [Google Scholar]
- Yeo CH, Hardiman MJ. Cerebellar cortex and eyeblink conditioning: A reexamination. Experimental Brain Research. 1992;88:623–638. doi: 10.1007/BF00228191. [DOI] [PubMed] [Google Scholar]
- Yeo CH, Hardiman MJ, Glickstein M. Classical conditioning of the nictitating membrane response of the rabbit: II. Lesions of the cerebellar cortex. Experimental Brain Research. 1985;60:99–113. doi: 10.1007/BF00237023. [DOI] [PubMed] [Google Scholar]
- Yeo CH, Hardiman MJ, Moore JW, Russell IS. Retention of conditioned inhibition of the nictitating membrane response in decorticate rabbits. Behavioural Brain Research. 1983;10:383–392. doi: 10.1016/0166-4328(83)90042-6. [DOI] [PubMed] [Google Scholar]