Abstract
The human endogenous intestinal microflora is an essential “organ” in providing nourishment, regulating epithelial development, and instructing innate immunity; yet, surprisingly, basic features remain poorly described. We examined 13,355 prokaryotic ribosomal RNA gene sequences from multiple colonic mucosal sites and feces of healthy subjects to improve our understanding of gut microbial diversity. A majority of the bacterial sequences corresponded to uncultivated species and novel microorganisms. We discovered significant intersubject variability and differences between stool and mucosa community composition. Characterization of this immensely diverse ecosystem is the first step in elucidating its role in health and disease.
The endogenous gastrointestinal microbial flora plays a fundamentally important role in health and disease, yet this ecosystem remains incompletely characterized and its diversity poorly defined (1). Critical functions of the commensal flora include protection against epithelial cell injury (2), regulation of host fat storage (3), and stimulation of intestinal angiogenesis (4). Because of the insensitivity of cultivation, investigators have begun to explore this ecosystem using molecular fingerprinting methods (5) and sequence analysis of cloned microbial small-subunit ribosomal RNA genes [16S ribosomal DNA (rDNA)] (6-9). However, such studies have been limited by the relative paucity of sequenced gene fragments, the use of fecal biota as a surrogate for the entire gut microflora, and little attention given to potential differences between specific anatomical sites. In addition, variation associated with time, diet, and health status have not been adequately described, nor have the relative importance and contributions of each source (10).
Surface-adherent and luminal microbial populations may be distinct and may fulfill different roles within the ecosystem. For example, the biofilm-like architecture of the mucosal microbiota, in close contact with the underlying gut epithelium, facilitates beneficial functions including nutrient exchange and induction of host innate immunity (11). Fecal samples are often used to investigate the intestinal microflora because they are easily collected. However, the degree to which composition and function of the fecal microflora differ from mucosal microflora remains unclear. We undertook a large-scale comparative analysis of 16S rDNA sequences to characterize better the adherent mucosal and fecal microbial communities and to examine how these microbial communities differed between subjects and between mucosal sites.
Mucosal tissue and fecal samples were obtained from three healthy adult subjects (A, B, and C) who were part of a larger population-based case-control study (table S1) (12). Mucosal samples were obtained during colonoscopy from healthy-appearing sites within the six major subdivisions of the human colon: cecum, ascending colon, transverse colon, descending colon, sigmoid colon, and rectum. Fecal samples were collected from each subject 1 month following colonoscopy (12). We focused on 16S rDNA given its universal distribution among all prokaryotes, the presence of diverse species-specific domains, and its reliability for inferring phylogenetic relationships (13). The 16S rDNA was amplified from samples with polymerase chain reaction (PCR) and broad-range bacterial and archaeal primers (12). The 7 samples from subject B and the fecal sample from subject C yielded archaeal products; all 21 samples yielded bacterial products. PCR products were cloned and sequenced bidirectionally, and numerical ecology approaches were applied.
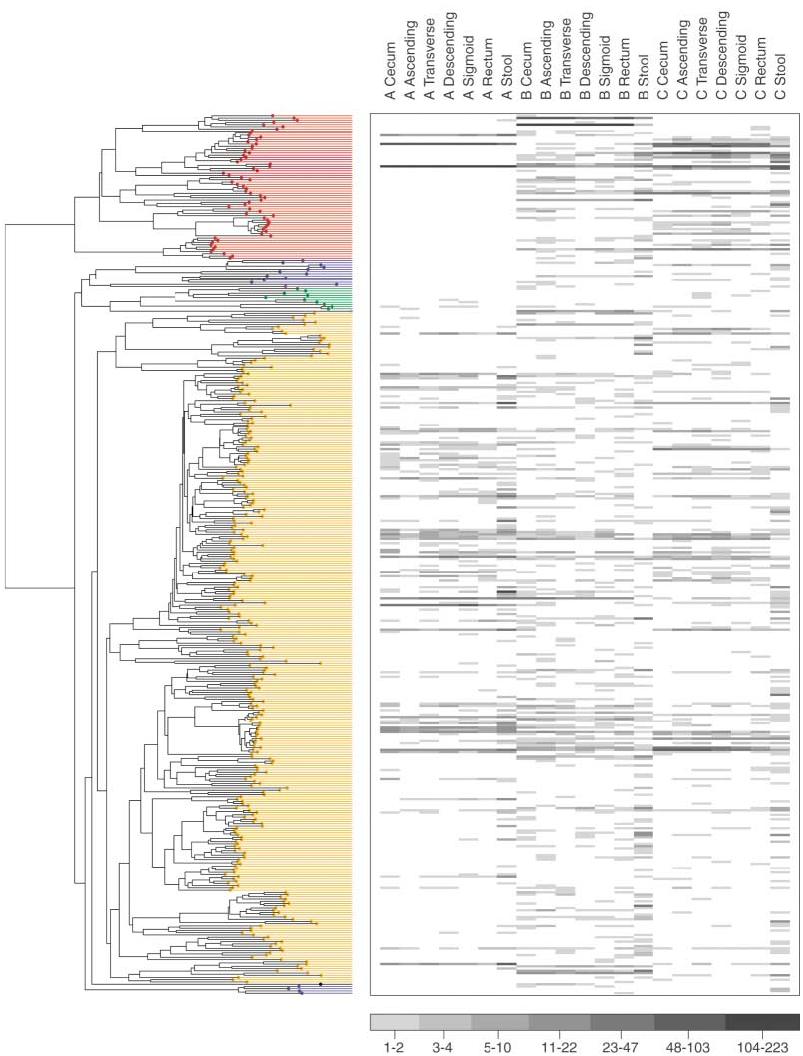
Initially, a phylotype census was performed on each sample (table S2). A total of 11,831 bacterial and 1524 archaeal near-full-length, nonchimeric 16S rDNA sequences were subjected to phylogenetic analysis. Using 99% minimum similarity as the threshold for any pair of sequences in a phylotype (or operational taxonomic unit) as calculated by dissimilarity matrices and the DOTUR program (12), we identified a total of 395 bacterial phylotypes (Fig. 1). In contrast, all 1524 archaeal sequences belonged to a single phylotype (Methanobrevibacter smithii); these archaeal sequences were excluded from further analyses. This remarkable apparent difference in diversity of the two prokaryotic domains in the gut was reminiscent of results from soil and ocean (14).
Fig. 1.

Number of sequences per phylotype for each sample. The y axis is a neighbor-joining phylogenetic tree containing one representative of each of the 395 phylotypes from this study; each row is a different phylotype. The phyla (Bacteroidetes, non-Alphaproteobacteria, unclassified near Cyanobacteria, Actinobacteria, Firmicutes, Fusobacteria, and Alphaproteinobacteria, ordered top to bottom) are color coded as in Fig. 3 and fig. S1. Each column is labeled by subject (A, B, C) and anatomical site. For each phylotype, the clone abundance is indicated by a grayscale value.
Of the 395 bacterial phylotypes, 244 (62%) were novel (table S3), and 80% represented sequences from species that have not been cultivated (12). Most of the inferred organisms were members of the Firmicutes and Bacteroidetes phyla (Fig. 1 and fig. S1), which is concordant with other molecular analyses of the gut flora (6, 7, 9). The Firmicutes phylum consisted of 301 phylotypes, 191 of which were novel; most (95%) of the Firmicutes sequences were members of the Clostridia class. We detected a substantial number of Firmicutes related to known butyrate-producing bacteria (2454 sequences, 42 phylotypes) (15, 16), all of which are members of clostridial clusters IV, XIVa, and XVI. We expected prominent representation of this functional group among our healthy control subjects, given its role in the maintenance and protection of the normal colonic epithelium (16). Large variations among the 65 Bacteroidetes phylotypes were noted between subjects (Fig. 1), as described previously (6, 7). B. thetaiotaomicron was detected in each subject and is known to be involved in beneficial functions, including nutrient absorption and epithelial cell maturation and maintenance (17). Relatively few sequences were associated with the Proteobacteria, Actino-bacteria, Fusobacteria, and Verrucomicrobia phyla (fig. S1). The low abundance of Proteobacteria sequences (including Escherichia coli) was not surprising, given that facultative species may represent ∼0.1% of the bacteria in the strict anaerobic environment of the colon; this is consistent with previous findings (6, 8, 9). Three sequences from two subjects (represented by AY916143) clustered with unclassified sequences previously identified from mammalian gut samples. These sequences appear to represent a novel lineage, deeply branching from the Cyano-bacteria phylum and chloroplast sequences.
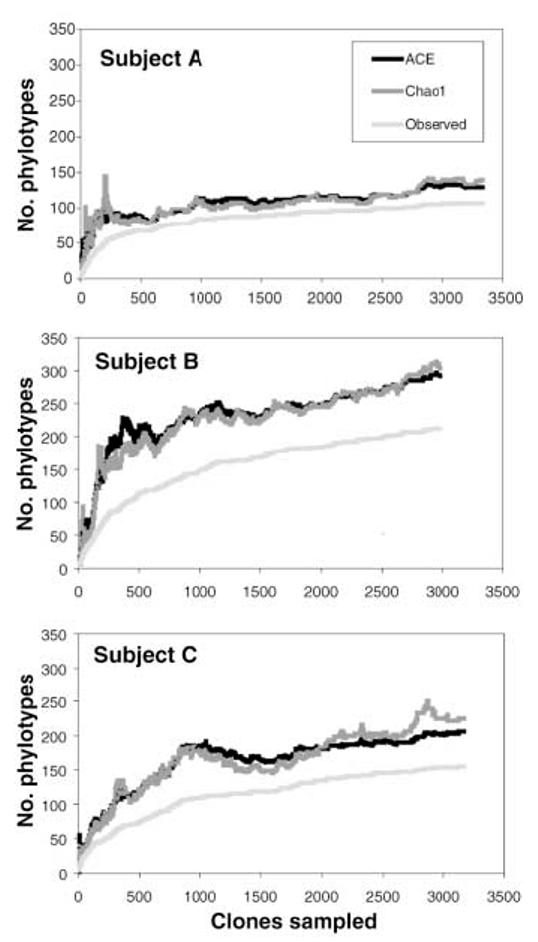
No complex microbial community in nature has been sampled to completion. In addition to its biases and inability to distinguish live from dead organisms, the limited sensitivity of broad-range PCR may hinder detection of rare phylotypes. We used several nonparametric methods to explore the diversity and coverage of our clone libraries. Phylo-type richness estimations suggested that at least 500 phylotypes would be detected with continued sequencing from our samples (≥130, ≥300, and ≥200 phylotypes in subjects A, B, and C) (Fig. 2 and figs. S2 and S3). These estimates must be considered as lower bounds, because both the observed and the estimated richness have increased in parallel with additional sampling effort (Fig. 2 and fig. S3). Coverage was 99.0% over all bacterial clone libraries combined, meaning that one new unique phylotype would be expected for every 100 additional sequenced clones (18).
Fig. 2.

Collector's curves of observed and estimated phylotype richness of pooled mucosal samples per subject. Each curve reflects the series of observed or estimated richness values obtained as clones are added to the data set in an arbitrary order. The curves rise less steeply as an increasing proportion of phylotypes have been encountered, but novel phylotypes continue to be identified to the end of sampling. The relatively constant estimates of the number of unobserved phylotypes in each subject as observed richness increases (the gap between observed and estimated richness) indicate that estimated richness is likely to increase further with additional sampling. The Chao1 estimator and the abundance-based coverage estimator (ACE) are similar, but the ACE is less volatile because it uses more information from the abundance distribution of observed phylotypes. Individual-based rare-faction curves are depicted in figs. S4 to S6.
The microbial community appeared more diverse in subject B than in A or C, based on inspection of the richness and evenness of the clone distribution across the phylogenetic tree (Fig. 1). The Rao diversity coefficient (19), which accounts for both phylotype abundance and dissimilarity, was indeed higher for B than for the other subjects (fig. S7). This pattern was not found with traditional, that is, Shannon and Simpson, diversity indices, which assess only relative phylotype abundance (20). Within each subject, the mucosal samples demonstrated similar diversity profiles, regardless of the index used (fig. S7).
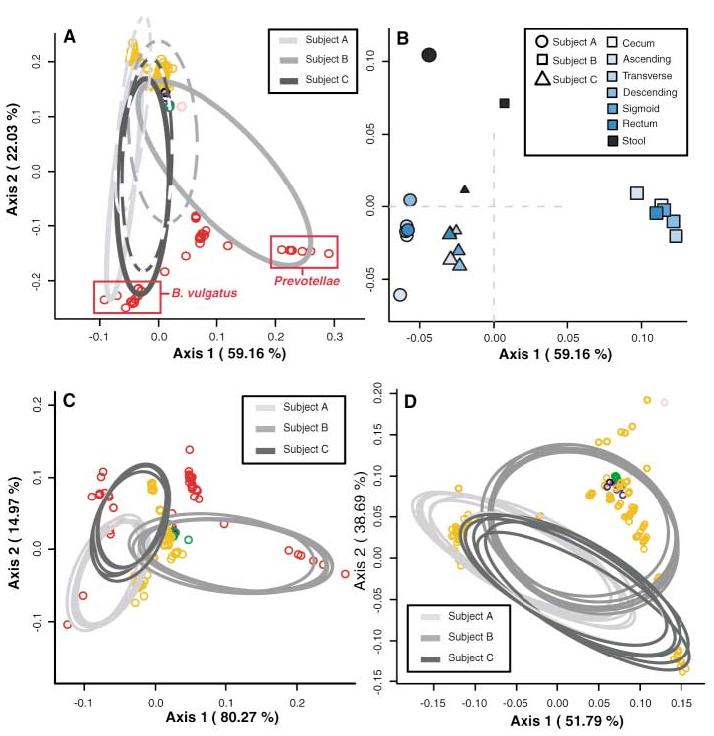
Previous investigations have not rigorously addressed possible differences in the intestinal microflora between subjects, between anatomical sites, or between stool and mucosal communities. We applied techniques that are based on the relative abundance of sequences within communities and the extent of genetic divergence between sequences. We first compared inter- and intrasubject variability using double principal coordinate analysis (DPCoA) (19). The greatest amount of variability was explained by intersubject differences; stool-mucosa differences explained most of the variability remaining in the data (Fig. 3). The relative lack of variation among mucosal sites was further examined. The FST statistic of population genetics (21) was used to compare genetic diversity within each subject; this revealed that the mucosal populations of subjects A and B were significantly distinct compared with the overall mucosal diversity (table S5). However, in both of these subjects, a single mucosal library had a deviant genetic diversity index; exclusion of this library from the analysis led to an insignificant FST statistic in each case (12). Taken as a whole, these results confirmed little genetic variation among subject-specific mucosal libraries.
Fig. 3.

DPCoA for (A) colonic mucosa (solid lines) and stool (dashed lines), (C) colonic mucosal sites alone, and (D) mucosal sites excluding Bacteroidetes phylotypes. Phylotypes are represented as open circles, colored according to phylum as in Fig. 1. Phylotype points are positioned in multidimensional space according to the square root of the distances between them. Ellipses indicate the distribution of phylotypes per sample site, except in (A), where all mucosal sites are represented by one ellipse. Percentages shown along the axes represent the proportion of total Rao dissimilarity captured by that axis. (A) is the best possible two-dimensional representation of the Rao dissimilarities between all samples (12). (B) is an enlarged view of (A), depicting the centroids of each site-specific ellipse. Subject ellipse distributions remain distinct after stool phylotypes (C) and Bacteroidetes phylotypes (D) are excluded from the analysis.
We then asked whether nonrandom distributions of phylogenetic lineages accounted for any variation among all samples. Using a modification of the phylogenetic (P) test (12, 21), we found that stool and pooled mucosal libraries harbored distinct lineages (P < 0.001) (table S5); however, distinct lineages were not found among the individual mucosal libraries. We sought further anatomic precision in explaining library distinctions using the ∫-LIBSHUFF program (22). We found that mucosal clone libraries were similar to the other mucosal libraries from the same subject, with two exceptions (fig. S6). The library from the ascending colon of subject A was a subset of every other mucosal population from that subject (P values < 0.0017), and the descending colon library from subject B was a subset of the ascending colon library in that subject (P = 0.0005). Such inconsistencies among mucosal subpopulations suggested a pattern of patchiness in the distribution of mucosal bacteria rather than a homogenous gradient along the longitudinal axis of the colon. ∫-LIBSHUFF also revealed that nearly all mucosal libraries from subjects B and C were significantly distinct from the corresponding stool library, whereas each mucosal library from subject A was a subset of the stool library. We postulate that the fecal microbiota represents a combination of shed mucosal bacteria and a separate nonadherent luminal population; however, these data must be interpreted with caution, given the delay between stool and mucosa sampling.
Bacterial diversity within the human colon and feces is greater than previously described, and most of it is novel. Differences between individuals were significantly greater than intrasubject differences, with the exception of variation between stool and adherent mucosal communities. Complicating this picture is our evidence for patchiness and heterogeneity. This patchiness did not display an obvious pattern along the course of the colon but may reflect microanatomic niches. Given that each mucosal sample contained a similar distribution of organisms within higher order taxa (Fig. 1), the variation we observed at the genus or species level may be the result of colonization resistance by the more abundant members within similar functional groups (23). Whether the gut micro-biota undergoes such nonrandom assembly remains unclear.
Ecological statistical approaches reveal previously unrecognized irregularities in the architecture of complex microbial communities. High-resolution spatial, temporal, and functional analyses of the adherent human intestinal microbiota are still needed. In addition, the effects of host genetics and of perturbations such as immunosuppression, antimicrobials, and change in diet have yet to be carefully defined. We anticipate that micro-arrays, single-cell analysis, and metagenomics [e.g., a “Second Human Genome Project” (24)] will complement the approach we have illustrated and hasten our understanding of human-associated microbial ecosystems.
Supplementary Material
Footnotes
Supporting Online Material www.sciencemag.org/cgi/content/full/1110591/DC1 Materials and Methods SOM Text Figs. S1 to S8 Tables S1 to S6 References
References and Notes
- 1.Hooper LV, Gordon JI. Science. 2001;292:1115. doi: 10.1126/science.1058709. [DOI] [PubMed] [Google Scholar]
- 2.Rakoff-Nahoum S, Paglino J, Eslami-Varzaneh F, Edberg S, Medzhitov R. Cell. 2004;118:229. doi: 10.1016/j.cell.2004.07.002. [DOI] [PubMed] [Google Scholar]
- 3.Backhed F, et al. Proc. Natl. Acad. Sci. U.S.A. 2004;101:15718. doi: 10.1073/pnas.0407076101. [DOI] [PMC free article] [PubMed] [Google Scholar]
- 4.Stappenbeck TS, Hooper LV, Gordon JI. Proc. Natl. Acad. Sci. U.S.A. 2002;99:15451. doi: 10.1073/pnas.202604299. [DOI] [PMC free article] [PubMed] [Google Scholar]
- 5.Zoetendal EG, et al. Appl. Environ. Microbiol. 2002;68:3401. doi: 10.1128/AEM.68.7.3401-3407.2002. [DOI] [PMC free article] [PubMed] [Google Scholar]
- 6.Hayashi H, Sakamoto M, Benno Y. Microbiol. Immunol. 2002;46:535. doi: 10.1111/j.1348-0421.2002.tb02731.x. [DOI] [PubMed] [Google Scholar]
- 7.Hold GL, Pryde SE, Russell VJ, Furrie E, Flint HJ. FEMS Microbiol. Ecol. 2002;39:33. doi: 10.1111/j.1574-6941.2002.tb00904.x. [DOI] [PubMed] [Google Scholar]
- 8.Suau A, et al. Appl. Environ. Microbiol. 1999;65:4799. doi: 10.1128/aem.65.11.4799-4807.1999. [DOI] [PMC free article] [PubMed] [Google Scholar]
- 9.Wang X, Heazlewood SP, Krause DO, Florin TH. J. Appl. Microbiol. 2003;95:508. doi: 10.1046/j.1365-2672.2003.02005.x. [DOI] [PubMed] [Google Scholar]
- 10.Horner-Devine MC, Carney KM, Bohannan BJM. Proc. R. Soc. London. 2003;271:113. doi: 10.1098/rspb.2003.2549. [DOI] [PMC free article] [PubMed] [Google Scholar]
- 11.Sonnenburg JL, Angenent LT, Gordon JI. Nat. Immunol. 2004;5:569. doi: 10.1038/ni1079. [DOI] [PubMed] [Google Scholar]
- 12.Materials and methods are available as supporting material on Science Online.
- 13.Pace NR. Science. 1997;276:734. doi: 10.1126/science.276.5313.734. [DOI] [PubMed] [Google Scholar]
- 14.Curtis TP, Sloan WT. Curr. Opin. Microbiol. 2004;7:221. doi: 10.1016/j.mib.2004.04.010. [DOI] [PubMed] [Google Scholar]
- 15.Barcenilla A, et al. Appl. Environ. Microbiol. 2000;66:1654. doi: 10.1128/aem.66.4.1654-1661.2000. [DOI] [PMC free article] [PubMed] [Google Scholar]
- 16.Pryde SE, Duncan SH, Hold GL, Stewart CS, Flint HJ. FEMS Microbiol. Lett. 2002;217:133. doi: 10.1111/j.1574-6968.2002.tb11467.x. [DOI] [PubMed] [Google Scholar]
- 17.Hooper LV, et al. Science. 2001;291:881. doi: 10.1126/science.291.5505.881. [DOI] [PubMed] [Google Scholar]
- 18.Good's coverage estimates were 99.3%, 97.9%, and 98.3% for subjects A, B, and C, respectively.
- 19.Pavoine S, Dufour AB, Chessel D. J. Theor. Biol. 2004;228:523. doi: 10.1016/j.jtbi.2004.02.014. [DOI] [PubMed] [Google Scholar]
- 20.Colwell RK. http:// viceroy.eeb.uconn.edu/estimates EstimateS, version 7. 2004
- 21.Martin AP. Appl. Environ. Microbiol. 2002;68:3673. doi: 10.1128/AEM.68.8.3673-3682.2002. [DOI] [PMC free article] [PubMed] [Google Scholar]
- 22.Schloss PD, Larget BR, Handelsman J. Appl. Environ. Microbiol. 2004;70:5485. doi: 10.1128/AEM.70.9.5485-5492.2004. [DOI] [PMC free article] [PubMed] [Google Scholar]
- 23.Fargione J, Brown CS, Tilman D. Proc. Natl. Acad. Sci. U.S.A. 2003;100:8916. doi: 10.1073/pnas.1033107100. [DOI] [PMC free article] [PubMed] [Google Scholar]
- 24.Relman DA, Falkow S. Trends Microbiol. 2001;9:206. doi: 10.1016/s0966-842x(01)02041-8. [DOI] [PubMed] [Google Scholar]
- 25.We thank B. Bohannan, M. B. Omary, and S. Holmes (Stanford University) for helpful comments on the manuscript. This research was supported by grants from the NIH (no. AI51259) and Ellison Medical Foundation (D.A.R.), Canadian Institutes of Health Research and Crohn's and Colitis Foundation of Canada (C.N.B., M.S.), National Science Foundation (E.P.), and Defense Advanced Research Projects Agency (S.R.G., K.E.N.). Representatives of novel phylo-types (AY916135 to AY916390) and all other sequences (AY974810 to AY986384) were deposited in GenBank
Associated Data
This section collects any data citations, data availability statements, or supplementary materials included in this article.


