Abstract
We studied the effect of filovirus infection on host cell gene expression by characterizing the regulation of gene expression responses in human liver cells infected with Zaire Ebolavirus (ZEBOV), Reston Ebolavirus (REBOV), and Marburgvirus (MARV), using transcriptional profiling and bioinformatics. Expression microarray analysis demonstrated that filovirus infection resulted in the up-regulation of immune-related genes and the down-regulation of many coagulation and acute-phase proteins. These studies further revealed that a common feature of filovirus virulence is suppression of key cellular antiviral responses, including TLR-, interferon (IFN) regulatory factor 3-, and PKR-related pathways. We further showed that ZEBOV and MARV were more potent antagonists of the IFN response and inhibited the expression of most of the IFN-stimulated genes (ISGs) observed in mock-infected IFN-α-2b treated cells, compared to REBOV infection, which activated more than 20% of these ISGs. Finally, we examined IFN-related gene expression in filovirus-infected cells treated with IFN-α-2b. These experiments revealed that a majority of genes induced in mock-infected cells treated with type I IFN were antagonized in treated ZEBOV- and MARV-infected cells, while in contrast, REBOV infection resulted in a significant increase in ISG expression. Analysis of STAT1 and -2 phosphorylation following IFN treatment showed a significant reduction of STAT phosphorylation for MARV but not for ZEBOV and REBOV, indicating that different mechanisms might be involved in antagonizing IFN signaling pathways by the different filovirus species. Taken together, these studies showed a correlation between antagonism of type I IFN responses and filovirus virulence.
Ebolavirus (EBOV) and Marburgvirus (MARV) are members of the Filoviridae family of nonsegmented negative-strand RNA viruses and represent some of the most deadly human pathogens (38). The pathology of fatal filovirus infections can include high viremia, widespread focal tissue destruction, increased endothelial cell permeability, lymphopenia, and severe coagulation abnormalities and shock. Disease outbreaks associated with the Zaire EBOV (ZEBOV) subtype have resulted in mortality rates of up to 90%; while MARV and Sudan EBOV result in mortality rates of 25 to 90% (38). MARV and several subtypes of EBOV, including ZEBOV and Sudan EBOV, cause severe disease and viral hemorrhagic fever in both humans and nonhuman primates. In contrast, Reston EBOV (REBOV), which is lethal in nonhuman primate models (although the time course of the disease is delayed and the number of survivors is higher than that for an infection with ZEBOV), appears to be attenuated in humans (15, 16, 30, 32). This attenuated phenotype is reflected in cell culture modes, where REBOV shows a clear growth impairment compared to ZEBOV (7).
In both primate and human models, most of the major organs, including the liver, lymph nodes, and spleen, show high titers of virus, and immunohistochemical analysis has shown that endothelial and mononuclear cells become heavily infected and play central roles in disease progression (13, 14, 21, 37, 41). Early and sustained infection in monocytes also plays a central role in the occurrence of viral hemorrhagic fever through the expression of proinflammatory and antiviral cytokines, including alpha interferon (IFN-α), interleukin-1 (IL-1), IL-6, IL-8, IL-12, and TNF family members (e.g., TNF-α and TRAIL), and coagulation factors (e.g., tissue factor [TF]), leading to activation of the extrinsic coagulation pathway and ultimately to endothelial cell destruction and permeability (1, 10, 20, 26, 29, 39, 41, 43). Defective adaptive immune responses, including impaired humoral responses and apoptosis of B and T cells, have been observed in fatal cases of EBOV infection (2, 3, 18). Interestingly, it has been reported that type I IFN (IFN-α-2b) treatment has little effect on disease progression or pathology in EBOV-infected cynomolgus macaques (31). Thus, it has been concluded that the progression and ultimate outcome of human clinical filovirus infections are dependent on early antiviral events in EBOV infection that are predicated on the establishment of well-regulated antiviral and immune responses (1, 2, 34, 35, 41).
In response to infection, one of the principal components of the innate immune and antiviral responses is the activation of the IFN response. Binding of type I IFNs to the IFN receptor (IFNAR) activates the tyrosine kinases Jak1 and Tyk2, leading to a phosphorylation-dependent activation of the transcription factors STAT1 and STAT2 and the subsequent stimulation and repression of IFN-responsive gene transcription (6). As a central activator of both the innate immune and antiviral systems, the IFN response pathway must be inhibited for a successful viral infection. EBOV infection has been reported to be insensitive to IFN treatment both in vivo and in vitro (28, 31). Interestingly, infection of SCID mice with adapted EBOVs causes fatal disease, but the progression of the disease is slowed (9, 25, 42). This is in contrast to the case for IFNAR or STAT1 knockout mice, which show increased sensitivity to ZEBOV infection (8). In primate models, IFN treatment at best delays death by 1 or 2 days (31). Thus, a fundamental feature of filovirus virulence is the ability of these viruses to modulate host cell gene expression and evade the immune response, particularly the antiviral effects of IFNs.
In the present studies, we used transcriptional profiling to study the changes in host cell gene expression induced by infection of human liver hepatocytes with ZEBOV, REBOV, or MARV. Bioinformatic analysis showed similarities in the regulated expression of many antiviral, TNF-related, proinflammatory mediators; coagulation factors; and acute-phase-related genes. Importantly, significant differences were identified between ZEBOV and REBOV, including significantly higher levels of expression of antiviral and immune response-related genes. Finally, we examined the effect of virus infection on induction of type I IFN receptor responses by treating infected cells with IFN-α-2b for 24 h and demonstrated that ZEBOV infection was the most potent antagonist of IFN receptor responses, while REBOV showed the most significant increase in IFN-stimulated gene (ISG) expression. Analysis of the phosphorylation state of STAT1 and -2 in filovirus-infected and IFN-treated cells revealed that only in MARV-infected cells was STAT phosphorylation significantly reduced. In contrast, STAT phosphorylation was not impaired in ZEBOV- and REBOV-infected cells, indicating that the different filovirus species might interfere with the IFN signaling pathway by using different mechanisms. Our studies demonstrated the ability of ZEBOV and MARV to control host cell gene expression to antagonize activation of the innate cellular antiviral response and showed that REBOV has a markedly reduced ability to evade the cellular antiviral response and inhibit the activation of IFN-related gene expression.
MATERIALS AND METHODS
Viruses and cultured cells.
Vero and human hepatoblastoma (Huh7) cells were maintained in Dulbecco's modified Eagle's medium supplemented with 10% fetal calf serum. Sendai virus (SeV) strain Cantell (kindly provided by C. Basler, Mount Sinai School of Medicine, New York) was grown in 11-day-old embryonated chicken eggs at 37°C for 48 h. ZEBOV strain Mayinga, MARV strain Musoke, and the REBOV isolate Pennsylvania 1989 were propagated in Vero E6 cells. For preparation of virus stocks, supernatants were harvested at 4 days (ZEBOV), at 8 days (MARV), or at 14 days (REBOV) postinfection (p.i.). To determine the titer of the virus stocks, 50% tissue culture infective dose (TCID50) assays were performed (7). All work with infectious filoviruses was performed under biosafety level 4 conditions at the Institute for Virology (Marburg, Germany).
Immunofluorescence analysis.
Huh7 cells grown on glass coverslips were infected in parallel to the cells which were used for RNA purification with ZEBOV, REBOV, or MARV at a multiplicity of infection (MOI) of 0.1. At 24 and 48 h p.i., cells were washed twice with phosphate-buffered saline (PBS) and inactivated by treatment with 4% paraformaldehyde for at least 12 h. Cells were then permeabilized with a mixture of acetone and methanol (1:1, vol/vol) for 5 min at −20°C and treated with 0.1 M glycine. Incubation with the respective antibodies was performed as described elsewhere (7). To detect ZEBOV infection, a monoclonal antibody directed against the ZEBOV nucleoprotein was used (1:20 dilution). For staining of REBOV-infected cells, a monoclonal antibody directed against the REBOV nucleoprotein was used (1:100 dilution; kindly provided by A. Sanchez, Centers for Disease Control and Prevention, Atlanta, GA). To detect MARV infection, a monoclonal antibody directed against MARV nucleoprotein was used (1:100 dilution). Bound antibodies were detected with a Texas red-conjugated goat anti-mouse immunoglobulin G antibody (1:200 dilution; Dianova). To visualize the nuclei, cells were stained additionally with 0.1 μg of 4′,6′-diamidino-2-phenylindole hydrochloride (DAPI).
Total RNA isolation and mRNA amplification.
Cells (2 × 10⁷) were infected with ZEBOV, REBOV, or MARV at an MOI of 0.1 and incubated for 24 and 48 h in Dulbecco's modified Eagle's medium supplemented with 2% fetal calf serum. Where indicated, cells were treated at 24 h p.i. for an additional 24 h with 100 IU of IFN-α-2b (Intron-A; Roche Pharmaceuticals) per ml. Cells were washed three times in PBS and scraped into the washing solution. After a short centrifugation step, cell pellets were resuspended in the denaturing cell lysis buffer RLT of the RNAeasy kit (QIAGEN). RNA purification was performed according to the supplier's instructions. The virus-free RNA samples were then resuspended in solution D (4 M guanidinium thiocyanate, 25 mM sodium citrate, 0.5% sarcosyl, 0.1 M β-mercaptoethanol), acidified phenol-chloroform (49:1) extracted, and ethanol precipitated (12). The resulting pellets were resuspended in 150 μl of RNase-free water. A Beckman Coulter DU 640B spectrophotometer was used to quantify total RNA. Total RNA (100 μg) was purified using an RNeasy column as per the manufacturer's specifications. A Hewlett-Packard Kayak XM600 Bioanalyzer was used to check the purity of the RNA prior to amplification. One round of RNA amplification was performed for each infection sample using a RiboAmp kit (Arcturus KIT0201) to generate amplified RNA (aRNA), according to the manufacturer's specifications. Capillary gel electrophoresis (Hewlett-Packard Kayak XM600 Bioanalyzer) was used to check the purity of the aRNA prior to probe labeling.
Probe labeling and microarray slide hybridization.
Fluorescent cDNA probes were prepared from equal-mass pools of total RNA samples isolated from two independent biological replicates. Briefly, approximately 3 μg of aRNA was used to generate Cy3/Cy5-labeled cDNA probes. For each probe, Cy3/Cy5 dye incorporation was measured using a Shimadzu UV-1601 spectrophotometer, and corresponding probe samples were normalized based on cDNA concentrations, as previously described (22-24). The samples were then passed through a G50 column to remove unincorporated dye and other impurities. Probe samples were dried for 90 min at 50°C using a Savant SPD111V Speed-Vac. Human cDNA arrays were obtained from Agilent Technologies (see below). The arrays were pretreated by being dipped in water and dried quickly with pressurized air. Probe samples were resuspended in 25 μl of warmed hybridization buffer [50% formamide, 5× SSC (1× SSC is 0.15 M NaCl plus 0.015 M sodium citrate), 5× Denhardt's solution, 0.1% sodium dodecyl sulfate (SDS), 100 μg of CotI DNA per ml, and 20 μg of poly(A)72 per ml]. The probe was boiled for 3 min and placed on ice. Appropriate probe samples were combined, and 50 μl was used to hybridize each slide. Slides were incubated in a dark, humid chamber for 16 h at 42°C. Slides were washed once in prewarmed 1× SSC plus 0.2% SDS (10 min with rocking), twice in prewarmed 0.1× SSC plus 0.2% SDS (10 min each with rocking), and twice in 0.1× SSC at room temperature (1 min each with rocking) and then dipped twice in distilled water. For the IFN treatment experiments, expression analysis was performed using Agilent human oligonucleotide arrays (see below). For these arrays, fluorescently labeled cRNA probes were prepared from equal-mass pools of total RNA from two independent biological replicates using the Low RNA Input Fluorescent Linear Amplification Kit (catalog no. 5184-3523; Agilent Technologies) as per the manufacturer's instructions. Slides were dried using pressurized air and submitted to the University of Washington Center for Expression Arrays to be scanned using a Molecular Dynamics scanner. For the cDNA arrays, raw data were combined and processed using the in-house program Spot-on Image, while for oligonucleotide arrays, raw data were combined and processed using Agilent Feature Extractor. All data were then loaded into a custom relational database (Expression Array Manager).
Expression microarray and statistical analysis.
The human cDNA arrays (Human 1; Agilent Technologies) contained duplicate spots of 12,814 unique cDNA clones, while the human oligonucleotide arrays (Human 1A [V2]; Agilent Technologies) contained 22,000 genes. Briefly, a single experiment comparing two samples was performed using the reverse dye label technique and hybridized to the microarrays to generate four independent measurements of fluorescence intensity. This allows for the calculation of mean ratios between expression levels of each gene in the analyzed sample pair, standard deviations, and P values for each experiment. All data were entered into a custom-designed Oracle 9i-backed relational database, Expression Array Manager, and were then uploaded into Rosetta Resolver System 5.0 (Rosetta Biosoftware, Seattle, WA) and Spotfire Decision Site 8.1 (Spotfire, Somerville, MA). Primary analysis of expression microarray data was performed using Resolver, with supplemental analysis and figure preparation using SpotFire. Data normalization and the Resolver System error model specifically developed for our slide format are described on the website http://expression.microslu.washington.edu. This website is also used to publish all primary data in accordance with the proposed MIAME standards (11).
Real-time PCR assays.
Quantitative real-time PCR was used to validate the gene expression changes. Primer and probe sets for each of the target sequences were chosen from the Applied Biosystems Assays-on-Demand product list. Total RNA samples were treated with DNase, using DNA-free DNase treatment and removal reagents (Ambion, Inc, Austin, TX). Reverse transcription was performed using TaqMan reverse transcription reagents (Applied Biosystems, Foster City, CA). Quantitative real-time PCR was performed on the ABI 7500 real-time PCR system, using TaqMan chemistry (Applied Biosystems, Foster City, CA). Each target was run in quadruplicate using 20-μl reaction volumes of TaqMan 2× PCR Universal Master Mix (Applied Biosystems). GAPDH (glyceraldehyde-3-phosphate dehydrogenase) and 18S rRNA were chosen as endogenous controls to normalize quantification of the target. Quantification of each gene, relative to the calibrator, was calculated by the instrument, using the equation: 2 − ΔΔCT within the Applied Biosystems sequence detection software version 1.2.2. Probes used for analysis (Applied Biosystems) were as follows: eukaryotic 18S rRNA (Hs99999901_s1), F3 (Hs00175225_m1), IFNB1 (Hs00277188_s1), IL-6 (Hs00174131_m1), IL-8 (Hs00174103_m1), PAK1 (Hs00176815_m1), and TFP1 (Hs00196731_m1).
Western blot analysis.
Huh7 cells grown either in six-well plates or on glass coverslips to approximately 50% confluence were infected with ZEBOV, MARV, REBOV, or SeV at an MOI of 0.1. At 24 h p.i., cells were treated with 100 IU IFN-α-2b for 24 h (for analysis of MX1 expression) or 30 min (for analysis of STAT1 and STAT2 phosphorylation). Cells were washed twice with PBS and scraped into 250 μl PBS. After addition of 250 μl 2× protein loading buffer (114 mM Tris-HCl, pH 6.8; 2.5% SDS; 125 mM dithiothreitol; 25% glycerol; 0.25% bromphenol blue), cell lysates were transferred to fresh tubes, boiled for 10 min, and subjected to SDS-polyacrylamide gel electrophoresis (12% gels). For analysis of MX1 expression, cells were washed twice with PBS and scraped into 50 μl cell lysis buffer (10 mM Tris-HCl, pH 7.4; 100 mM NaCl; 1 mM EGTA; 1 mM EDTA; 2 mM Na3VO4; 0.1% SDS; 1% Triton X-100; 10% glycerol; 0.5% sodium deoxycholate) containing Complete protease inhibitor (Roche). After a short centrifugation step, supernatants were transferred to fresh tubes, supplemented with 50 μl of 2× protein loading buffer, boiled for 10 min, and subjected to SDS-polyacrylamide gel electrophoresis. Proteins were blotted onto polyvinylidene difluoride membranes, and the membranes were blocked with 10% milk powder in PBS for 1 h at 4°C and incubated for 1 h with the mouse monoclonal antibody M143 (kindly provided by O. Haller and G. Kochs, University of Freiburg, Freiburg, Germany) diluted in PBS containing 0.1% Tween 20 (antibody dilution, 1:1,000). For detection of STAT1 and STAT2 proteins, membranes were incubated in 5% milk powder in Tris-buffered saline (20 mM Tris-HCl, pH 7.4; 150 mM NaCl) containing 0.1% Tween 20 for 1 h at 4°C, followed by an incubation with the appropriate primary antibody in Tris-buffered saline supplemented with 5% bovine serum albumin and 0.1% Tween 20 overnight at 4°C. The following antibodies were used: rabbit anti-STAT1-phospho (NEB; dilution, 1:1,000), rabbit anti-STAT1-total (NEB; dilution, 1:1,000), rabbit anti-STAT2-phospho (Biomol; 1:2,000), and rabbit anti-STAT2-total (Biomol; 1:2,000). A mouse antiactin antibody was obtained from Acris (dilution, 1:200,000). The secondary antibodies used were coupled with horseradish peroxidase (Dianova) and visualized by using either the chemiluminescence substrate SuperSignal West Dura Extended Duration or SuperSignal West Femto Maximum Sensitivity (Pierce) according to the manufacturer's instructions. To verify virus infection, infected and IFN-treated cells grown on glass coverslips were subjected to immunofluorescence analysis using virus-specific antibodies as described above.
RESULTS
EBOV and MARV infection kinetics and control of host cell gene expression.
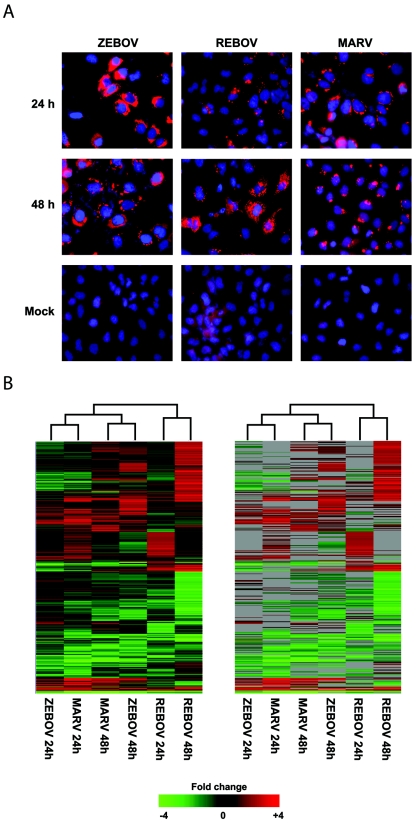
To study the differences in effects on host cell gene expression induced by filovirus infections, human liver (Huh7) cells were infected at an MOI of 0.1 with ZEBOV, REBOV, or MARV and total RNA was isolated 24 and 48 h later. As shown in Fig. 1A, immunofluorescence assays using monoclonal antibodies directed against the respective nucleoprotein of each virus showed that approximately 75% of the cells were infected with ZEBOV and MARV, while fewer than 50% were infected with REBOV, at 24 h. By 48 h, all three viruses showed >85% infection. In contrast to cells infected with REBOV and MARV, ZEBOV-infected cells showed a clear cytopathic effect at 48 h p.i. mRNA was amplified from total RNA as previously described and was rigorously tested for quality and integrity at every step by capillary electrophoresis. Expression cDNA microarray analysis was performed by hybridization of fluorescently labeled cDNAs to cDNA arrays containing approximately 12,000 individual gene sequences (see Materials and Methods). As shown in Fig. 1B, when we examined the population of genes that showed at least a twofold change in expression (P ≤ 0.01) across any infection, we observed that a total of 1,855 genes were differentially regulated according to these criteria. The grouping of the experiments by the clustering algorithm suggested that the effects of host cell gene expression induced by ZEBOV and MARV infection were more similar to each other based on time p.i. than to REBOV infection independent of time of infection. These results suggested that ZEBOV and MARV infection were eliciting similar host responses that were distinct from those elicited by REBOV. To more thoroughly understand the similarities and differences in the cellular response to filovirus infection, we performed mathematical set analysis on the genes that showed ≥2-fold (P < 0.01; n = 4) change in expression at 24 and 48 h following ZEBOV, REBOV, and MARV infection, as described below.
FIG. 1.
Global analysis of EBOV and MARV infection kinetics. Panel A, immunofluorescence analysis of Huh7 cells infected with ZEBOV, REBOV, or MARV at an MOI of 0.1 at 24 h and 48 h p.i. Panel B, two-dimensional agglomerative cluster matrix of genes that showed a ≥2-fold (n = 4; P < 0.01) change in expression in a least one experiment. In the left panel, genes shown in red were up-regulated and genes shown in green were down-regulated relative to uninfected Huh7 cells, while black indicates no change in gene expression. In the right panel, genes whose regulation showed a P value of >0.01 are shown in gray.
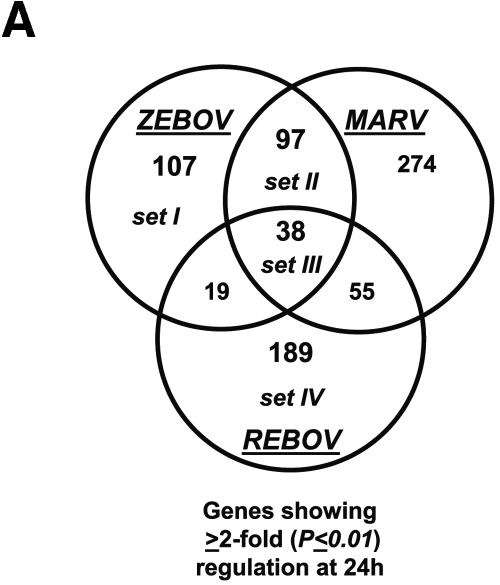
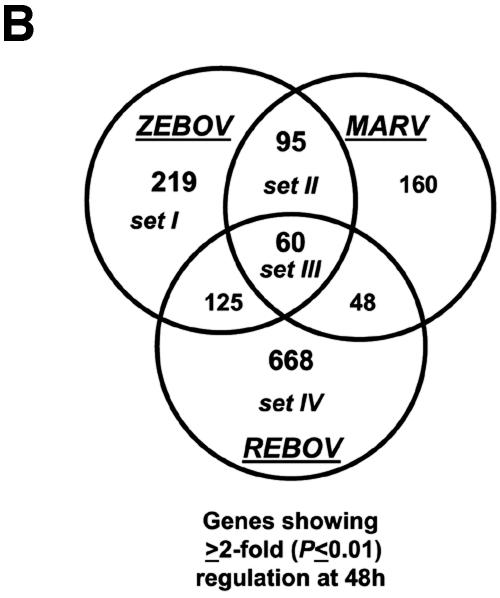
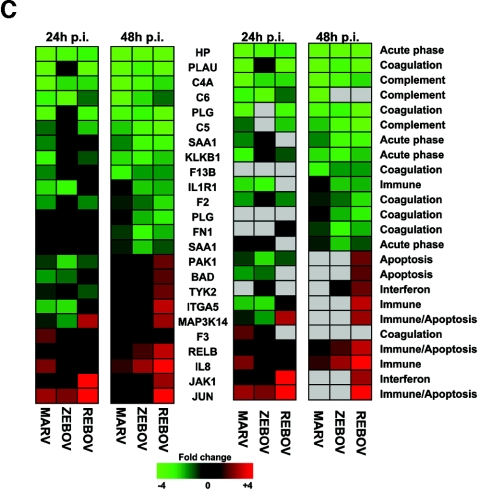
Our bioinformatic analysis demonstrated that at 24 h p.i., 107 genes were preferentially regulated by ZEBOV (set I), 97 genes were common between ZEBOV and MARV (set II), 189 genes were regulated by REBOV (set IV), and 38 genes were common to all infections (set III), as shown in Fig. 2A. These data revealed that by 24 h p.i., the greatest similarity in host cell gene expression was between ZEBOV and MARV. This result is intriguing because ZEBOV and REBOV are more closely related at the genome level than they are to MARV, but only ZEBOV and MARV show high mortality rates in humans. As shown in Fig. 2B, by 48 h p.i. we identified 219 genes that were specifically regulated by ZEBOV (set I), 95 genes that were common in ZEBOV and MARV (set II), 668 genes that were regulated by REBOV (set IV), and 60 genes that were common in all infection groups (set III). As shown in Fig. 2C, an examination of several inflammation-related genes at 24 and 48 h p.i. showed that infection of Huh7 cells with all three filoviruses resulted in the significant down-regulation of many acute-phase (e.g., HP, SAA1, and KLKB1), complement (e.g., C4A, C5, and C6), and coagulation-related (e.g., PLAU, PLG, F13B, F2, PLG, and FN1) genes and the up-regulated expression of the IL-8 gene. Additionally, infection of cells with REBOV resulted in the specific up-regulation of many immune/apoptosis genes (PAK1, BAD, ITGA5, IL1R1, MAP3K12, JUN, and RELB) and IFN-related genes (including JAK1 and Tyk2). These results show that filovirus infection of human liver cells results in modulation of many inflammatory response-related pathways and suggest that the apparent attenuation of REBOV in humans may result from the activation of innate antiviral responses.
FIG.2.
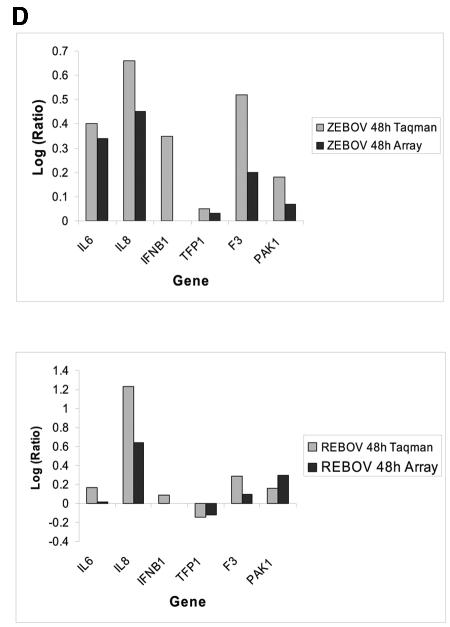
Control of host cell gene expression following EBOV and MARV infection. Panel A, Venn diagram showing the segregation of infection-regulated genes that showed a ≥2-fold (n = 4; P < 0.01) change in expression at 24 h p.i. Hierarchical clustering matrix of the expression of genes in set I that were preferentially regulated by ZEBOV at 24 h, in set II that were commonly regulated by ZEBOV and MARV, in set III that were common to all viral infections, and in set IV that were restricted to REBOV. Panel B, Venn diagram showing the segregation of infection-regulated genes that showed a ≥2-fold (n = 4; P < 0.01) change in expression at 48 h p.i. and the associated hierarchical clustering diagrams of genes in sets I to IV. Panel C, matrix showing the expression of selected inflammation- and apoptosis-related genes in ZEBOV-, REBOV-, and MARV-infected cells at 24 and 48 h p.i. In the left panel, genes shown in red were up-regulated and genes shown in green were down-regulated relative to uninfected Huh7 cells, while black indicates no change in gene expression. In the right panel, genes whose regulation showed a P value of >0.01 are shown in gray. Panel D, bar graphs comparing the expression of selected mRNAs as measured by quantitative real-time PCR and cDNA expression microarray analysis. The results are presented as the log ratio of mRNA abundance in infected relative to mock-infected cells.
To ensure the accuracy of our cDNA microarray results, we performed real-time PCR on several immune- and apoptosis-related genes, including IL-6, IL-8, TFP1, F3, and PAK1 (Fig. 2D). These genes were chosen because of their roles in immune responses and coagulation and also because they displayed a broad range of differential regulation (i.e., different fold changes) on the cDNA arrays. For all of these genes, our real-time PCR analysis mirrored what was observed in our bioinformatic analysis, although the real-time PCR assay appeared to be more sensitive and showed increased magnitudes of gene expression changes that were always in the same direction as those observed on the arrays. Additionally, we measured the expression levels of IFN-β1 (not present on the arrays) in these samples and determined that IFN-β1 expression was induced in both ZEBOV and REBOV infections.
Taken together, these studies showed the ability of all the filoviruses to modulate immune response, coagulation, and acute-phase protein gene expression in infected Huh7 cells. Moreover, these data demonstrated that infection of Huh7 cells with REBOV resulted in a more significant increase in the expression of genes involved in immune and regulated cell death processes than was observed in the ZEBOV and MARV infections. Additionally, quantitative real-time PCR showed that ZEBOV infection resulted in the increased expression of IFN-β1 mRNA compared to that for REBOV infection. This result was surprising, because ZEBOV replicated much more quickly than REBOV and led to higher levels of infection (shown in Fig. 1A). This result suggests that filoviruses, and ZEBOV in particular, must be able to abrogate the cellular response to type I IFNs. Another interesting result of these studies was that we observed a larger increase in the number of genes that were differentially regulated by REBOV from 24 to 48 h than was observed for either ZEBOV or MARV. This result was also intriguing in light of the slower infection kinetics observed with REBOV. Our interpretation of these data is that the lower rate of REBOV replication likely leads to a decrease in the efficiency of REBOV to control gene expression and thereby provides the host cell a greater opportunity to mount a significant immune response. This increased activation of the antiviral state is likely an important component of the attenuation of REBOV compared with ZEBOV and MARV. To examine this possibility, we next experimentally determined the gene expression program of an activated antiviral response in Huh7 cells by performing cDNA microarray analysis on mock-infected cells treated with a clinically used type I IFN and compared these results to those for ZEBOV, REBOV, and MARV infections.
REBOV infection results in increased activation of the antiviral state and expression of IFN-regulated genes.
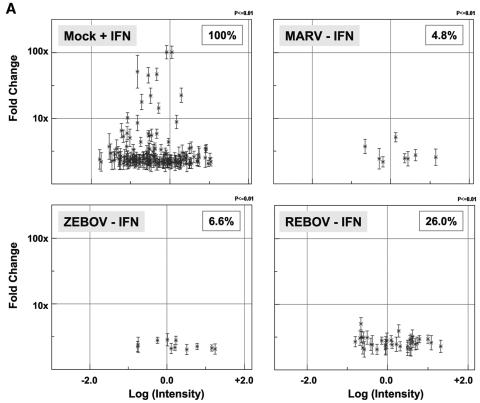
In order to better characterize the ability of these filoviruses to antagonize the activation of the antiviral response, we first used expression cDNA microarrays to determine the transcriptional profile of an activated antiviral response in mock-infected Huh7 cells treated with IFN-α-2b (100 IU/ml) for 24 h. Presented in Fig. 3A are scatter plots showing the expression of individual genes that were up-regulated ≥2-fold (P ≤ 0.01; n = 4) in mock-infected cells treated with IFN and the expression of this same population of IFN-regulated genes 48 h after ZEBOV, REBOV, or MARV infection. This analysis showed that 165 genes were up-regulated ≥2-fold (P ≤ 0.01) in IFN-treated cells, whereas only 11 (6.65%) or 8 (4.8%) of the 165 genes were activated 48 h after ZEBOV or MARV infection, respectively. This is in marked contrast to REBOV infection, in which 43 (or 26%) of the 165 ISGs were up-regulated ≥2-fold (P ≤ 0.01; n = 4) 48 h after infection. This same trend was also observed in REBOV-infected cells at 24 h p.i. (data not shown).
FIG.3.
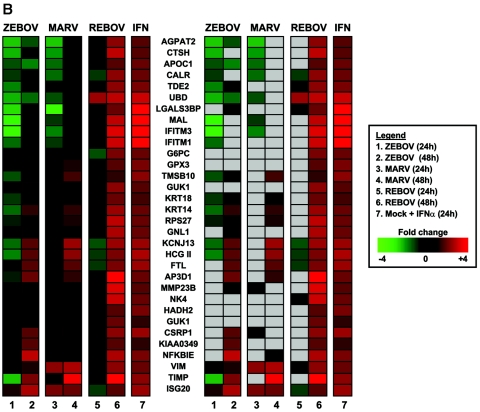
Increased activation and expression of IFN-regulated genes by REBOV compared to ZEBOV and MARV. Panel A, scatter plots of the expression patterns of individual genes that were ≥2-fold (n = 4; P < 0.01) up-regulated by treatment with 100 IU/ml IFN-α-2b in mock-infected cells compared to their expression in ZEBOV-, REBOV-, and MARV-infected cells at 48 h. Panel B, hierarchical clustering matrix of the ISGs that were up-regulated at 24 h and 48 h p.i. with REBOV, ZEBOV, or MARV relative to mock-infected cells treated with IFN-α-2b. In the left panel, genes shown in red were up-regulated and genes shown in green were down-regulated relative to uninfected Huh7 cells, while black indicates no change in gene expression. In the right panel, genes whose regulation showed a P value of >0.01 are shown in gray.
A hierarchical clustering diagram of the relative expression of all IFN-induced genes that were up-regulated by virus infection is shown in Fig. 3B. Using IFN treatment of mock-infected cells as a representation of an activated antiviral state, these results clearly demonstrate the increased expression of type I IFN-responsive genes during REBOV infection compared with that observed in cells infected with ZEBOV or MARV. This increased expression of IFN-responsive genes might represent a potential mechanism for the apparent attenuation of REBOV in humans. In order to address this question, we next treated cells infected with ZEBOV, REBOV, or MARV with IFN-α-2b and profiled IFN-regulated gene expression.
Increased activation of type I IFN receptor responses by REBOV.
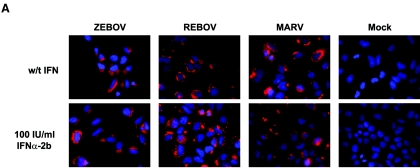
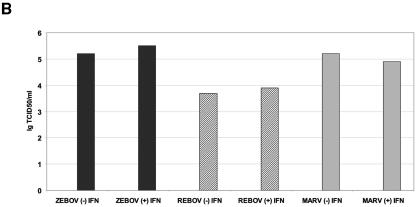
To further evaluate the ability of these filoviruses to antagonize the type I IFN response, we examined the effects of treating Huh7 cells already infected with ZEBOV, REBOV, or MARV with IFN-α-2b (100 IU/ml) for 24 h. To examine the effect of IFN treatment on viral protein expression and the production of virions, we examined the expression of the viral nucleoprotein by immunofluorescence assays and determined the titer of virus isolated from culture supernatants by TCID50 assay. As shown in Fig. 4A, IFN treatment of infected cells did not affect expression of the viral nucleoprotein, since all infections showed significant viral antigen staining following IFN treatment. Likewise, quantification of infectious virus in supernatants from infected cells showed that IFN treatment did not have a dramatic effect on replication (Fig. 4B). These results show that stimulation of type I IFN receptors in itself is not sufficient to reduce EBOV or MARV infection. However, in addition to stimulation of host cell antiviral responses, activation of type I IFN responses is also known to stimulate immune cell-mediated responses, for example, by the up-regulation of major histocompatibility complex (MHC) class I genes, which promote clearance of infected cells. Therefore, we next determined how infection with EBOV or MARV affected the expression of type I IFN-regulated genes.
FIG.4.
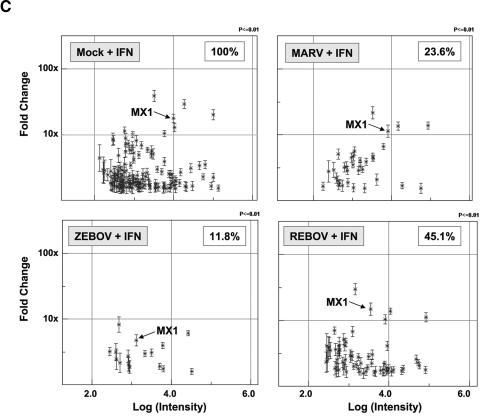
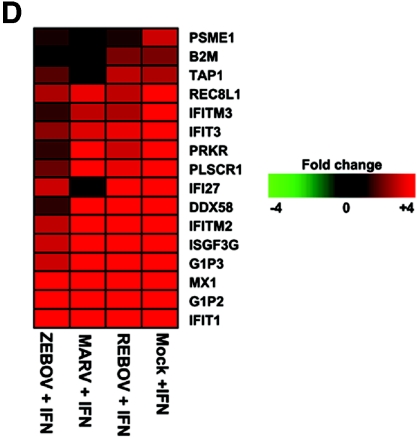
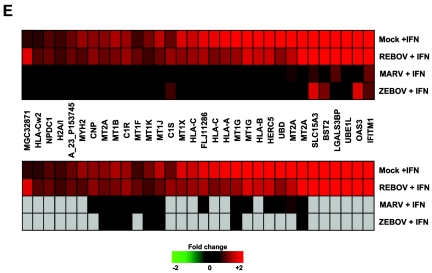
Increased activation of type I IFN receptor responses by REBOV infection. Panel A, immunofluorescence analysis of Huh7 cells infected with ZEBOV, REBOV, or MARV at an MOI of 0.1 for 24 h and then treated with 100 IU/ml of IFN-α-2b for an additional 24 h. Panel B, quantification of infectious viral particles in culture supernatants of infected cells in the presence and absence of 100 IU/ml IFN-α-2b (for 24 h) expressed as the log10 TCID50/ml. Panel C, scatter plots comparing the expression of genes that were >1.5× (P < 0.01) induced in mock-infected cells treated with 100 IU/ml IFN-α-2b for 24 h and in MARV-, ZEBOV-, and REBOV-infected cells (24 h) treated IFN-α-2b for 24 h. Expression of MX1 RNA is indicated by arrows. Panel D, matrix of genes induced >1.5× (P < 0.01) in ZEBOV-, REBOV-, and MARV-infected cells treated with IFN. Panel E, hierarchical clustering matrix of selected genes that were preferentially induced in REBOV-infected cells following IFN-α-2b treatment. In the top panel, genes shown in red were up-regulated and genes shown in green were down-regulated relative to uninfected Huh7 cells, and black indicates no change in gene expression. In the bottom panel, genes whose regulation showed a P value of >0.01 are shown in gray. Panel F, Western blotting analysis showing expression of MX1 protein during ZEBOV, REBOV, and MARV infection in the absence and presence of IFN-α-2b.
As shown in Fig. 4C, oligonucleotide microarray analysis of mock-infected cells treated for 24 h with IFN-α-2b (100 IU/ml) identified 144 genes that were induced ≥1.5-fold (P ≤ 0.01). A 1.5-fold change filter was used for these oligonucleotide arrays because of the superior signal-to-noise ratio of these slides compared to cDNA arrays. To determine the effect of viral infection on the regulation of type I IFN responses, we characterized the expression of this reference set of 144 IFN-stimulated genes in cells infected for 24 h with ZEBOV, REBOV, or MARV and then treated with IFN for an additional 24 h. (Gene expression in these cells was compared with gene expression in cells infected for 48 h in the absence of IFN-α-2b.) This analysis showed that IFN treatment of ZEBOV-infected cells resulted in the activation of 17 (11.8%) of the 144 ISGs observed in mock-infected IFN-treated cells, whereas IFN treatment of MARV-infected cells resulted in the up-regulation of 34 (23.6%) of these ISGs. In contrast, treatment of REBOV-infected cells with IFN-α-2b resulted in the up-regulation of 65 (45.1%) of this reference set of 144 ISGs.
As shown in Fig. 4D, a closer examination of the identities of the ISGs induced during infection showed that all of the genes up-regulated in ZEBOV-infected cells that were treated with IFN were also induced in MARV- and REBOV-infected cells treated with IFN. These genes included many well-known ISGs, such as IFIT1, G1P2, G1P3, IFITM2, ISGF3G, and MX1 (indicated in Fig. 4C). Similarly, 33 of 34 genes up-regulated in the IFN-treated MARV-infected cells were also up-regulated in IFN-treated REBOV-infected cells. This indicates that the differential response to IFN treatment in cells infected with ZEBOV or MARV does not result from the activation of different populations of genes but rather results from an expanding population of ISGs whose expression correlates with the reported human virulence of these viruses. Moreover, REBOV-infected cells that were treated with IFN showed the highest expression of genes involved in antigen presentation, including PSME1 and B2M. Additionally, when we examined the ISGs induced only in IFN-treated REBOV-infected cells (Fig. 4E), we observed that many of these genes were class I MHC genes (e.g., HLA-Cw2, HLA-C, HLA-A, and HLA-B), in addition to known oxidative stress (e.g., metallothioneins 1 and 2) and complement (e.g., C1R and C1S) genes.
To ensure that the up-regulated ISG expression observed by oligonucleotide microarray analysis was associated with increased protein expression, we examined the expression of the MX1 protein in infected cells in the absence or presence of IFN-α-2b (Fig. 4F). These data showed that in the absence of IFN treatment, no MX1 protein was detected in either mock-infected or virus-infected cells (lanes 1 to 4); however, following IFN-α-2b treatment, we observed a significant induction of MX1 protein in all infections (lanes 5 to 8). We next wanted to determine if there were differences in the activation of IFN receptor signaling responses that could be correlated with the ISG expression data by examining the phosphorylation-dependent activation of STAT1 protein.
Phosphorylation of STAT1 and STAT2 proteins in filovirus-infected cells following IFN-α treatment.
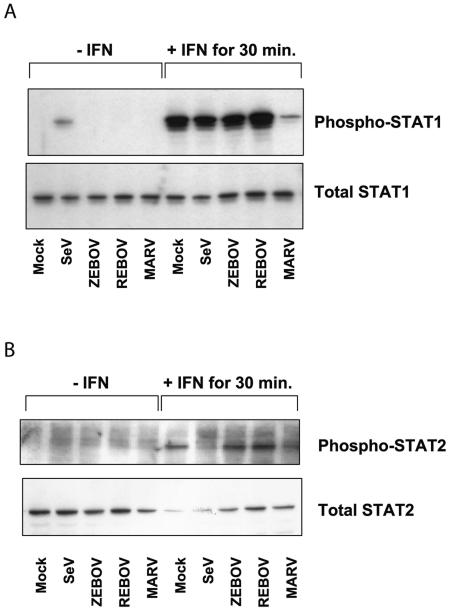
To better understand the mechanism by which different EBOV and MARV viruses can antagonize type I IFN receptor signaling responses, we examined the phosphorylation of STAT1 protein in ZEBOV-, REBOV-, and MARV-infected cells treated with IFN-α-2b (100 IU/ml) for 30 min. As shown in Fig. 5A, in the absence of IFN treatment, none of the filoviruses tested showed phosphorylation of STAT1 protein at 24 h p.i. (lanes 3 to 5), compared to a low level of STAT1 phosphorylation observed in SeV-infected cells (lane 2). Following 30 min of IFN treatment, we observed an increase in STAT1 phosphorylation in mock-, SeV-, ZEBOV-, and REBOV-infected cells (lanes 6 to 9), while only a low level of STAT1 phosphorylation was observed in MARV-infected cells. Next, phosphorylation of STAT2 in infected and IFN-treated cells was examined. It is shown in Fig. 5B that in contrast to the case for infection with SeV (lane 7), which is known to interfere with STAT2 phosphorylation (33), STAT2 was phosphorylated in ZEBOV- and REBOV-infected cells as efficiently as in mock-infected and IFN-treated cells (lanes 6, 8, and 9). Intriguingly, as also shown for STAT1, STAT2 phosphorylation was markedly impaired in MARV-infected cells (lane 10). These results indicated that ZEBOV and REBOV were not directly antagonizing the phosphorylation of STAT1 and -2, unlike MARV, which appeared to be inhibiting phosphorylation of both STAT1 and STAT2. Moreover, these data suggest that ZEBOV is antagonizing, rather, a downstream effect of type I IFN receptor stimulation. Thus, further study will reveal whether nuclear import of STAT proteins is affected by ZEBOV infection or whether other pathways interfering with IFN signaling are involved.
FIG.5.
Phosphorylation of STAT proteins in filovirus-infected cells following type I IFN treatment. Western blotting analysis was performed on equal-mass cell lysates obtained from mock-, SeV-, ZEBOV-, REBOV-, or MARV-infected cells at 24 h in the absence or presence of 100 IU/ml IFN-α-2b for 30 min, using antibodies specific for phosphorylated STAT1 or total STAT1 protein (A) or for phosphorylated STAT2 or total STAT2 protein (B).
DISCUSSION
Our genomic analysis showed many similarities in infection-induced alterations of mRNA expression, including that of immune-, coagulation-, and acute phase-related genes, as well as an overall antagonism of key antiviral responses, including IFN regulatory factor 3 (IRF3), PKR, and TLR pathways. Moreover, these studies demonstrated that immune evasion, which is a key feature of filovirus infections, is associated with the overall ability of these viruses to control host cell mRNA expression and prevent activation of the innate antiviral response. However, we also identified important differences in the antagonism of the type I IFN response between ZEBOV and REBOV and observed more significant expression of ISGs during REBOV infection.
Relationship between the inhibition of antiviral responses and viral fitness.
Viral fitness is a measurement of the ability of a virus to achieve the highest rates of replication and production of progeny virions in a given host. One strategy to increase viral fitness is to control the response of the host cell to infection by affecting cellular gene expression to maximize expression of viral proteins and production of new virus and to minimize the activation of an antiviral state that would increase viral clearance by apoptosis or immune cell killing. In particular, for RNA viruses with relatively small genomes encoding few viral proteins, such as EBOV and influenza virus, control of host cell gene expression is critical for viral fitness (4, 36). The ability of EBOV and MARV to evade the cellular antiviral response and suppress the immune response during clinical infections demonstrates the profound ability of these viruses to alter host cell gene expression programs. For example, one of the principal components of the innate immune and antiviral responses is the type I IFN response. Previous work from our laboratory on the pandemic 1918 influenza virus revealed a higher IFN antagonistic activity of the pandemic NS1 protein compared to other H1N1 viruses (24). These results suggest that an important parameter of 1918 influenza virus fitness was a more significant suppression of the IFN response that led to increased immune evasion, replication, and virulence.
Previous work by Harcourt et al. showed that ZEBOV was a potent antagonist of the double-stranded RNA (dsRNA) response in human umbilical vein endothelial cells (HUVECs) (27). When ZEBOV-infected HUVECs were treated with poly(I/C) RNA, those authors saw inhibition of several dsRNA-responsive genes, including MHC class I, OAS1, PKR, IL-6, and ICAM1. Similarly, additional studies showed that ZEBOV is also an inhibitor of type I and II IFN responses and that treatment of infected HUVECs with IFN-α and IFN-γ does not increase expression of class I MHC, IRF1, or OAS1 (28). However, both of these studies showed that the ZEBOV antagonism of dsRNA and IFN responses is not a general inhibition in cellular signaling, as expression of IL-1β-responsive genes (IL-6 and ICAM1) is not inhibited by infection. Combined with our studies that showed that type I IFN treatment of REBOV-infected cells resulted in the up-regulation of many ISGs, including class I MHC genes, these studies show that antagonism of antiviral responses, particularly the type I IFN response, plays a central role in filovirus virulence.
As a key parameter of viral fitness, IFN antagonists are encoded in many viral genomes, including those of influenza virus, vaccinia virus, and EBOV. Basler and colleagues have demonstrated that the VP35 protein, which is a component of the RNA polymerase, also acts as a type I IFN antagonist and prevents the activation of the IFN regulatory transcription factor IRF3, although no significant differences are observed between VP35s from ZEBOV and REBOV (5). Our genomics analysis demonstrated that not only IFN induction but also IFN signaling was impaired in ZEBOV- and MARV-infected cells. This effect is much less pronounced in REBOV-infected cells, in which 45.1% of the ISGs expressed in the control cells were induced upon IFN treatment. During REBOV infection, the increased expression of the IFNAR-regulated kinase JAK1 could be leading to increased activation of STAT1 phosphorylation, which may account for the significant increase in IFN-α-stimulated gene expression described in this study. However, determination of tyrosine phosphorylation of STAT1 and STAT2 in ZEBOV-, REBOV-, and MARV-infected cells revealed that both proteins were efficiently phosphorylated in ZEBOV- and REBOV- but not in MARV-infected cells, indicating that inhibition of IFN receptor signaling is differentially regulated in MARV- and ZEBOV-infected cells. Thus, an inhibitory effect of ZEBOV downstream of STAT phosphorylation is assumed. A possible explanation for our data could be that the nuclear import of the STAT proteins might be inhibited in ZEBOV-infected cells. It is also possible that other pathways known to interfere with IFN signaling are involved (40). The observation that in REBOV-infected cells many more ISGs are induced than in ZEBOV- and MARV-infected cells might be due to the lower replication rate of this virus (7). However, current investigations to define the mechanisms and viral proteins associated with antagonism of IFN receptor signaling and responses are under way.
It is known that SeV, which was used as a control virus in these experiments, interferes with IFN signaling. It is reported that expression of SeV C protein leads to increased STAT1 phosphorylation, whereas STAT2 is not phosphorylated at all (17, 33). This is in line with our results showing the expected phosphorylation states of STAT1 and -2 in SeV-infected cells.
To expand on our analyses, we used a pattern recognition algorithm (MatInspector, which is part of the Genomatix suite of DNA analysis tools) to perform transcription factor prediction analysis on the DNA sequences 5,000 bp upstream from the transcriptional start sites of genes that were expressed in ZEBOV-infected cells treated with IFN-α and of IFN-α-inducible genes that were repressed by ZEBOV infection. This analysis showed that all genes had high-confidence consensus matches to known IFN-responsive enhancer elements, including ISREs. We also observed that genes that escaped EBOV inhibition possessed multiple copies of DNA binding sites for IL-1β-responsive transcription factors within 1,000 bp of the transcriptional start site. These binding sites were not observed in any of the EBOV-repressed genes. This is especially interesting, since it has been reported that IL-1β signaling and responses are not antagonized by ZEBOV infection (27, 28). Finally, our studies clearly reveal the profound capacity of ZEBOV to antagonize IFN receptor signaling. This inhibition may be a key factor in facilitating the high-capacity replication of EBOV and for disease severity.
Filovirus-induced viral hemorrhagic fever.
Severe systemic infections often result in the stimulation of coagulation arising from tissue factor-mediated generation of thrombin and the inhibition of fibrinolysis and anticoagulant gene expression. In particular, filovirus infection frequently leads to dramatic hemostatic abnormalities, including activation and depletion of coagulation factors, which results in the onset of coagulopathy and hemorrhagic symptoms. Recent work has shown that EBOV activates the extrinsic coagulation pathway by stimulating the expression of TF (also known as F3) in primate monocytes (20). Additional studies have shown some success in prolonging survival times of EBOV-infected macaques by blocking the coagulation pathway with an inhibitor of the factor VIIa/TF complex (19). Our array and real-time PCR analysis demonstrated that both ZEBOV and REBOV infection resulted in the increased expression of TF (or F3) and that TF up-regulation was more significant in ZEBOV-infected cells. Interestingly, expression of TFPI1, which is a potent antagonist of TF responses, was slightly up-regulated by ZEBOV; however, given the significant up-regulation of TF expression, the biological effect of a small increase in TFPI1 may be minimal.
One especially intriguing result was our observation that EBOV and MARV infection of Huh7 cells resulted in the overall down-regulation of coagulation-related gene expression. Since the liver is an important source of the synthesis, expression, and replenishment of coagulation factors, our observation of an overall decrease in clotting factors during filovirus infection suggests that during human clinical and macaque experimental infections, high levels of liver cell infection inhibit the liver from regenerating clotting factors depleted by activation of the extrinsic pathway via increased infected-monocyte TF expression. In effect, the down-regulation of clotting factor production by the liver late in infection would exacerbate the effect of infected macrophages activating the extrinsic pathway and lead to even more severe hemorrhagic manifestations.
Taken together, these studies demonstrate the ability of EBOV and MARV to modulate host cell gene expression to antagonize the activation of the innate antiviral response. The reduced ability of REBOV to block expression of IFN-related gene expression is likely related to the attenuation of REBOV in humans. Studies are under way to elucidate the response of primary human macrophages to ZEBOV and REBOV infections and the mechanisms of antiviral response evasion, and it is our hope that knowledge of the global transcriptional changes induced by filovirus infection of these cells will increase our understanding of the mechanisms employed by these highly pathogenic viruses to circumvent these responses and may lead to new diagnostic markers and new targets for therapeutic intervention for viral hemorrhagic fever.
Acknowledgments
We thank Kathie Walters and Marcus Korth (University of Washington) for many helpful discussions, Otto Haller and Georg Kochs (University of Freiburg, Freiburg, Germany) for kindly providing the MX1 antibody M143, and Christopher Basler (Mount Sinai School of Medicine, New York) for Sendai virus strain Cantell.
Work in the Katze laboratory was supported by NIH grants AI058113-01, AI056214-02, and DA015625-03. Work in Marburg was supported by the Deutsche Forschungsgemeinschaft (SFB 535).
REFERENCES
- 1.Baize, S., E. M. Leroy, A. J. Georges, M. C. Georges-Courbot, M. Capron, I. Bedjabaga, J. Lansoud-Soukate, and E. Mavoungou. 2002. Inflammatory responses in Ebola virus-infected patients. Clin. Exp. Immunol. 128:163-168. [DOI] [PMC free article] [PubMed] [Google Scholar]
- 2.Baize, S., E. M. Leroy, M. C. Georges-Courbot, M. Capron, J. Lansoud-Soukate, P. Debre, S. P. Fisher-Hoch, J. B. McCormick, and A. J. Georges. 1999. Defective humoral responses and extensive intravascular apoptosis are associated with fatal outcome in Ebola virus-infected patients. Nat. Med. 5:423-426. [DOI] [PubMed] [Google Scholar]
- 3.Baize, S., E. M. Leroy, E. Mavoungou, and S. P. Fisher-Hoch. 2000. Apoptosis in fatal Ebola infection. Does the virus toll the bell for immune system? Apoptosis 5:5-7. [DOI] [PubMed] [Google Scholar]
- 4.Basler, C. F., and A. Garcia-Sastre. 2002. Viruses and the type I interferon antiviral system: induction and evasion. Int. Rev. Immunol. 21:305-337. [DOI] [PubMed] [Google Scholar]
- 5.Basler, C. F., A. Mikulasova, L. Martinez-Sobrido, J. Paragas, E. Mühlberger, M. Bray, H. D. Klenk, P. Palese, and A. Garcia-Sastre. 2003. The Ebola virus VP35 protein inhibits activation of interferon regulatory factor 3. J. Virol. 77:7945-7956. [DOI] [PMC free article] [PubMed] [Google Scholar]
- 6.Biron, C. A., and G. C. Sen. 2001. Interferons and other cytokines, p. 321-351. In D. M. Knipe and P. M. Howley (ed.), Field's virology, 4th ed., vol. 1. Lippincott, Williams, and Wilkins, Philadelphia, Pa. [Google Scholar]
- 7.Boehmann, Y., S. Enterlein, A. Randolf, and E. Mühlberger. 2005. A reconstituted replication and transcription system for Ebola virus Reston and comparison with Ebola virus Zaire. Virology 332:406-417. [DOI] [PubMed] [Google Scholar]
- 8.Bray, M. 2001. The role of the type I interferon response in the resistance of mice to filovirus infection. J. Gen. Virol. 82:1365-1373. [DOI] [PubMed] [Google Scholar]
- 9.Bray, M., K. Davis, T. Geisbert, C. Schmaljohn, and J. Huggins. 1999. A mouse model for evaluation of prophylaxis and therapy of Ebola hemorrhagic fever. J. Infect. Dis. 179(Suppl. 1):S248-S258. [DOI] [PubMed] [Google Scholar]
- 10.Bray, M., S. Hatfill, L. Hensley, and J. W. Huggins. 2001. Haematological, biochemical and coagulation changes in mice, guinea-pigs and monkeys infected with a mouse-adapted variant of Ebola Zaire virus. J. Comp. Pathol. 125:243-253. [DOI] [PubMed] [Google Scholar]
- 11.Brazma, A., P. Hingamp, J. Quackenbush, G. Sherlock, P. Spellman, C. Stoeckert, J. Aach, W. Ansorge, C. A. Ball, H. C. Causton, T. Gaasterland, P. Glenisson, F. C. Holstege, I. F. Kim, V. Markowitz, J. C. Matese, H. Parkinson, A. Robinson, U. Sarkans, S. Schulze-Kremer, J. Stewart, R. Taylor, J. Vilo, and M. Vingron. 2001. Minimum information about a microarray experiment (MIAME)-toward standards for microarray data. Nat. Genet. 29:365-371. [DOI] [PubMed] [Google Scholar]
- 12.Chomczynski, P., and N. Sacchi. 1987. Single-step method of RNA isolation by acid guanidinium thiocyanate-phenol-chloroform extraction. Anal. Biochem. 162:156-159. [DOI] [PubMed] [Google Scholar]
- 13.Davis, K. J., A. O. Anderson, T. W. Geisbert, K. E. Steele, J. B. Geisbert, P. Vogel, B. M. Connolly, J. W. Huggins, P. B. Jahrling, and N. K. Jaax. 1997. Pathology of experimental Ebola virus infection in African green monkeys. Involvement of fibroblastic reticular cells. Arch. Pathol. Lab. Med. 121:805-819. [PubMed] [Google Scholar]
- 14.Feldmann, H., H. Bugany, F. Mahner, H. D. Klenk, D. Drenckhahn, and H. J. Schnittler. 1996. Filovirus-induced endothelial leakage triggered by infected monocytes/macrophages. J. Virol. 70:2208-2214. [DOI] [PMC free article] [PubMed] [Google Scholar]
- 15.Feldmann, H., H. D. Klenk, and A. Sanchez. 1993. Molecular biology and evolution of filoviruses. Arch. Virol. Suppl. 7:81-100. [DOI] [PubMed] [Google Scholar]
- 16.Fisher-Hoch, S. P., T. L. Brammer, S. G. Trappier, L. C. Hutwagner, B. B. Farrar, S. L. Ruo, B. G. Brown, L. M. Hermann, G. I. Perez-Oronoz, C. S. Goldsmith, et al. 1992. Pathogenic potential of filoviruses: role of geographic origin of primate host and virus strain. J. Infect. Dis. 166:753-763. [DOI] [PubMed] [Google Scholar]
- 17.Garcin, D., J. B. Marq, S. Goodbourn, and D. Kolakofsky. 2003. The amino-terminal extensions of the longer Sendai virus C proteins modulate pY701-Stat1 and bulk Stat1 levels independently of interferon signaling. J. Virol. 77:2321-2329. [DOI] [PMC free article] [PubMed] [Google Scholar]
- 18.Geisbert, T. W., L. E. Hensley, T. R. Gibb, K. E. Steele, N. K. Jaax, and P. B. Jahrling. 2000. Apoptosis induced in vitro and in vivo during infection by Ebola and Marburg viruses. Lab. Investig. 80:171-186. [DOI] [PubMed] [Google Scholar]
- 19.Geisbert, T. W., L. E. Hensley, P. B. Jahrling, T. Larsen, J. B. Geisbert, J. Paragas, H. A. Young, T. M. Fredeking, W. E. Rote, and G. P. Vlasuk. 2003. Treatment of Ebola virus infection with a recombinant inhibitor of factor VIIa/tissue factor: a study in rhesus monkeys. Lancet 362:1953-1958. [DOI] [PubMed] [Google Scholar]
- 20.Geisbert, T. W., H. A. Young, P. B. Jahrling, K. J. Davis, E. Kagan, and L. E. Hensley. 2003. Mechanisms underlying coagulation abnormalities in Ebola hemorrhagic fever: overexpression of tissue factor in primate monocytes/macrophages is a key event. J. Infect. Dis. 188:1618-1629. [DOI] [PubMed] [Google Scholar]
- 21.Geisbert, T. W., H. A. Young, P. B. Jahrling, K. J. Davis, T. Larsen, E. Kagan, and L. E. Hensley. 2003. Pathogenesis of Ebola hemorrhagic fever in primate models: evidence that hemorrhage is not a direct effect of virus-induced cytolysis of endothelial cells. Am. J. Pathol. 163:2371-2382. [DOI] [PMC free article] [PubMed] [Google Scholar]
- 22.Geiss, G. K., M. C. An, R. E. Bumgarner, E. Hammersmark, D. Cunningham, and M. G. Katze. 2001. Global impact of influenza virus on cellular pathways is mediated by both replication-dependent and -independent events. J. Virol. 75:4321-4331. [DOI] [PMC free article] [PubMed] [Google Scholar]
- 23.Geiss, G. K., R. E. Bumgarner, M. C. An, M. B. Agy, A. B. van't Wout, E. Hammersmark, V. S. Carter, D. Upchurch, J. I. Mullins, and M. G. Katze. 2000. Large-scale monitoring of host cell gene expression during HIV-1 infection using cDNA microarrays. Virology 266:8-16. [DOI] [PubMed] [Google Scholar]
- 24.Geiss, G. K., M. Salvatore, T. M. Tumpey, V. S. Carter, X. Wang, C. F. Basler, J. K. Taubenberger, R. E. Bumgarner, P. Palese, M. G. Katze, and A. Garcia-Sastre. 2002. Cellular transcriptional profiling in influenza A virus-infected lung epithelial cells: the role of the nonstructural NS1 protein in the evasion of the host innate defense and its potential contribution to pandemic influenza. Proc. Natl. Acad. Sci. USA 99:10736-10741. [DOI] [PMC free article] [PubMed] [Google Scholar]
- 25.Gibb, T. R., M. Bray, T. W. Geisbert, K. E. Steele, W. M. Kell, K. J. Davis, and N. K. Jaax. 2001. Pathogenesis of experimental Ebola Zaire virus infection in BALB/c mice. J. Comp. Pathol. 125:233-242. [DOI] [PubMed] [Google Scholar]
- 26.Gupta, M., S. Mahanty, R. Ahmed, and P. E. Rollin. 2001. Monocyte-derived human macrophages and peripheral blood mononuclear cells infected with Ebola virus secrete MIP-1alpha and TNF-alpha and inhibit poly-IC-induced IFN-alpha in vitro. Virology 284:20-25. [DOI] [PubMed] [Google Scholar]
- 27.Harcourt, B. H., A. Sanchez, and M. K. Offermann. 1998. Ebola virus inhibits induction of genes by double-stranded RNA in endothelial cells. Virology 252:179-188. [DOI] [PubMed] [Google Scholar]
- 28.Harcourt, B. H., A. Sanchez, and M. K. Offermann. 1999. Ebola virus selectively inhibits responses to interferons, but not to interleukin-1β, in endothelial cells. J. Virol. 73:3491-3496. [DOI] [PMC free article] [PubMed] [Google Scholar]
- 29.Hensley, L. E., H. A. Young, P. B. Jahrling, and T. W. Geisbert. 2002. Proinflammatory response during Ebola virus infection of primate models: possible involvement of the tumor necrosis factor receptor superfamily. Immunol. Lett. 80:169-179. [DOI] [PubMed] [Google Scholar]
- 30.Jahrling, P. B., T. W. Geisbert, D. W. Dalgard, E. D. Johnson, T. G. Ksiazek, W. C. Hall, and C. J. Peters. 1990. Preliminary report: isolation of Ebola virus from monkeys imported to USA. Lancet 335:502-505. [DOI] [PubMed] [Google Scholar]
- 31.Jahrling, P. B., T. W. Geisbert, J. B. Geisbert, J. R. Swearengen, M. Bray, N. K. Jaax, J. W. Huggins, J. W. LeDuc, and C. J. Peters. 1999. Evaluation of immune globulin and recombinant interferon-alpha2b for treatment of experimental Ebola virus infections. J. Infect. Dis. 179(Suppl. 1):S224-S234. [DOI] [PubMed] [Google Scholar]
- 32.Jahrling, P. B., T. W. Geisbert, N. K. Jaax, M. A. Hanes, T. G. Ksiazek, and C. J. Peters. 1996. Experimental infection of cynomolgus macaques with Ebola-Reston filoviruses from the 1989-1990 U.S. epizootic. Arch. Virol. Suppl. 11:115-134. [DOI] [PubMed] [Google Scholar]
- 33.Kato, A., C. Cortese-Grogan, S. A. Moyer, F. Sugahara, T. Sakaguchi, T. Kubota, N. Otsuki, M. Kohase, M. Tashiro, and Y. Nagai. 2004. Characterization of the amino acid residues of Sendai virus C protein that are critically involved in its interferon antagonism and RNA synthesis down-regulation. J. Virol. 78:7443-7454. [DOI] [PMC free article] [PubMed] [Google Scholar]
- 34.Leroy, E. M., S. Baize, P. Debre, J. Lansoud-Soukate, and E. Mavoungou. 2001. Early immune responses accompanying human asymptomatic Ebola infections. Clin. Exp. Immunol. 124:453-460. [DOI] [PMC free article] [PubMed] [Google Scholar]
- 35.Leroy, E. M., S. Baize, V. E. Volchkov, S. P. Fisher-Hoch, M. C. Georges-Courbot, J. Lansoud-Soukate, M. Capron, P. Debre, J. B. McCormick, and A. J. Georges. 2000. Human asymptomatic Ebola infection and strong inflammatory response. Lancet 355:2210-2215. [DOI] [PubMed] [Google Scholar]
- 36.Levy, D. E., and A. Garcia-Sastre. 2001. The virus battles: IFN induction of the antiviral state and mechanisms of viral evasion. Cytokine Growth Factor Rev. 12:143-156. [DOI] [PubMed] [Google Scholar]
- 37.Lukashevich, I. S., R. Maryankova, A. S. Vladyko, N. Nashkevich, S. Koleda, M. Djavani, D. Horejsh, N. N. Voitenok, and M. S. Salvato. 1999. Lassa and Mopeia virus replication in human monocytes/macrophages and in endothelial cells: different effects on IL-8 and TNF-alpha gene expression. J. Med. Virol. 59:552-560. [PMC free article] [PubMed] [Google Scholar]
- 38.Mahanty, S., and M. Bray. 2004. Pathogenesis of filoviral haemorrhagic fevers. Lancet Infect. Dis. 4:487-498. [DOI] [PubMed] [Google Scholar]
- 39.Mahanty, S., K. Hutchinson, S. Agarwal, M. McRae, P. E. Rollin, and B. Pulendran. 2003. Cutting edge: impairment of dendritic cells and adaptive immunity by Ebola and Lassa viruses. J. Immunol. 170:2797-2801. [DOI] [PubMed] [Google Scholar]
- 40.Platanias, L. C. 2005. Mechanisms of type-I- and type-II-interferon-mediated signalling. Nat. Rev. Immunol. 5:375-386. [DOI] [PubMed] [Google Scholar]
- 41.Schnittler, H. J., and H. Feldmann. 1999. Molecular pathogenesis of filovirus infections: role of macrophages and endothelial cells. Curr. Top. Microbiol. Immunol. 235:175-204. [DOI] [PubMed] [Google Scholar]
- 42.van der Groen, G., W. Jacob, and S. R. Pattyn. 1979. Ebola virus virulence for newborn mice. J. Med. Virol. 4:239-240. [DOI] [PubMed] [Google Scholar]
- 43.Villinger, F., P. E. Rollin, S. S. Brar, N. F. Chikkala, J. Winter, J. B. Sundstrom, S. R. Zaki, R. Swanepoel, A. A. Ansari, and C. J. Peters. 1999. Markedly elevated levels of interferon (IFN)-gamma, IFN-alpha, interleukin (IL)-2, IL-10, and tumor necrosis factor-alpha associated with fatal Ebola virus infection. J. Infect. Dis. 179(Suppl. 1):S188-S191. [DOI] [PubMed] [Google Scholar]


