Abstract
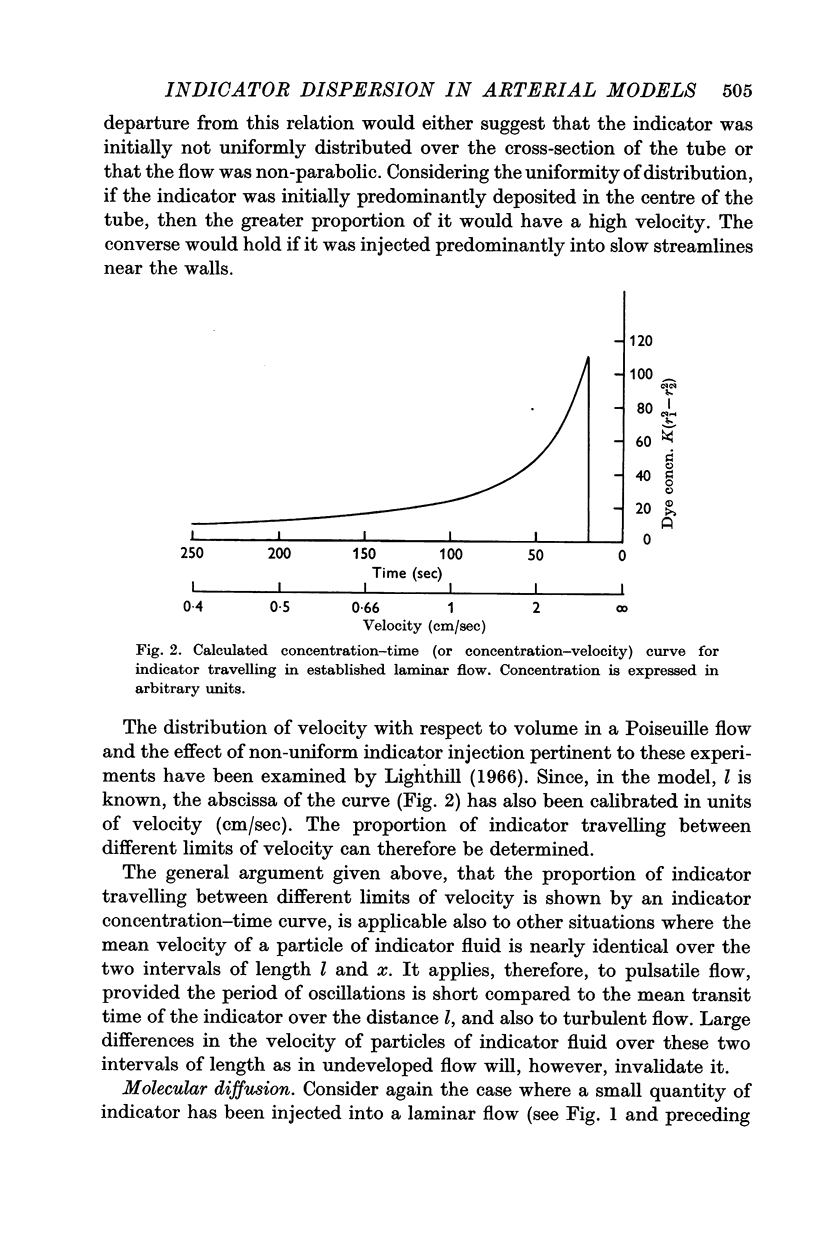
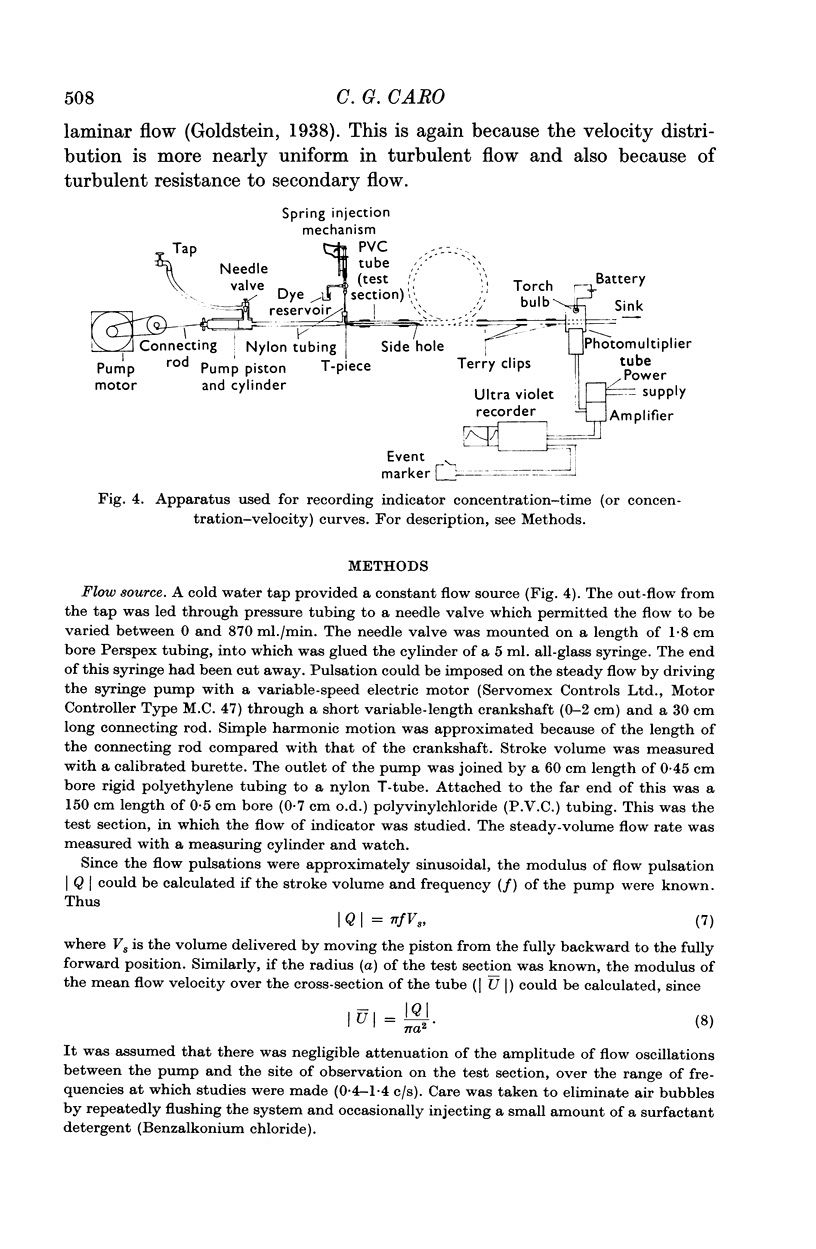
1. The distribution of velocity (velocity profile) was studied in water flowing through simple models of the circulation. Dye was injected and the distribution of velocity was assessed from indicator concentration—time curves recorded with a photomultiplier.
2. Observations were made on straight and curved tubes and on a tube containing a short region with an elliptical cross-section. With steady flow, the rate was varied over the range 24-870 ml./min (Reynolds number 102-3690). Sinusoidal pulsations were imposed on the steady flow in some experiments.
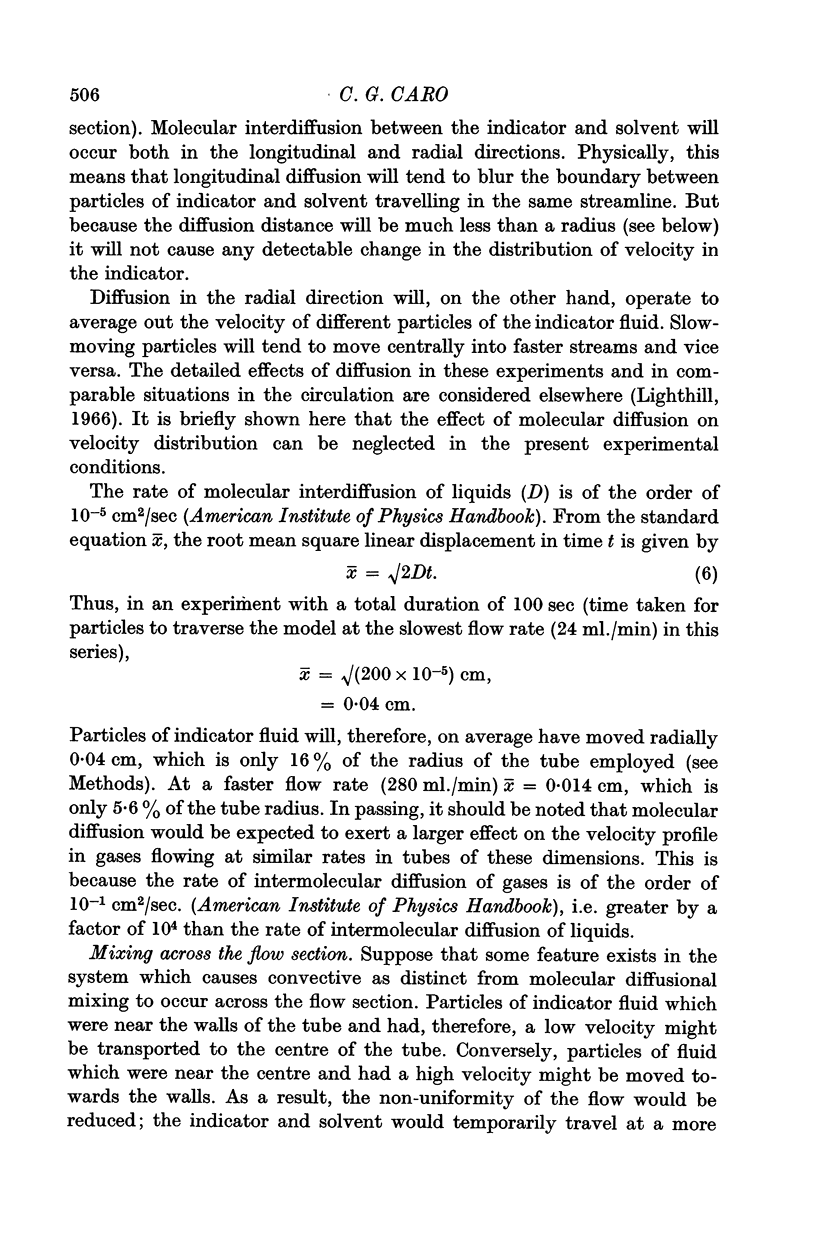
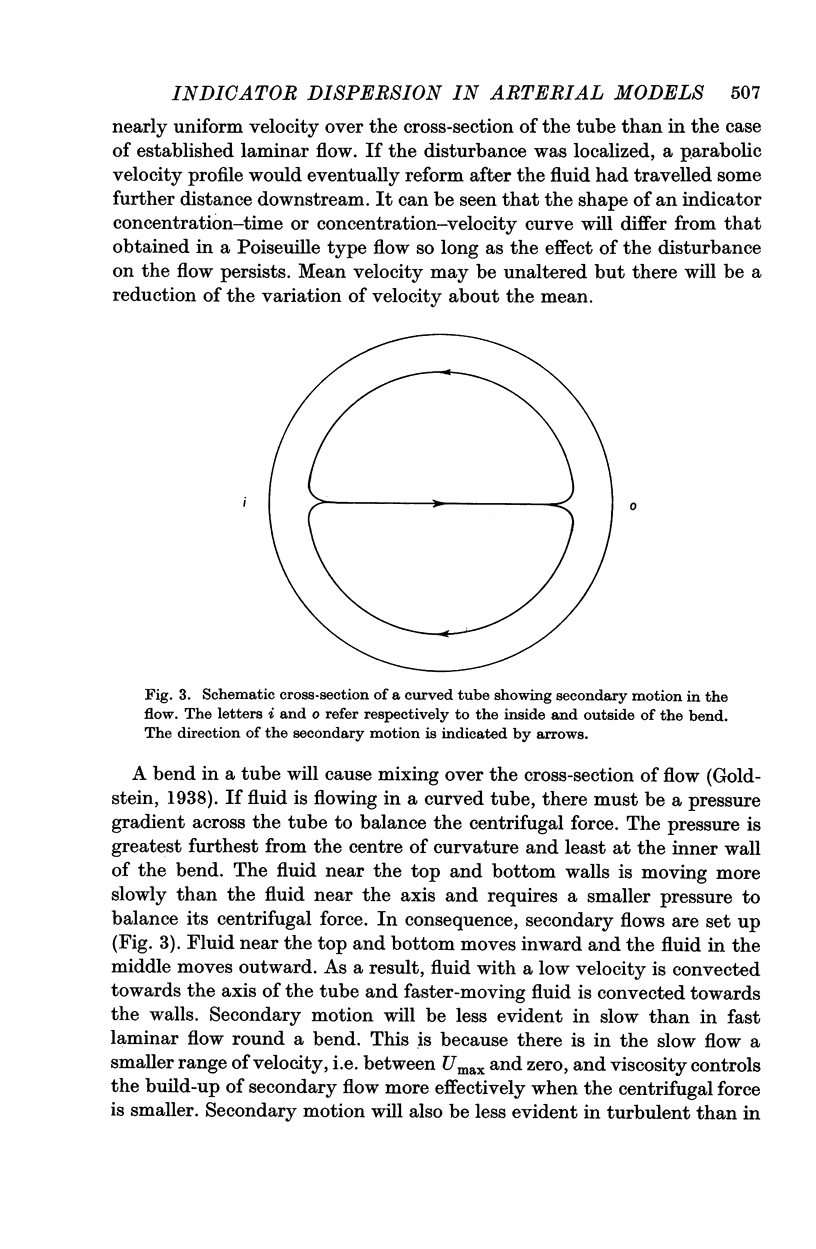
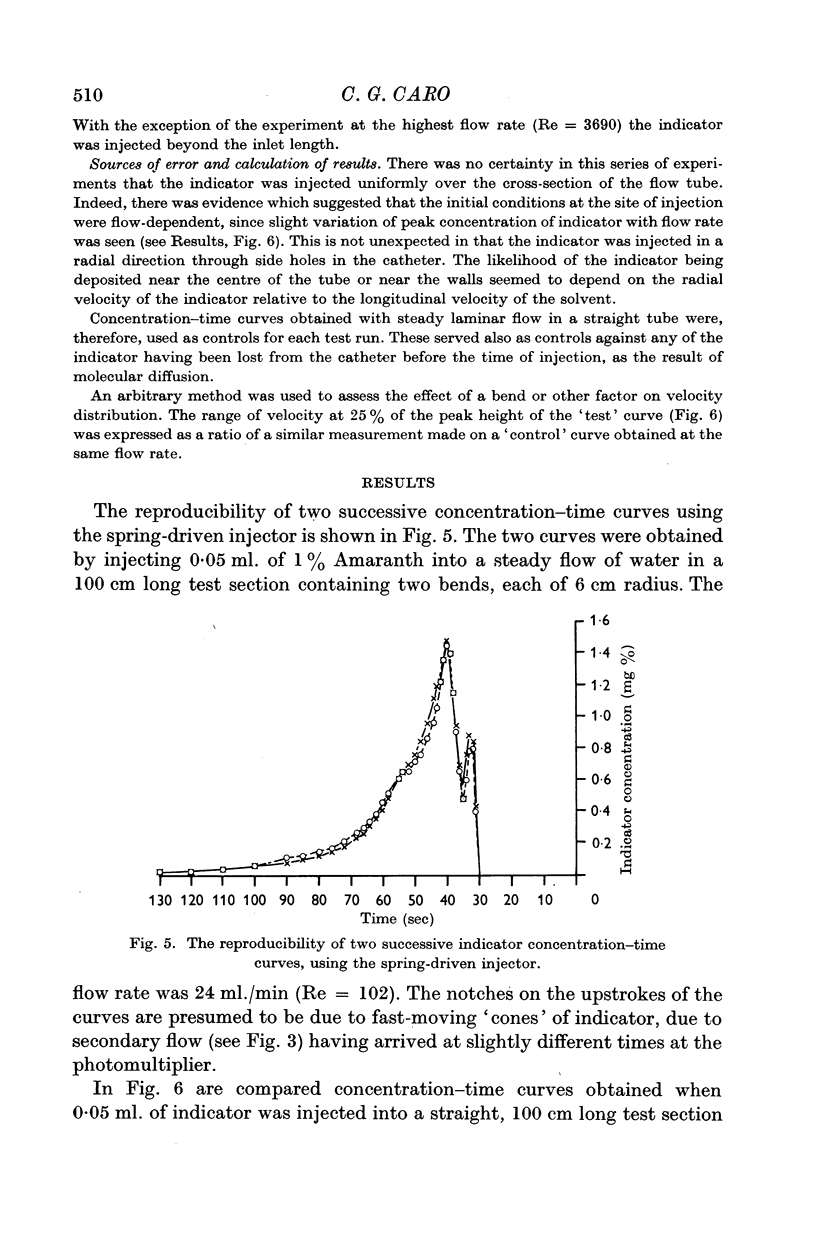
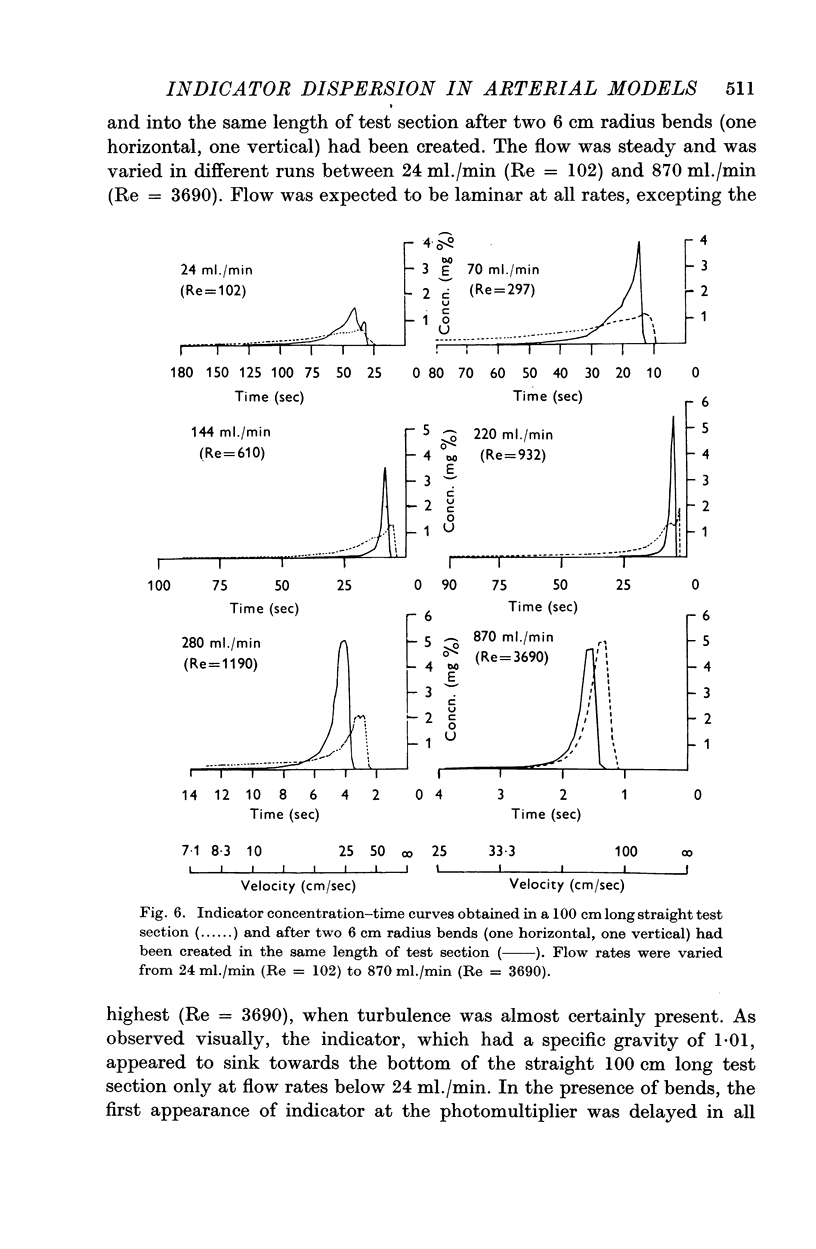
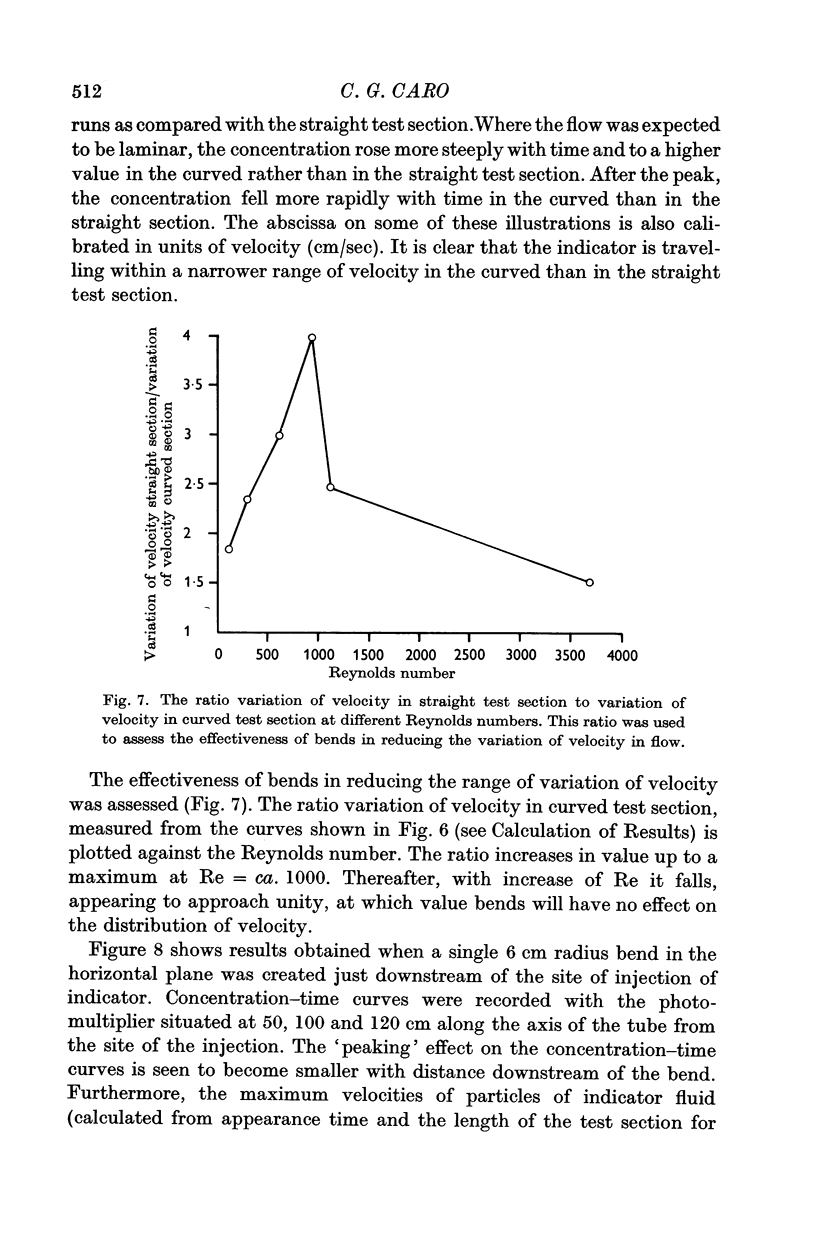
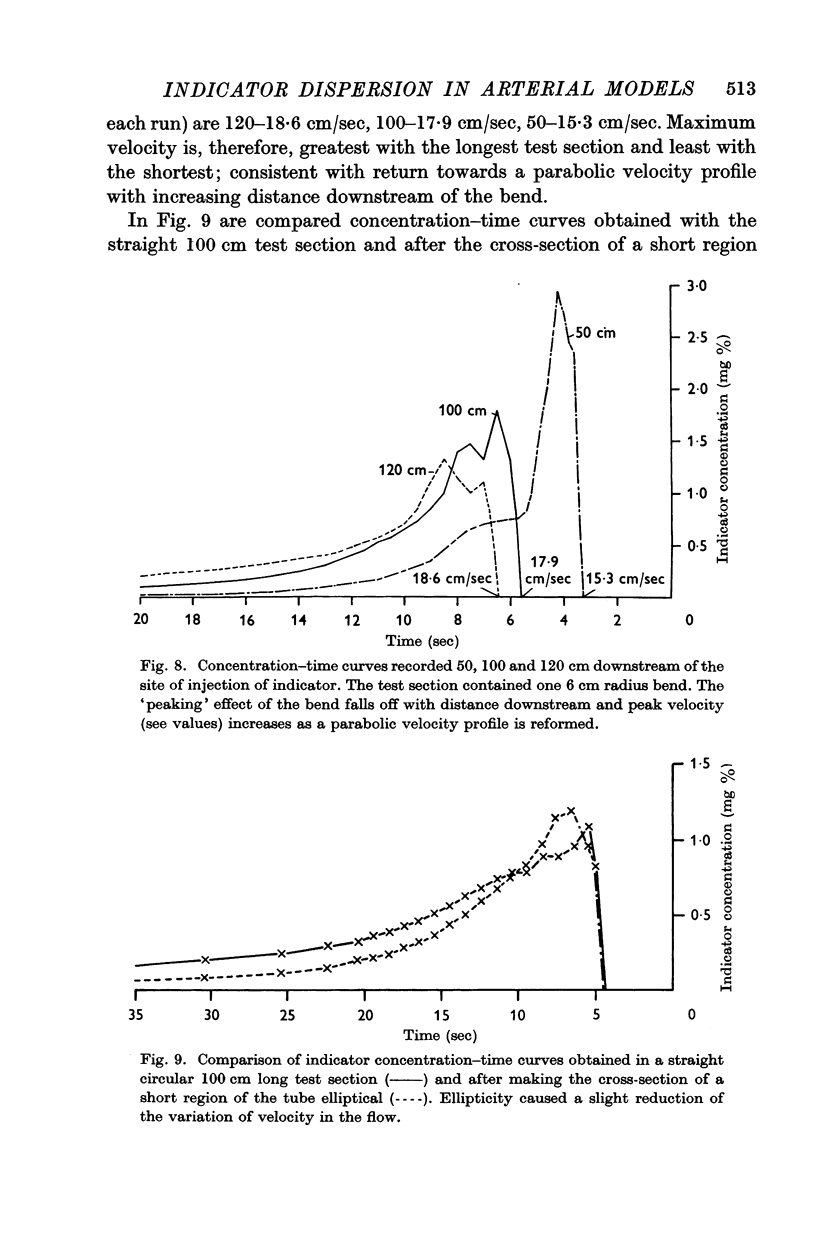
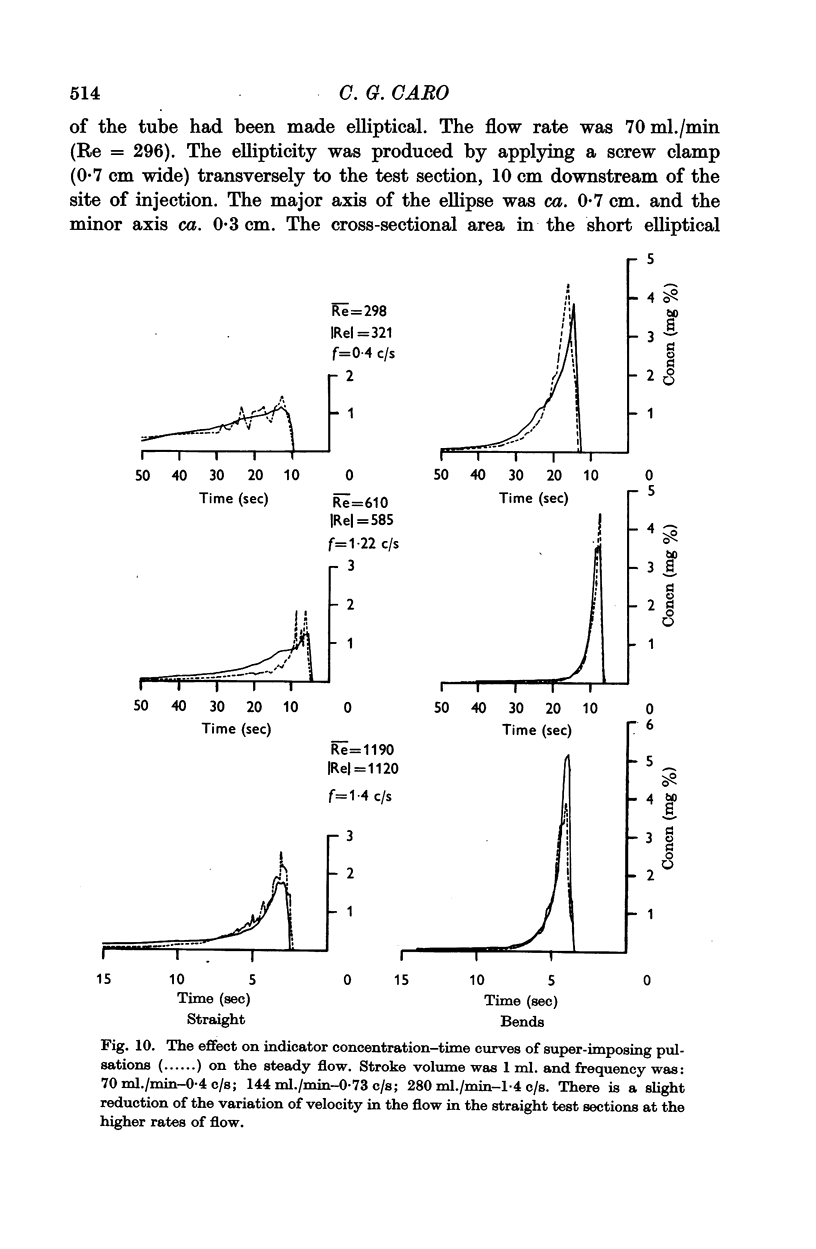
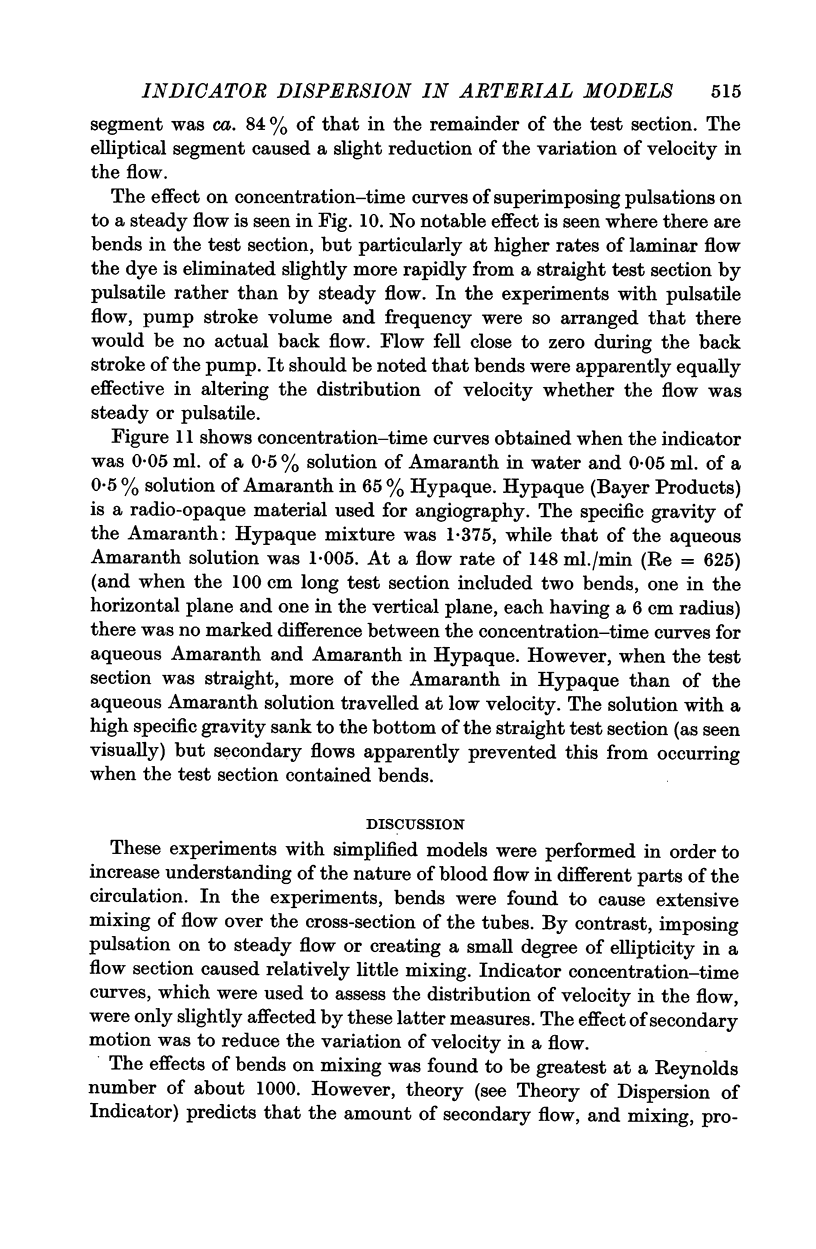
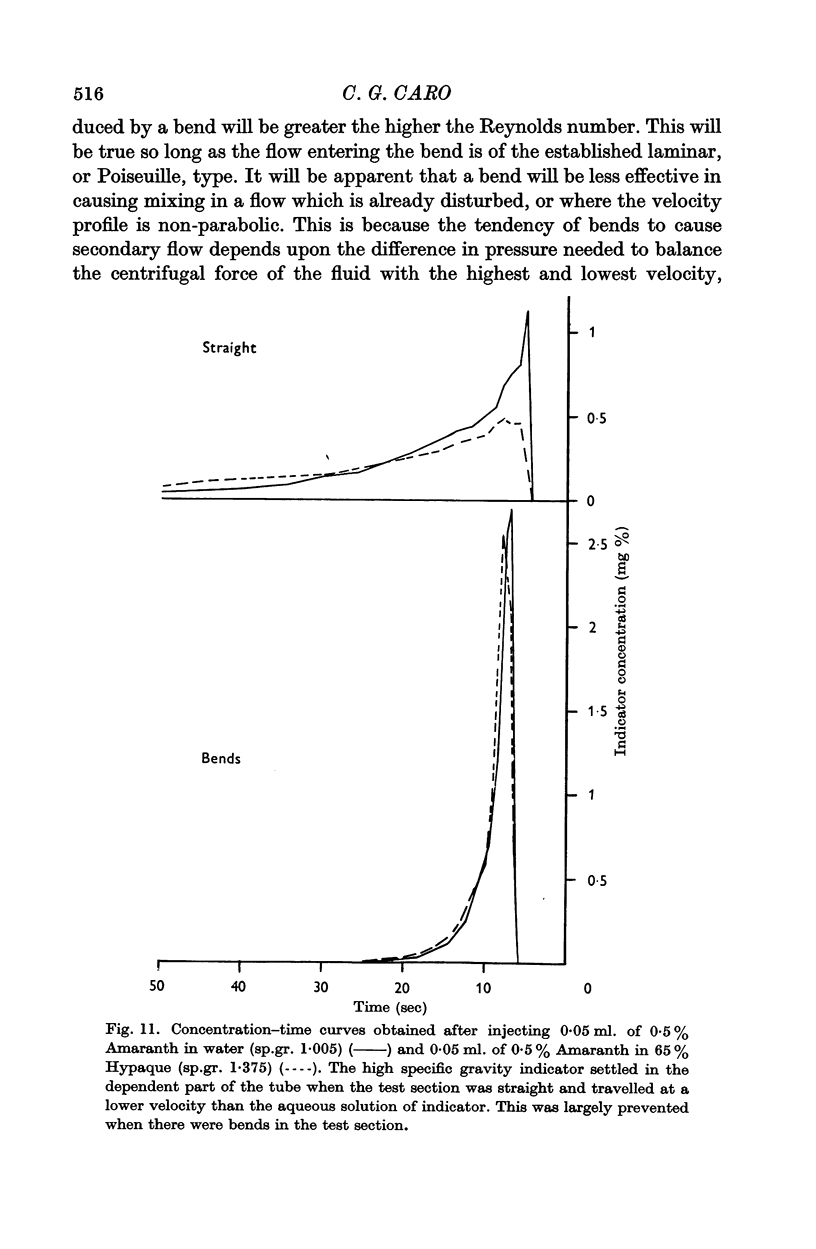
3. Bends gave rise to large secondary flows. These caused mixing across the flow and a marked reduction in the variation of velocity over the cross-section of the tube. The effect of bends on velocity distribution was maximal at a Reynolds number of ca. 1000. Similar, but far smaller, effects were seen in a region with an elliptical cross-section and when the flow was made pulsatile. Secondary motion due to bends was capable of preventing a heavier-than-water indicator (sp.gr. 1·375) from settling out of the flow.
4. The experimental findings suggest that there may be secondary flows in vascular beds. Under certain conditions, these would prevent the establishment of Poiseuille type laminar flow. The possible physiological importance of the findings is discussed.
Full text
PDF
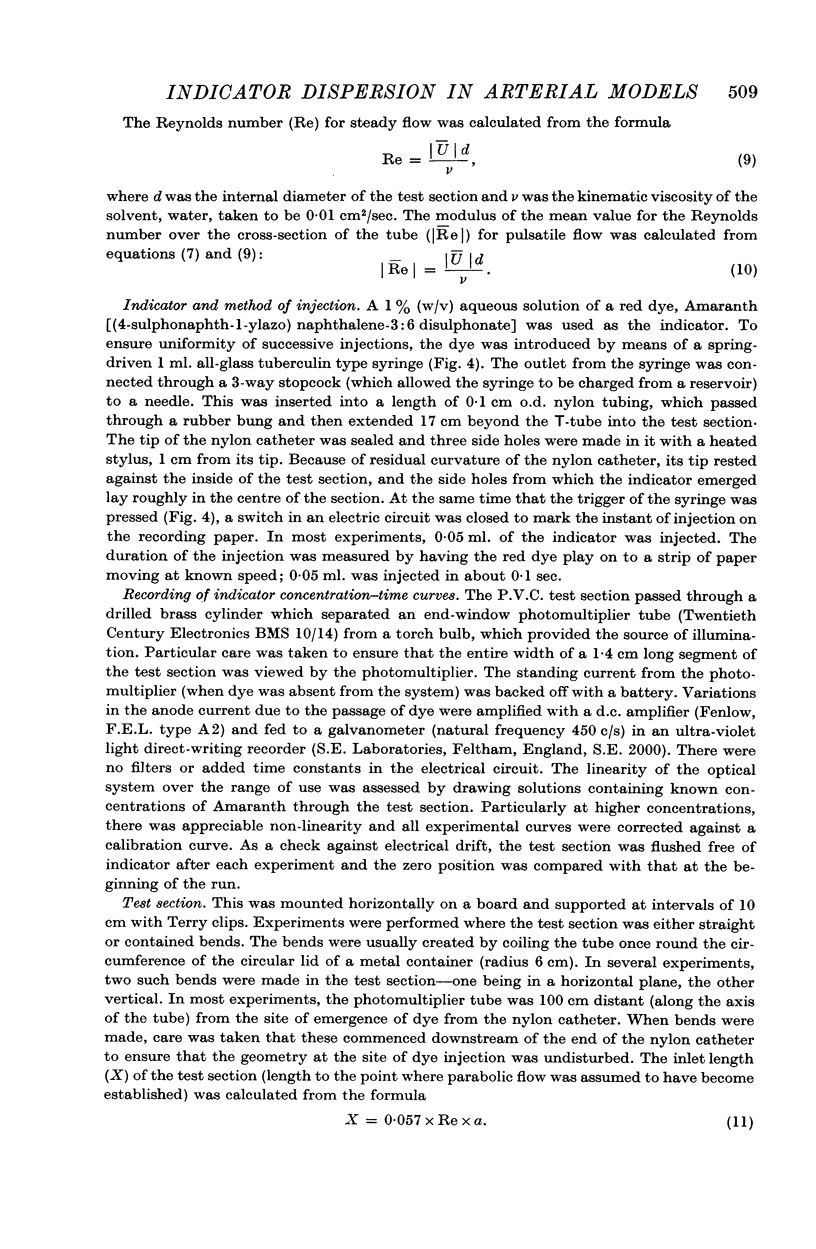
Selected References
These references are in PubMed. This may not be the complete list of references from this article.
- ANDRES R., ZIERLER K. L., ANDERSON H. M., STAINSBY W. N., CADER G., GHRAYYIB A. S., LILIENTHAL J. L., Jr Measurement of blood flow and volume in the forearm of man; with notes on the theory of indicator-dilution and on production of turbulence, hemolysis, and vasodilatation by intra-vascular injection. J Clin Invest. 1954 Apr;33(4):482–504. doi: 10.1172/JCI102919. [DOI] [PMC free article] [PubMed] [Google Scholar]
- HOFFMAN J. I., SHILLINGFORD J. P. Minor factors influencing indicator dilution curves. Clin Sci. 1957 Feb;16(1):1–10. [PubMed] [Google Scholar]
- KORNER P. I., SHILLINGFORD J. P. Further observations on the estimation of valvular incompetence from indicator dilution curves. Clin Sci. 1956 Aug;15(3):417–431. [PubMed] [Google Scholar]
- KORNER P. I., SHILLINGFORD J. P. The quantitative estimation of valvular incompetence by dye dilution curves. Clin Sci. 1955 Aug;14(3):553–573. [PubMed] [Google Scholar]
- MEIER P., ZIERLER K. L. On the theory of the indicator-dilution method for measurement of blood flow and volume. J Appl Physiol. 1954 Jun;6(12):731–744. doi: 10.1152/jappl.1954.6.12.731. [DOI] [PubMed] [Google Scholar]
- ROSSI H. H., POWERS S. H., DWORK B. Measurement of flow in straight tubes by means of the dilution technique. Am J Physiol. 1953 Apr;173(1):103–108. doi: 10.1152/ajplegacy.1953.173.1.103. [DOI] [PubMed] [Google Scholar]
- ZIERLER K. L. A simplified explanation of the theory of indicator-dilution for measurement of fluid flow and volume and other distributive phenomena. Bull Johns Hopkins Hosp. 1958 Oct;103(4):199–217. [PubMed] [Google Scholar]


