

Abstract
The blue light receptor NPH1 (for nonphototropic hypocotyl) has been considered to be the only UV-A/blue light receptor that induces a phototropic response by the hypocotyl and root of Arabidopsis. By analysis of root phototropism (rpt) mutants, we show, however, the involvement of another blue light receptor as well as the existence of two separate signaling pathways working downstream of these receptors in the phototropic response. A newly isolated gene, RPT2, controls one of these pathways. The RPT2 gene is light inducible; encodes a novel protein with putative phosphorylation sites, a nuclear localization signal, a BTB/POZ domain, and a coiled-coil domain; and belongs to a large gene family that includes the recently isolated NPH3 gene. From genetic, physiological, and biochemical evidence, we propose a genetic model of the signaling pathways that induce the phototropic response in Arabidopsis.
INTRODUCTION
Plant life is strongly dependent on the environment, and plants regulate their growth and development in response to many different environmental stimuli. One of these regulatory mechanisms is phototropism. Phototropism allows plants to change their growth direction in response to the location of the light source. Since the study of phototropism by Darwin (1880), many reports based on physiological studies have been published (reviewed in Briggs, 1963; Poff et al., 1994). Recently, genetic analysis of Arabidopsis has begun to shed light on the molecular mechanisms of phototropism.
Molecules involved in phototropism can be classified into three groups. The first includes a group of photoreceptors. In Arabidopsis, the phototropic response is induced by UV-A, blue, and green light (Liscum and Briggs, 1995), but plants do not respond to light having a wavelength above 560 nm, including red and far-red light (Steinitz et al., 1985). Recently, NPH1, a protein encoded at the NONPHOTOTROPIC HYPOCOTYL1 locus of Arabidopsis, was shown to be a 120-kD serine/threonine kinase and a UV-A/blue light receptor bound to a flavin chromophore (Huala et al., 1997; Christie et al., 1998). Because NPH1 is necessary for phototropism under all experimental conditions, it was considered to be the only photoreceptor capable of inducing phototropic curvature in Arabidopsis (Liscum and Briggs, 1995; Lascève et al., 1999).
On the other hand, the involvement of other blue light receptors, such as CRYPTOCHROME1 (CRY1) and CRY2, in phototropism were reported by Ahmad et al. (1998). These authors indicated that either CRY1 or CRY2 was necessary for first-positive phototropism in response to short irradiations at low fluences, but not for second-positive phototropism in response to long irradiations, and that they functioned upstream of NPH1. However, Lascève et al. (1999) indicated no relationship between CRY1 or CRY2 and phototropism, so this problem remains unresolved.
The second group of molecules involved in phototropism functions in the signaling pathway activated by photoreceptors, and the third participates in the action mechanisms that produce the curvature of plants after signals have been received. In the third group, the plant hormone auxin is believed to be an important player for differential growth responses of plants. This finding is based on the results of various physiological experiments (Briggs, 1963; Poff et al., 1994), but molecular and genetic analyses have supported the role of auxin in this response. For example, the nph4 mutant of Arabidopsis shows a defect in gravitropism of the hypocotyl in addition to a defect in phototropism (Liscum and Briggs, 1996). Recently, it has been reported that NPH4 is allelic with MASSUGU1 (MSG1; Stowe-Evans et al., 1998), which was identified as the locus affected in an auxin-insensitive mutant (Watahiki and Yamamoto, 1997), and with TRANSPORT INHIBITOR RESPONSE5 (TIR5), which was identified as the locus affected in a mutant exhibiting altered responses to auxin transport inhibitors (Ruegger et al., 1997). According to a genetic analysis performed by Watahiki et al. (1999), the auxin-action mechanisms involved in phototropism can be divided into two pathways: one is associated with NPH4/MSG1/TIR5, and the other is associated with AUXIN RESISTANCE1 (AXR1), which encodes the ubiquitin-activating enzyme E1 (Leyser et al., 1993). Determining how these pathways are regulated by light is an important goal.
The signaling pathways from photoreceptors to the action mechanisms that result in curvature have not been elucidated. In their in vitro biochemical analysis, Liscum and Briggs (1996) suggested that NPH2 and NPH3 operate downstream of the NPH1 receptor. Recently, the NPH3 gene was isolated and shown to encode an 82-kD protein having two protein–protein interaction domains, a BTB/POZ (for broad-complex, tramtrack, and bric-à-brac/poxvirus, zinc finger) domain (Albagli et al., 1995; Aravind and Koonin, 1999), and a coiled-coil domain (Lupas, 1996), and it interacts with NPH1 in vitro (Motchoulski and Liscum, 1999). Our group also has isolated three root phototropism mutants, rpt1, rpt2, and rpt3 (Okada and Shimura, 1992, 1994). In this study, we demonstrate that RPT1 is allelic to NPH1 and that RPT3 is allelic to NPH3. We have also isolated the RPT2 gene and found that it encodes a novel 66-kD protein, which belongs to a family that includes NPH3. We also discuss the complexity of the regulatory mechanisms that induce the phototropic response and the role of RPT2 function.
RESULTS
Genetic Analysis of rpt Loci
Roots of Arabidopsis respond to light negatively; that is, they grow away from the light source. Three mutants, rpt1-1, rpt2-1, and rpt3-1, which were generated by treatment with the mutagen ethyl methanesulfonate, were isolated in a screen for mutants that did not exhibit a root phototropic response (Okada and Shimura, 1992, 1994). To clarify the signaling pathways controlling phototropic responses, we examined the genetic character and phototropic response of the rpt mutants. An allelism test between the rpt and nph mutants revealed that at least four genes were involved in phototropic curvature, NPH1 (or RPT1), NPH3 (or RPT3), NPH4, and RPT2 (data not shown), although one of the nph mutants, nph2, was not examined in this test. Sequence analysis of the rpt1-1 (now renamed as nph1-101) mutant gene showed that it possessed a nonsense mutation at residue 120 (nucleotide sequence changed from TGG to TGA), suggesting that the nph1-101 mutation was null because it lacked both the LOV (for light, oxygen, or voltage) domains and the kinase domain. On the other hand, rpt3-1 (now renamed to nph3-101) had a nonsense mutation at residue 461 (nucleotide sequence changed from CAG to TAG).
Characterization of the Root and Hypocotyl Phototropism of nph1-101, rpt2-1, and nph3-101 Mutants
Our previous analysis of the nph1-101 mutant showed that the phototropic curvature of its root was abnormal but that that of the hypocotyl looked to be normal when illuminated by strong white light (50 μmol m−2 sec−1) from one side for 2 days (Okada and Shimura, 1992), although NPH1 was later reported to be the only photoreceptor to induce the phototropic response (Liscum and Briggs, 1995; Lascève et al., 1999). To examine the reason for this difference, we measured hypocotyl curvature and the angle of root growth against gravity of the rpt mutants in various fluences of blue light.
When illuminated by blue light from one side, the roots of the wild-type seedlings showed a negative phototropic response, and these angles against gravity increased as the fluence rates increased (Figure 1). The three rpt mutants, rpt1-1 (nph1-101), rpt2-1, and rpt3-1 (nph3-101), however, showed little or no phototropic response in the root at any fluence rate. This result is consistent with the previous studies of rpt mutants (Okada and Shimura, 1992, 1994). Thus, RPT1/NPH1, RPT2, and RPT3/NPH3 are all necessary for root phototropism in Arabidopsis.
Figure 1.

Root Phototropism in Arabidopsis Wild-Type Seedlings and in rpt Mutants.
Angles of root-growing direction against gravity (−χ°) were measured after 48 hr of exposure to blue light at the indicated fluence rates. Experiments were repeated independently three times, and the angles of root-growing direction of eight to 16 seedlings were measured each time. The average of degrees was calculated. Data and error bars represent the mean ±sd from the average values of the three repeated experiments. Wild type is Ler.
The hypocotyls of the wild-type seedlings also showed the positive phototropic response in a fluence rate–dependent manner, with curvature reaching a maximum at 10 μmol m−2 sec−1 not at 100 μmol m−2 sec−1 (Figure 2). The nph1-101 mutant showed no phototropic curvature in the hypocotyl at low fluence rates (0.01 and 0.1 μmol m−2 sec−1), as was observed in previous studies with the nph1 mutant (Liscum and Briggs, 1995). However, at a high fluence rate (10 and 100 μmol m−2 sec−1), the mutant hypocotyl showed an obviously positive phototropic response (Figure 2). Another severe nph1 mutant, nph1-5, also exhibited hypocotyl curvature following illumination by high fluence rate blue light (data not shown). These results strongly indicate that some other blue light receptor(s) in addition to NPH1 was involved in the signaling process that triggers hypocotyl curvature upon illumination by high fluence rate blue light. We examined the possibility that CRY1 is this second receptor, but it was not CRY1 because the nph1-101 hy4-2.23N double mutant showed a response similar to that of the nph1 mutant (Figure 2).
Figure 2.

Second-Positive Hypocotyl Phototropism in Etiolated Arabidopsis Wild-Type Seedlings and in Etiolated rpt Single and Double Mutants.
The curvature of hypocotyls (χ°) was measured after 12 hr of exposure to blue light at the indicated fluence rates. Experiments were repeated independently three times, and the curvatures of hypocotyls of eight to 15 seedlings were measured each time. The average of curvature degrees was calculated. Data and error bars represent the mean ±sd from the average values of the three repeated experiments. Wild type is Ler.
The nph3-101 mutant failed to show the hypocotyl curvature after illumination with weak or strong blue light, whereas the rpt2-1 mutant showed an interesting phototropic response profile (Figure 2). Phototropic curvature of the rpt2-1 mutant was induced by low fluence rate blue light, but the degree of curvature decreased as the fluence rate increased. These results suggested the presence of at least two distinct signaling pathways inducing hypocotyl curvature, one that is RPT2 dependent and the other that is RPT2 independent. The decrease in the degree of curvature suggests that the contribution of the RPT2-dependent pathway increased as the fluence rate increased. These results indicate that the profiles of root and hypocotyl phototropism are different in the nph1 and rpt2 mutants; thus, each mutant shows a partial deficiency in the phototropic response in the hypocotyl but no phototropic response in the root.
To obtain further insight into the apparently different roles of NPH1 and RPT2, we examined the characteristics of hypocotyl curvature of the nph1-101 rpt2-1 double mutant. Surprisingly, hypocotyl curvature of nph1-101 rpt2-1 was similar to that of the nph1-101 single mutant (Figure 2), and the double mutant did not exhibit an additive phenotype of the nph1 and the rpt2 single mutants. To reveal the interaction between NPH1 and RPT2, we examined it biochemically, as described below.
Blue Light–Induced Phosphorylation of a 120-kD Protein in Microsomal Membranes in the rpt2 Seedlings
It was reported that a kinase protein of ∼120 kD that was phosphorylated as a response to blue light could be detected in the microsomal membrane fraction of all monocot and dicot species examined, including Arabidopsis (Short and Briggs, 1994). This protein was not phosphorylated and was not expressed in the nph1 mutant (Liscum and Briggs, 1995). Furthermore, Huala et al. (1997) revealed that the NPH1 gene encodes a 120-kD serine/threoneine kinase. Thus, those results suggested that the 120-kD protein phosphorylated by blue light was NPH1 and that the phosphorylated form of NPH1 might be the active form that induces phototropism. We examined in vitro phosphorylation of the 120-kD protein in the rpt2 seedlings to assess the effect of RPT2 on the activation of NPH1 by blue light. As shown in Figure 3, phosphorylation of the 120-kD protein in both the wild-type and rpt2 mutant seedlings was observed. This result shows that the RPT2 locus is not required for the phosphorylation of the 120-kD protein, indicating that the RPT2 protein plays a role in the signaling pathway downstream of the NPH1 photoreceptor. The most likely explanation of NPH1 and RPT2 interaction is that NPH1 had some inhibitory effect on the RPT2-independent pathway under illumination with strong blue light. Possibly, the degree of hypocotyl curvature of the rtp2 single mutant might decrease as the fluence rate increases by the inhibitory effect of the NPH1 protein, and the nph1 mutation might work as a suppressor of the rpt2 mutation in the nph1 rpt2 double mutant under unilateral irradiation of blue light at high fluence rates.
Figure 3.

In Vitro Blue Light–Induced Phosphorylation of a 120-kD Protein in Microsomal Membranes.
Microsomal membranes (20 μg) prepared from 5-day-old etiolated wild-type Ler seedlings (WT) and rpt2-1 seedlings (rpt2) were irradiated by blue light, incubated with γ-32P-ATP, electrophoresed on an 8% SDS–polyacrylamide gel, and autoradiographed. D, mock-irradiated control; L, blue light–irradiated microsomal membrane fraction.
Cloning of RPT2
To understand the molecular nature of the RPT2 gene product, we determined its gene structure by using a map-based cloning procedure. The RPT2 gene was mapped to a small region of ∼20 kb between markers CZSOD2 and nga361 on chromosome 2 (Figure 4A). We sequenced the entire region of the rpt2-1 mutant, compared the sequence with that of the wild type, and found only one base change in the putative gene (Figure 4B). A full-length cDNA corresponding to the open reading frame was cloned from a cDNA library constructed from wild-type Arabidopsis Landsberg erecta (Ler) seedlings. Transgenic rpt2 mutants carrying genomic DNA fragments pBI-Bst1107I and pBI-PmaCI (Figure 4A), which covered its cDNA, recovered phototropic curvature in both root and hypocotyl tissues (Figures 5A and 5B). These results indicate that this gene is RPT2. The RPT2 coding sequence was determined by comparing sequences of four full-length cDNA clones with those of genomic DNA from the Ler ecotype.
Figure 4.

Map Position and Genomic Structure of the RPT2 Gene.
(A) Map position of the RPT2 gene. Numerals under vertical arrows indicate the number of recombinant chromosomes found in 1116 chromosomes of F2 progeny exhibiting the rpt2-1 mutant genotype. Horizontal arrows indicate genes predicted from sequencing and annotation by the TIGR group. Regions covered by restriction DNA fragments isolated from bacterial artificial chromosome (BAC) clone T6B20, which were cloned in the pBI101 binary vector for use in the complementation assay, are shown with thick lines. cM, centimorgan.
(B) Genome structure of the RPT2 gene. Black and white rectangles indicate the protein coding regions and noncoding regions, respectively. The cause of the rpt2-1 mutation was a base substitution from G to A at the splice acceptor site of the first intron. Nucleotides in the intron are shown in italic.
Figure 5.
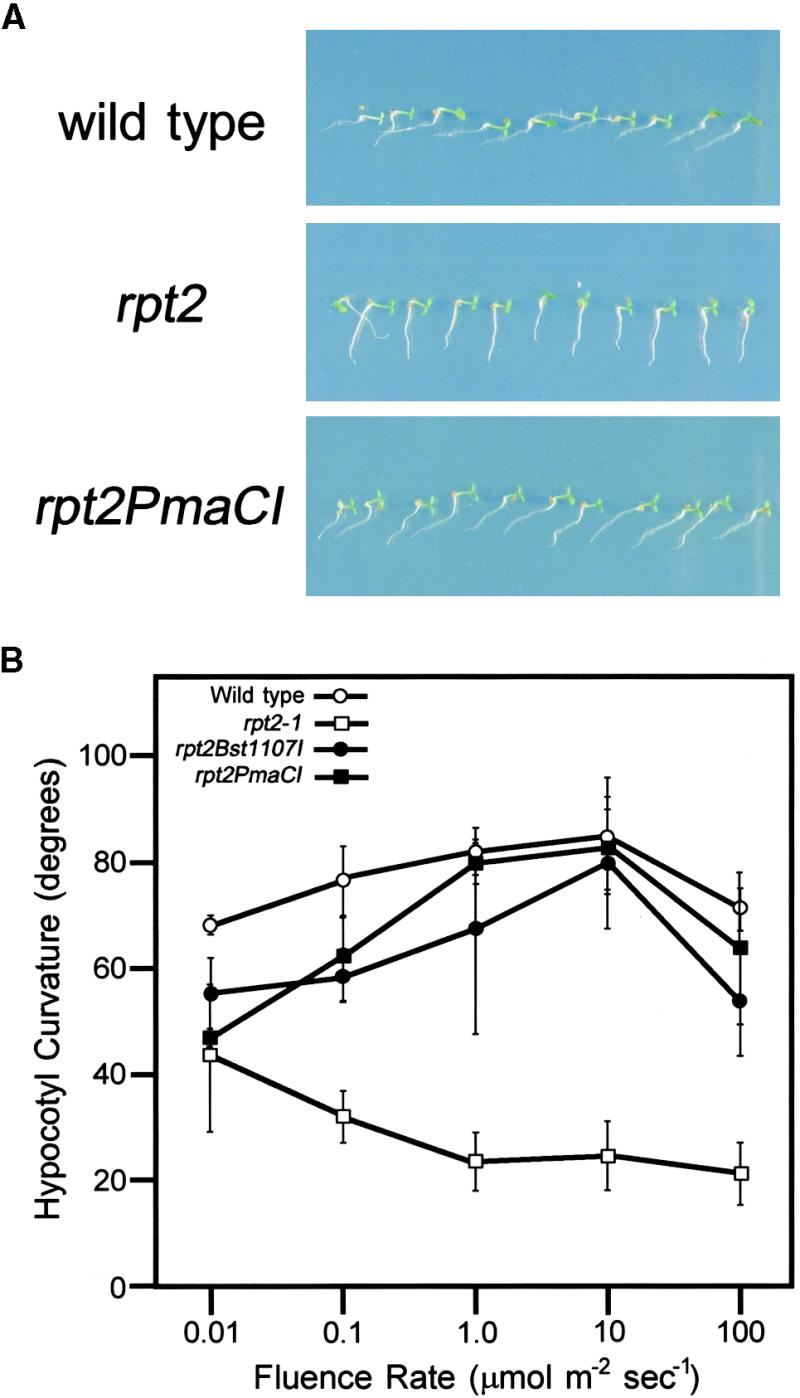
Complementation of the rpt2 Mutation in Transgenic Plants.
(A) Root phototropic response. Three-day-old seedlings were photographed after continuous irradiation of the right side. rpt2PmaCI shows the phototropic response of the rpt2 plant transformed with a pBI-PmaCI construct. Wild type is Ler.
(B) Hypocotyl phototropic response. The degree of curvature was measured as described in Figure 2. rpt2Bst1107I and rpt2PmaCI show the phototropic response of the rpt2 plant transformed with a pBI-Bst1107I and a pBI-PmaCI construct, respectively. Error bars represent the mean ±sd from the average values of the three repeated experiments. Wild type is Ler.
The RPT2 gene was found to encode a protein of 593 amino acid residues with a predicted molecular mass of 65.8 kD (Figure 6A). The gene is made of four exons, and the mutation in rpt2-1 is located at the splice acceptor site of the first intron, which caused a frameshift in the following exon (Figure 4B). Thus, rpt2-1 is likely to be a null allele. The RPT2 protein possesses a basic region, KPRRR, which is similar to a nuclear localization signal, at its C terminus, and >14 putative sites for phosphorylation by a serine/threonine kinase (Figure 6A). A search of the databases revealed that two regions of the RPT2 protein are similar to 12 hypothetical proteins found in the Arabidopsis genome. Interestingly, another phototropism-controlling protein, NPH3 (Motchoulski and Liscum, 1999), was found to be one of these similar proteins (Figures 6B and 6C). The function of the two related regions is not known, but it is likely that the RPT2/NPH3 family represents previously unrecognized types of signaling molecules in plant cells. Furthermore, several members of this family, including RPT2 and NPH3, have two domains associated with a protein–protein interaction, that is, a BTB/POZ domain at the N terminus (amino acid residues 32 to 128 of RPT2) and a coiled-coil domain at the C terminus (amino acid residues 500 to 530 of RPT2) of the protein.
Figure 6.

Nucleotide Sequence of the RPT2 cDNA and Amino Acid Sequences of the Conserved Regions Found in Members of a Gene Family That Includes RPT2 and NPH3.
(A) cDNA sequence and deduced amino acid sequence of RPT2 (GenBank accession number AF181683). An asterisk indicates the stop codon. Underlined and double-underlined regions show conserved regions I and II, respectively, as shown in (B) and (C). The last amino acid residue before the site of the frameshift mutation in the rpt2-1 mutant (position 24) and the putative new stop codon are shown in white-in-black boxes. The putative phosphorylation sites recognized by protein kinase A ([RK]-[RK]-x-[ST], where x can be any amino acid) and protein kinase C ([ST]-x-[RK]), whose kinase domains are similar to that of the NPH1 protein, are boxed.
(B) Alignment of amino acid sequences of RPT2, NPH3, and the other predicted genes of Arabidopsis at regions I and II. Amino acid residues identical to those of RPT2 are shown in white-in-black boxes. Numbers shown in RPT2 and NPH3 are amino acid residue numbers. Other putative genes are designated by the BAC or P1 clone from which the genes were predicted. Numbers are nucleotide numbers registered in GenBank. Percentages of amino acid identity between deduced amino acid sequence of each gene and that of RPT2 are shown in parentheses.
(C) Structure of RPT2 and NPH3 proteins. Boxes I and II indicate conserved regions I and II, respectively, as shown in (B).
RNA Gel Blot Analysis of RPT2 Expression
Phototropism of plants is determined by the difference in cell extension between the side irradiated by the light and the shaded side. One hypothetical mechanism to generate this difference would be a different regulation of light-responsive genes on each side. By using RNA gel blot analysis, we observed the effects of irradiation on the expression of RPT2 by using various light stimuli. Under irradiation with white, blue, green, or red light for 4 or 24 hr, the RPT2 gene was induced by all wavelengths (Figure 7A). Thus, as a regulator of phototropism, RPT2 was found to be a light-inducible gene. Furthermore, under irradiation with blue light, the expression of the RPT2 gene increased as the fluence rate increased (Figure 7B). These results indicate that the RPT2 expression depends on the fluence rate but not on the light quality.
Figure 7.

RNA Gel Blot Analysis of RPT2 Gene Expression.
Etiolated seedlings were irradiated with various types of light before preparation of total RNA. RNA gel blot hybridization was performed with the 32P-radiolabeled RPT2 cDNA and 18S rDNA as probes against 5 μg of total RNA.
(A) Independent expression of the RPT2 gene with respect to light quality. Lanes 1 and 2, mock-irradiated control (kept in the dark) for 4 and 24 hr, respectively; lanes 3 and 4, irradiated by white light for 4 and 24 hr, respectively; lanes 5 and 6, irradiated by blue light for 4 and 24 hr, respectively; lanes 7 and 8, irradiated by green light for 4 and 24 hr, respectively; and lanes 9 and 10, irradiated by red light for 4 and 24 hr, respectively. The graph shows the relative abundance of RPT2 mRNA under various light conditions. The value was calculated relative to that of the sample mock irradiated for 4 hr (lane 1) after normalization versus the 18S rRNA signal.
(B) Dependence of expression of the RPT2 gene on fluence rate. Lanes 1 to 6, irradiated by blue light for 4 hr at the fluence rate of 0, 0.01, 0.1, 1, 10, and 100 μmol m−2 sec−1, respectively. The graph shows the relative abundance of RPT2 mRNA under various fluence rates. The value was calculated against mock irradiation (lane 1) after normalization by the 18S rRNA.
DISCUSSION
On the basis of genetic, physiological, and biochemical observations to date, a model of signaling pathways controlling the phototropic curvature of the hypocotyl can be presented (Figure 8). NPH1 is the only photoreceptor to induce the phototropic response at low fluence rates of blue light. However, we found that a second photoreceptor, in addition to NPH1, is involved in phototropism at high fluence rates. The RPT2 protein, as well as the NPH3 protein, had no effect on the phosphorylation of NPH1 by blue light, meaning that RPT2 and NPH3 play roles as modulators of the signal from phototropic blue light receptors. Our physiological analysis and previous report indicate that the nph3 mutant exhibited little or no phototropic response under any light condition. Furthermore, NPH3 showed direct interaction with NPH1 in vitro (Motchoulski and Liscum, 1999); therefore, it may be a common signal transducer associated with photoreceptors and from which two separate signaling pathways, the RPT2-dependent and the RPT2-independent pathways, may branch off. Because the protein structure of RPT2 is similar to that of NPH3, RPT2 may possibly associate with NPH1 directly or indirectly by using NPH3 as a scaffold and thereby transfer signals for the phototropic response.
Figure 8.

Models of the Signaling Pathways of the Phototropic Response in Hypocotyls of Arabidopsis Seedlings.
The pathway marked by an asterisk indicates the inhibitory effect of NPH1 to the RPT2-independent pathway by adaptation or unknown mechanisms at high fluence rates. See the text for more details.
Adaptation of the Phototropic Response
In this report, we showed the complexity of the hypocotyl phototropic response of the rpt2 single mutant and nph1 rpt2 double mutant. From these results, the activity of the RPT2-independent pathway seemed to be inhibited by NPH1 at a higher fluence rate than 1 μmol m−2 sec−1 (Figure 8). The effector adaptation already known in photobiology is one possibility for the inhibitory mechanism (Galland, 1991; Poff et al., 1994). Thus, the ability of the RPT2-independent pathway to transduce the signal might be saturated under the high fluence rates of blue light; therefore, the signal level between the irradiated side of the hypocotyl and the shadow side would become similar, and thus, the degree of curvature of the rpt2 mutant would decrease as the fluence rate increased. In the nph1 rpt2 mutant, the ability of the RPT2-independent pathway might suffice to transduce the signal from the second photoreceptor, resulting in a curvature similar to that observed in the nph1 single mutant.
The investigation of photosensory adaptation is very important, because it reveals the light recognition mechanisms not only in Arabidopsis but also in all light-sensing organisms (Galland, 1991). In this study, we observed the limits of the fluence rate of the blue light to induce the phototropic curvature in the hypocotyls of wild-type etiolated seedlings; thus, the hypocotyl curvatures in the wild type at the fluence rate of 10 μmol m−2 sec−1 decreased at the rate of 100 μmol m−2 sec−1. The finding that the degree of curvature in the nph1 mutant increased from the fluence rate of 10 μmol m−2 sec−1 to that of 100 μmol m−2 sec−1 suggests that the ability of the second photoreceptor to transduce the signal is not saturated at the fluence rate of 100 μmol m−2 sec−1. Thus, the decrease in phototropic curvature of wild-type seedlings at the fluence rate of 100 μmol m−2 sec−1 may be caused by effector adaptation but not by receptor adaptation. It is important to consider the expression level of the RPT2 gene because there is a possibility that its expression level is a restriction point to cause effector adaptation. We are examining the relationship between effector adaptation during second-positive phototropism and the expression level of the RPT2 gene by using transgenic plants expressing RPT2 at various levels.
Light Inducibility of the RPT2 Gene
We showed that RPT2 is induced by white, blue, and green light, which are responsible for the phototropic response in the hypocotyl and root, as well as by red light, which is not directly related to phototropism. Therefore, the expression level of RPT2 would not directly correlate with the strength of the phototropic curvature; rather, RPT2 might provide the capacity to transduce the signal of the phototropic response. In a preliminary experiment, we knew that transgenic plants constitutively expressing the RPT2 gene under control of the cauliflower mosic virus 35S promoter show a normal phototropic response (data not shown). It has been suggested that the difference in the expression level of the RPT2 gene at the illuminated side and at the nonilluminated side of the root or hypocotyl might not be the cause of the differential growth.
Mechanisms Inducing Phototropic Curvature in Tissues of Hypocotyls and Roots
Our previous report suggested that the mechanism that induces phototropic curvature in the root is different from that operating in hypocotyl tissue because the hypocotyl phototropism of rpt1 (nph1) and rpt2 mutants appeared to be normal even though their root phototropism was deficient under irradiation with white light (Okada and Shimura, 1992). From the results in this study, however, we found that all rpt mutants had deficiencies in hypocotyl phototropism, and we conclude that a common photosensory mechanism, including NPH1, RPT2, and NPH3 to induce the phototropic response, is active in both tissues. One reason why the roots of the rpt1 (nph1) and rpt2 mutants show a more severe phenotype than do the hypocotyls may be the difference of effects on gravity for each tissues. Positive gravitropism competes with negative phototropism in the root, but positive phototropism dominates negative gravitropism in the hypocotyls (Okada and Shimura, 1994). Because of competition with gravity, the root may require plural pathways in addition to those including NPH1 and RPT2 to induce the phototropic response, although we cannot deny another possibility—that the second receptor and RPT2-independent pathway do not work in the root. This conclusion gives rise to new questions. Why isn't the phototropic response in the root of wild-type seedling saturated by blue light at the fluence rate of 100 μmol m−2 sec−1? How can negative phototropism be generated in roots and positive phototropism in hypocotyls via the same photosensory mechanism? What is different to generate the different effects between the root and hypocotyl on the tropic response to light and gravity? Further analyses are required to understand how the curvature of plants is regulated by photosensory mechanisms.
A Second Photoreceptor Inducing the Phototropic Response
Several photoreceptors are candidates as the second photoreceptor to induce phototropism. We indicated that the first candidate, CRY1, was not the second receptor. CRY2 is degraded by blue light (Lin et al., 1998); therefore, it probably could not serve as the second photoreceptor at a high fluence rate of blue light. Phytochromes also can absorb blue light, but red and far-red light–activating phytochromes cannot induce the phototropic response in Arabidopsis. Therefore, we measured the phototropic curvature of the nph1-101 hy1-1 double mutant to examine whether phytochromes are involved in phototropism; however, the curvature was similar to that of the nph1 single mutant (data not shown). Thus, a phytochrome chromophore is not involved in the phototropism because the hy1 mutant fails to make the phytochrome-chromophore phytochromobilin (Koornneef et al., 1980; Davis et al., 1999). Jarillo et al. (1998) reported the isolation of an NPH1-related gene, NPL1. Like NPH1, NPL1 also possesses LOV domains and a kinase domain like NPH1. We isolated a knockout Arabidopsis mutant of this gene in T-DNA–tagged lines and examined its phototropic curvature. In this single mutant, we could not determine any deficiency in the phototropic response in the root or hypocotyl (data not shown). Therefore, we used this mutant to make a double mutant with nph1 to examine the phototropic response. We have also attempted to isolate enhancer mutants of phenotype of the nph1 mutant.
Plant Proteins Possessing the BTB/POZ Domain
BTB/POZ domains are found in a variety of proteins involved in transcriptional regulation, cytoskeletal organization, and development and in the tetramerization domain of potassium channels (Albagli et al., 1995; Aravind and Koonin, 1999). By biochemical analyses, these domains show an ability to interact with other proteins and to make homo- or heterodimers (Bardwell and Treisman, 1994; Igarashi et al., 1998). Furthermore, in most cases, the BTB/POZ domain-containing protein possesses another domain, for example, zinc finger domains, b-ZIP domains, the kelch repeats, MATH domains, or ankyrin repeats (Aravind and Koonin, 1999). In plants, only one protein, NPR-1 of Arabidopsis—a major regulator of the response to pathogens (Cao et al., 1997)—has been reported to contain the BTB/POZ domain with ankyrin repeats. Recently, NPR-1 was shown to exhibit protein–protein interactions with b-ZIP transcriptional regulators (Zhang et al., 1999) and a nuclear protein, SNI (Li et al., 1999), and was suggested to be a key regulator of transcription to induce systemic acquired resistance. In this report, we showed that RPT2 as well as the recently isolated gene NPH3, both of which participate in regulating the phototropic response, possess a BTB/POZ domain and a coiled-coil domain. The combination of these motifs has not been reported in other organisms, but several members of the RPT2/NPH3 gene family in plants include these structures. It is not known what kinds of proteins interact with RPT2, but there is a strong possibility that RPT2 interacts with its similar protein, NPH3, and that it also interacts with transcriptional factors such as NPR-1, because many proteins encoding BTB/POZ domain interact with transcriptional factors.
In this study, we have revealed the role of RPT2 in second-positive phototropism. A future study will examine the role of RPT2 in first-positive phototropism. In first-positive phototropism of hypocotyl, initial irradiation of blue light can induce desensitization and, after a short interval (1 to 10 min), curvature enhancement by ensuing blue light irradiation (Janoudi and Poff, 1991, 1992, 1993; Poff et al., 1994). Red light, via phytochrome, also can induce enhancement but not desensitization. Thus, initial irradiation with blue or red light can give some competence for susceptibility to subsequent irradiation with blue light. There is one possibility that the light inducibility of RPT2 contributes the competence, and it is worthwhile to examine the pre-irradiation effect of blue and red light to the rpt2 mutant with observation of the first-positive phototropism.
METHODS
Plant Materials, Growth Conditions, and Light Sources
Strains of the root phototropism mutants rpt1-1 (nph1-101), rpt2-1, and rpt3-1 (nph3-101), were isolated from ethyl methanesulfonate–mutagenized seeds of the Arabidopsis thaliana Landsberg erecta (Ler) ecotype (Okada and Shimura, 1992, 1994). hy1-1 and hy4-2.23N (hy4-1) mutants were provided by the Arabidopsis Biological Resource Center (ABRC; Columbus, OH; http://aims.cps.msu.edu/aims). The knockout line of NPL1 gene was isolated from the pool of Arabidopsis T-DNA–tagged lines of the Kazusa DNA Research Institute (Kisarazu, Chiba, Japan). For all experiments, seeds were surface-sterilized and planted in square Petri dishes containing 1.5% agar medium, as described previously (Okada and Shimura, 1992). Seeds were kept in a cold room at 4°C for 3 days and then were exposed to white light for 24 hr to induce uniform germination. After germination was induced, the Petri dishes were incubated vertically to let the seedlings grow on the surface of agar, at 21 to 22°C under various light conditions, depending on the experiment.
To measure the angle of root-growing direction against gravity and in response to unilateral light, we irradiated germinating seeds for 48 hr with blue light by using light-emitting diode (LED) blue light lamps with a maximum wavelength of 470 nm and a 30-nm half bandwidth (LED-mB; Eyela, Tokyo). To measure the phototropic curvature of hypocotyls, we irradiated 3-day-old etiolated seedlings for 12 hr with blue light by using LED blue light lamps. The fluence rate was controlled by filters (film No. 72; Tokyo Butai Shoumei, Tokyo). After irradiation, photographs of the Petri dishes were taken.
For the seedlings for the RNA gel blot analysis using various light qualities, white light was provided by a white fluorescent lamp (model FL20SSW/18; National, Tokyo) at the fluence rate of 50 μmol m−2 sec−1. Blue light was provided by a blue fluorescent lamp (model FL20S-B; Toshiba, Tokyo) with film No. 72 (Tokyo Butai Shoumei) at 5 μmol m−2 sec−1. Green light was provided by a green fluorescent lamp (model FL20S-G; National) with film No. 52 (Tokyo Butai Shoumei) at 5 μmol m−2 sec−1. Red light was obtained with a red fluorescent lamp (model FL20S-BRF; Toshiba) with an acryl-board (model Acrylight S-102; Mitsubishi Rayon, Tokyo) at 25 μmol m−2 sec−1. LED blue light lamps were used for the analyses using various fluence rates of blue light.
In Vitro Phosphorylation Assay
In vitro phosphorylation assay of the 120-kD protein in microsomal membranes was performed as described by Liscum and Briggs (1995), with some modifications. Approximately 100 4-day-old etiolated seedlings were harvested from agar medium with forceps. The seedlings were ground with a mortar and pestle in 100 μL of homogenization buffer (25 mM Mops, pH 7.8, 250 mM sucrose, 0.1 mM MgCl, 8 mM l-cysteine, 5 mM aminocaproic acid, and 1 mM benzamidine) and mixed with 900 μL of homogenization buffer. Crude microsomal membranes were isolated by centrifugation at 8100g for 10 min followed by centrifugation of the supernatant at 100,000g for 75 min. The microsomal pellet from the high-speed centrifugation then was resuspended in 50 μL of phosphorylation buffer (37.5 mM Tris-Mes, pH 7.5, 5 mM MgSO4, 150 mM NaCl, 1 mM EGTA, 1 mM DTT, 5 mM aminocaproic acid, 1 mM benzamidine, 1 μg mL−1 leupeptine, and 1 μg mL−1 antipain) by pipetting and was mixed with 2.5 μL of 10% Triton X-100. All manipulations were performed at 4°C under dim red safelight.
Twenty micrograms of the microsomal extract was diluted to a final volume of 9 μL in phosphorylation buffer. The membrane extracts were allowed to pre-equilibrate for ∼30 sec at 30°C and irradiated at a total fluence of 1320 μmol m−2 of blue light (2 min at a fluence rate of 11 μmol m−2 sec−1). Dark control samples were mock irradiated. After irradiation, γ-32P-ATP was added to the samples to a final concentration of 200 μM (specific activity, 2.5 Ci/mmol). The samples were incubated at 30°C for 2 min and then mixed with 10 μL of 2 × SDS gel loading buffer (125 mM Tris-HCl, pH 6.8, 20% glycerol, 4% SDS, 10% β-mercaptoethanol, and 0.01% bromophenol blue) to stop the reaction. Entire samples were electrophoresed on an 8% SDS–polyacrylamide gel. Gels then were autoradiographed by apposition to x-ray film (BioMax MS film; Eastman Kodak).
Positional Cloning
A mapping population segregating for polymorphic chromosomal markers in the Ler and Columbia (Col) ecotypes was generated by self-pollination of F1 plants derived from a cross between homozygous rpt2-1 plants (Ler) and wild-type Col plants. Genomic DNA was isolated from individual F2 plants that were defective in root phototropism as described (Ausbel et al., 1987) and examined for polymorphism by use of several DNA markers. To make new DNA markers at a suitable genomic DNA region, we made polymerase chain reaction (PCR) primers according to the nucleotide sequence of the Col ecotype sequenced by the TIGR group (Institute for Genomic Reserch, Rockville, MD; http://www.tigr.org) and amplified as ∼1-kb genomic DNA regions. Then we direct-sequenced these regions and searched for polymorphisms between Ler and Col ecotypes. Based on these polymorphisms, the PCR primers were used as cleaved amplified polymorphic sequence markers (Konieczny and Ausubel, 1993), simple sequence length polymorphism markers (Tautz, 1989), or direct-sequencing primers.
To make the plasmid constructs shown in Figure 4A, we obtained the T6B20 bacterial artificial chromosome (BAC) clone from ABRC, and its DNA was prepared by using a plasmid isolation kit (plasmid midi kit; Qiagen, Tokyo). BAC DNA then was digested with Bst1107I or PmaCI restriction enzymes, and target segments were isolated from agarose gel with a QIAquick gel extraction kit (Qiagen) after electrophoresis; these were cloned in a pBI101-modified binary vector that had an entire multiple cloning site of pUC18 rather than the β-glucuronidase gene and nopaline synthase terminator. pBI-Bst1107I and pBI-PmaCI were inserted into the SmaI site of the multiple cloning site as ∼11- and 7-kb segments, respectively, obtained by digestion with Bst1107I and PmaCI, respectively.
pBI binary vectors carrying individual genomic DNA segments were used for transformation of Agrobacterium tumefaciens pGV2260 by electroporation and used for subsequent vacuum infiltration of rpt2-1 plants (Bechtold et al., 1993). Transgenic plants were selected on Murashige and Skoog medium (Wako Chemicals, Osaka, Japan) containing 50 mg L−1 of kanamycin. The phototropic responses of root and hypocotyls of T2 generation plants were observed to determine complementation. One transgenic line transformed with pBI-Bst1107I and three lines transformed with pBI-PmaCI showed the complementation of the rpt2 mutation.
cDNA Isolation
Protocols to isolate the cDNA of the RPT2 gene with a cDNA isolation kit (GeneTrapper cDNA positive selection system; Life Technologies, Tokyo) were followed. Pure double-stranded DNA was prepared from a phagemid cDNA library generated from a λ ZAPII library by in vivo excision. The double-stranded DNA was converted to single-stranded DNA by using gene II endonuclease and exonuclease III. An oligonucleotide (5′-CCGGTTCTTGCAAGACTTGA-3′) complementary to a segment of the predicted first exon of the RPT2 gene was biotinylated at the 3′ end with biotin-14-dCTP by terminal deoxynucleotidyl transferase. Hybrids between the biotinylated oligonucleotide and single-stranded DNA were formed in solution and then captured on streptavidin-coated paramagnetic beads. After washing the beads four times, the captured single-stranded DNA target was released from the biotinylated oligonucleotide that had remained attached to the paramagnetic beads. After release, the desired cDNA was further enriched by use of a nonbiotinylated target oligonucleotide to specifically prime convert the recovered single-stranded DNA target to double-stranded DNA. After transformation and plating of Escherichia coli, ∼44% of the colonies represented the cDNA clones of the RPT2 gene. Seventeen of 21 isolated clones carried a cDNA of the same length, ∼1.9 kb, and the other clones had two different cDNAs or cDNA shorter than 1.9 kb. The length of 1.9 kb is similar to the predicted mRNA length obtained by RNA gel blot analysis of the RPT2 gene. Four clones were sequenced and compared with genomic DNA of the Ler ecotype; the RPT2 sequence then was determined. All of these sequences started at −4 to −15 sites from the predicted translation start site. For the sequences of the rpt1-1, rpt2-1, and rpt3-1 alleles, cDNA sequences also were checked by reverse transcription–PCR (RT-PCR) and subsequent direct sequencing, in addition to the sequencing of genomic DNA.
To analyze the structure of the RPT2 protein, we used MOTIF computer software (http://www.motif.genome.ad.jp) for prediction of phosphorylation sites, SMART (http://coot.embl-heidelberg.de/SMART) for prediction of the BTB/POZ domain, and COILS (http://www.ch.embnet.org/software/COILS_form.html) for that of the coiled-coil domain.
PCR, RT-PCR, and Sequencing
AmpliTaq DNA polymerase (Perkin-Elmer, Branchburg, NJ) was used for a simple PCR technique. Pyrobest DNA polymerase (TaKaRa, Tokyo) was used to prepare a template for the direct sequencing. Superscript II RNase H− reverse transcriptase (Life Technologies, Tokyo) was used for the RT-PCR reaction to the sequencing analysis. Sequencing reactions were performed with BigDye terminator cycle sequencing kit (Perkin Elmer), and reaction samples were sequenced with an ABI Prism 377 or ABI Prism 310 DNA sequencer (Perkin-Elmer).
RNA Gel Blot Analysis
For RNA gel blot analysis using various light qualities, 4-day-old etiolated seedlings were treated under mock (dark) conditions and with white, blue, green, or red light for 4 or 24 hr before being frozen in liquid nitrogen. For analysis using various light quantities, 3-day-old etiolated seedlings were treated with blue light at the various fluence rates shown in Figures 6A and 6B for 4 hr. Total RNA was isolated from the frozen seedlings with a total RNA isolation kit (RNeasy; Qiagen). The RNA was loaded onto a denaturing agarose gel, electrophoresed, transferred to a nylon membrane (Biodyne B membrane; Pall, Port Washington, NY), and hybridized with radioactive, random-primed DNA prepared with the cDNA of the RPT2 gene used as a template. To confirm the amounts of RNA in each lane, we also hybridized a DNA probe complementary to rRNA with the membrane. X-ray films (BioMax MS film; Eastman Kodak) were used to visualize the hybridization signals from each probe. To measure mRNA abundance from the x-ray films, we used National Institutes of Health imaging software.
Acknowledgments
We thank Dr. Emmanuel Liscum for providing seeds of the nph1, nph3, and nph4 mutants and for providing information about NPH3 analysis; the Arabidopsis Biological Resource Center for providing seeds for the mutants and the T6B20 BAC clone; Kazusa DNA Research Institute for the isolation of T-DNA–tagged line; and our colleagues in our laboratory for discussion of the functions of RPT2. This work was supported by grants (Nos. 06278103 and 10182101) from the program Grants-in-Aid for Scientific Research on Priority Areas of the Japanese Ministry of Education, Science, Culture, and Sports and by funds from the Japan Society for the Promotion of Science to T.S. as a research fellow, the Human Frontier Science Program, the Mitsubishi Foundation, and the Joint Studies Program for Advanced Studies of the Science and Technology Agency of Japan.
References
- Albagli, O., Dhordain, P., Deweindt, C., Lecocq, G., and Leprince, D. (1995). The BTB/POZ domain: A new protein–protein interaction motif common to DNA- and actin-binding proteins. Cell Growth Differ. 6 1193–1198. [PubMed] [Google Scholar]
- Ahmad, M., Jarillo, J.A., Smirnova, O., and Cashmore, A.R. (1998). Cryptochrome blue-light photoreceptors of Arabidopsis implicated in phototropism. Nature 392 720–723. [DOI] [PubMed] [Google Scholar]
- Aravind, L., and Koonin, E.V. (1999). Fold prediction and evolutionary analysis of the POZ domain: Structural and evolutionary relationship with the potassium channel tetramerization domain. J. Mol. Biol. 285 1353–1361. [DOI] [PubMed] [Google Scholar]
- Ausbel, F.M., Brent, R., Kingston, R.E., Moore, D.D., Seidman, J.A., and Struhl, K., eds (1987). Current Protocols in Molecular Biology. (New York: Greene Publishing Associates).
- Bardwell, V.J., and Treisman, R. (1994). The POZ domain: A conserved protein–protein interaction motif. Genes Dev. 8 1664–1677. [DOI] [PubMed] [Google Scholar]
- Bechtold, N., Ellis, J., and Pelletier, G. (1993). In planta Agrobacterium mediated gene transfer by infiltration of adult Arabidopsis plants. C. R. Acad. Sci. Ser. III Sci. Vie 316 1194–1199. [Google Scholar]
- Briggs, W.R. (1963). The phototropic responses of higher plants. Annu. Rev. Plant Physiol. 14 311–352. [Google Scholar]
- Cao, H., Glazebrook, J., Clarke, J.D., Volko, S., and Dong, X. (1997). The Arabidopsis NPR1 gene that controls systemic acquired resistance encodes a novel protein containing ankyrin repeats. Cell 88 57–63. [DOI] [PubMed] [Google Scholar]
- Christie, J.M., Reymond, P., Powell, G.K., Bernasconi, P., Raibekas, A.A., Liscum, E., and Briggs, W.R. (1998). Arabidopsis NPH1: A flavoprotein with the properties of a photoreceptor for phototropism. Science 282 1698–1701. [DOI] [PubMed] [Google Scholar]
- Darwin, C. (1880). The Power of Movement in Plants. (London: John Murray).
- Davis, S.J., Kurepa, J., and Vierstra, R.D. (1999). The Arabidopsis thaliana HY1 locus, required for phytochrome-chromophore biosynthesis, encodes a protein related to heme oxygenases. Proc. Natl. Acad. Sci. USA 96 6541–6546. [DOI] [PMC free article] [PubMed] [Google Scholar]
- Galland, P. (1991). Photosensory adaptation in aneural organisms. Photochem. Photobiol. 54 1119–1134. [Google Scholar]
- Huala, E., Oeller, P.W., Liscum, E., Han, I.-S., Larsen, E., and Briggs, W.R. (1997). Arabidopsis NPH1: A protein kinase with a putative redux-sensing domain. Science 278 2120–2123. [DOI] [PubMed] [Google Scholar]
- Igarashi, K., Hoshino, H., Muto, A., Suwabe, N., Nishikawa, S., Nakauchi, H., and Yamamoto, M. (1998). Multivalent DNA binding complex generated by small Maf and Bach1 as a possible biochemical basis for beta-globin locus control region complex. J. Biol. Chem. 273 11783–11790. [DOI] [PubMed] [Google Scholar]
- Janoudi, A.K., and Poff, K.L. (1991). Characterization of adaptation in phototropism of Arabidopsis thaliana. Plant Physiol. 95 517–521. [DOI] [PMC free article] [PubMed] [Google Scholar]
- Janoudi, A.K., and Poff, K.L. (1992). Action spectrum for enhancement of phototropism by Arabidopsis thaliana seedlings. Photochem. Photobiol. 56 655–659. [Google Scholar]
- Janoudi, A.K., and Poff, K.L. (1993). Desensitization and recovery of phototropic responsiveness in Arabidopsis thaliana. Plant Physiol. 101 1175–1180. [DOI] [PMC free article] [PubMed] [Google Scholar]
- Jarillo, J.A., Ahmad, M., and Cashmore, A.R. (1998). NPH2: A second member of the NPH serine/threonine kinase family of Arabidopsis. Plant Physiol. 117 719. [Google Scholar]
- Konieczny, A., and Ausubel, F.M. (1993). A procedure for mapping Arabidopsis mutations using co-dominant ecotype-specific PCR-based markers. Plant J. 4 403–410. [DOI] [PubMed] [Google Scholar]
- Koornneef, M., Rolff, E., and Spruit, C.J.P. (1980). Genetic control of light-induced hypocotyl elongation in Arabidopsis thaliana L. Heynp. Z. Pflanzenphysiol. 100 147–160. [Google Scholar]
- Lascève, G., Leymarie, J., Olney, M.A., Liscum, E., Christie, J.M., Vavasseur, A., and Briggs, W.R. (1999). Arabidopsis contains at least four independent blue-light-activated signal transduction pathways. Plant Physiol. 120 605–614. [DOI] [PMC free article] [PubMed] [Google Scholar]
- Leyser, H.M.O., Lincoln, C.A., Timpte, C., Lammer, D., Turner, J., and Estelle, M. (1993). Arabidopsis auxin-resistance gene AXR1 encodes a protein related to ubiquitin-activating enzyme E1. Nature 364 161–164. [DOI] [PubMed] [Google Scholar]
- Li, X., Zhang, Y., Clarke, J.D., Li, Y., and Dong, X. (1999). Identification and cloning of a negative regulator of systemic acquired resistance, SNI1, through a screen for suppressors of npr1-1. Cell 98 329–339. [DOI] [PubMed] [Google Scholar]
- Lin, C., Yang, H., Gua, H., Mockler, T., Chen, J., and Cashmore, A. (1998). Enhancement of blue-light sensitivity of Arabidopsis seedlings by a blue light receptor cryptochrome 2. Proc. Natl. Acad. Sci. USA 95 2686–2690. [DOI] [PMC free article] [PubMed] [Google Scholar]
- Liscum, E., and Briggs, W.R. (1995). Mutations in the NPH1 locus of Arabidopsis disrupt the perception of phototropic stimuli. Plant Cell 7 473–485. [DOI] [PMC free article] [PubMed] [Google Scholar]
- Liscum, E., and Briggs, W.R. (1996). Mutations of Arabidopsis in potential transduction and response components of the phototropic signaling pathway. Plant Physiol. 112 291–296. [DOI] [PMC free article] [PubMed] [Google Scholar]
- Lupas, A. (1996). Coiled coils: New structures and new functions. Trends Biochem. Sci. 21 375–382. [PubMed] [Google Scholar]
- Motchoulski, A., and Liscum, E. (1999). Arabidopsis NPH3: A NPH1 photoreceptor-interacting protein essential for phototropism. Science 286 961–964. [DOI] [PubMed] [Google Scholar]
- Okada, K., and Shimura, Y. (1992). Mutational analysis of root gravitropism and phototropism of Arabidopsis thaliana seedlings. Aust. J. Plant Physiol. 19 439–448. [Google Scholar]
- Okada, K., and Shimura, Y. (1994). Modulation of root growth by physical stimuli. In Arabidopsis, E.M. Meyerowitz and C.R. Somerville, eds (Cold Spring Harbor, NY: Cold Spring Harbor Laboratory Press), pp. 665–684.
- Poff, K.L., Janoudi, A.-K., Rosen, E.S., Orbovic, V., Konjevic, R., Fortin, M.-C., and Scott, T.K. (1994). The physiology of tropisms. In Arabidopsis, E.M. Meyerowitz and C.R. Somerville, eds (Cold Spring Harbor, NY: Cold Spring Harbor Laboratory Press), pp. 639–664.
- Ruegger, M., Dewey, E., Hobbie, L., Brown, D., Bernasconi, P., Turner, J., Muday, G., and Estelle, M. (1997). Reduced naphthylphthalamic acid binding in the tir3 mutant of Arabidopsis is associated with a reduction in polar auxin transport and diverse morphological defects. Plant Cell 9 745–757. [DOI] [PMC free article] [PubMed] [Google Scholar]
- Short, T.W., and Briggs, W.R. (1994). The transduction of blue light signals in higher plants. Annu. Rev. Plant Physiol. Plant Mol. Biol. 45 143–171. [Google Scholar]
- Steinitz, B., Ren, Z., and Poff, K.L. (1985). Blue and green light–induced phototropism in Arabidopsis thaliana and Lactuca sativa L. seedlings. Plant Physiol. 77 248–251. [DOI] [PMC free article] [PubMed] [Google Scholar]
- Stowe-Evans, E.L., Harper, R.M., Motchoulski, A.V., and Liscum, E. (1998). NPH4, a conditional modulator of auxin-dependent differential growth responses in Arabidopsis. Plant Physiol. 118 1265–1275. [DOI] [PMC free article] [PubMed] [Google Scholar]
- Tautz, D. (1989). Hypervariability of simple sequences as a general source for polymorphic DNA markers. Nucleic Acids Res. 17 6463–6471. [DOI] [PMC free article] [PubMed] [Google Scholar]
- Watahiki, M.K., and Yamamoto, K.T. (1997). The massugu1 mutation of Arabidopsis identified with failure of auxin-induced growth curvature of hypocotyl confers auxin insensitivity to hypocotyl and leaf. Plant Physiol. 115 419–426. [DOI] [PMC free article] [PubMed] [Google Scholar]
- Watahiki, M.K., Tatematu, K., Yamamoto, M., and Yamamoto, K.T. (1999). The MSG1 and AXR1 genes of Arabidopsis are likely to act independently in growth curvature responses of hypocotyls. Planta 207 362–369. [DOI] [PubMed] [Google Scholar]
- Zhang, Y., Fan, W., Kinkema, M., Li, X., and Dong, X. (1999). Interaction of NPR1 with basic leucine zipper protein transcription factors that bind sequences required for salicylic acid induction of the PR-1 gene. Proc. Natl. Acad. Sci. USA 96 6523–6528. [DOI] [PMC free article] [PubMed] [Google Scholar]