Abstract
Male mice from 28 inbred strains (129P3/J, A/J, AKR/J, BALB/cByJ, BUB/BnJ, C3H/HeJ, C57BL/6J, C57L/J, CAST/Ei, CBA/J, CE/J, DBA/2J, FVB/NJ, I/LnJ, KK/HlJ, LP/J, NOD/LtJ, NZB/BlNJ, P/J, PL/J, RBF/DnJ, RF/J, RIIIS/J, SEA/GnJ, SJL/J, SM/J, SPRET/Ei, and SWR/J) were fed chow and had access to two water bottles. Body weight, food intake, water intake, and drinking spout side preference were measured. There were large strain differences in all the measures collected, with at least a two-fold difference between strains with the lowest and the highest trait values. Estimates of heritability ranged from 0.36 (spout side preference) to 0.87 (body weight). Body weight, food intake, and water intake were interrelated among the strains, although substantial strain variation in food and water intakes independent from body weight was present. The strain differences described here provide useful information for designing mutagenesis screens and choosing strains for genetic mapping studies.
Keywords: Mice, genetics, body size, feeding, drinking, lateralization
INTRODUCTION
Feeding, drinking, and body weight are interrelated (Richter and Brailey, 1929; Bachmanov et al., 1998, 2001; Selman et al., 2001) and influenced by both genetic and environmental factors (Fuller, 1972; Ramirez and Sprott, 1978; Smith et al., 2000). They are critical variables in many types of experiments, such as those involving metabolism, nutrition, or dosage of pharmacological agents.
Given the long history of genetic studies of body weight in mice, it is surprising that food and water consumption have been examined in only a limited number of strains (e.g., Silverstein et al., 1958; Kutscher and Miller, 1974; Ramirez and Sprott, 1978; Nagasawa et al., 1992). The goal of this study was to provide normative data on the consumption of a laboratory chow and water in a large set of inbred mouse strains. These were chosen to represent a wide range of genetic origins and to include most of the mouse strains used to date in genetic, physiological, pharmacological and behavioral studies. This experiment was conducted as a precursor to a larger study in which mice were given two-bottle tests with a choice between water and various taste solutions (see Bachmanov et al., 2002). The mice were therefore able to obtain water from two drinking spouts (Fig. 1). This allowed collection of an incidental measure, drinking spout side preference.
Fig. 1.
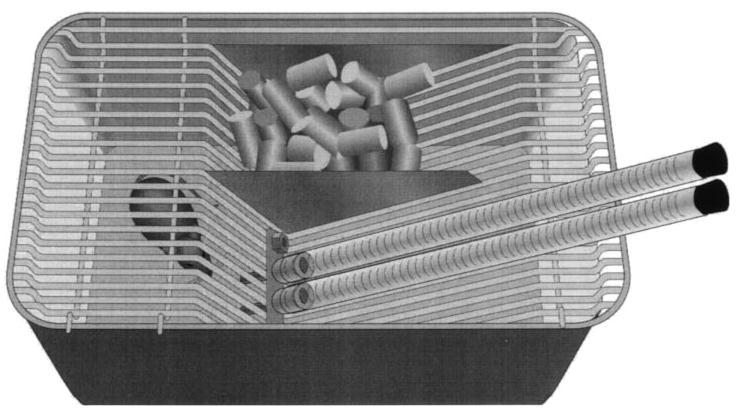
Schematic of mouse cage showing the relative positions of the food and two drinking tubes containing water.
METHODS
Subjects and Housing
Groups of male mice from 28 strains were purchased from The Jackson Laboratory (Bar Harbor, ME). The strains were: 129P3/J, A/J, AKR/J, BALB/cByJ, BUB/BnJ, C3H/HeJ, C57BL/6J, C57L/J, CAST/Ei, CBA/J, CE/J, DBA/2J, FVB/NJ, I/LnJ, KK/HlJ, LP/J, NOD/LtJ, NZB/BlNJ, P/J, PL/J, RBF/DnJ, RF/J, RIIIS/J, SEA/GnJ, SJL/J, SM/J, SPRET/Ei, and SWR/J. There were a total of 323 mice tested. Group sizes were 12 mice for each strain except for the C57L/J and SJL/J (n = 11), the BUB/BnJ (n = 7), and KK/HlJ (n = 6) strains, which were available only in limited numbers. Because of supply limitations, the mice differed slightly in age and the time they spent in our vivarium before testing began. Most of the mice were between 65 and 74 days old at the start of testing. However, the SEA/GnJ group was slightly older (81 days) and the following groups were younger: BUB/BnJ (48 days), CAST/Ei (59 days), CE/J (57 days), I/LnJ (58 days), RF/J (53 days), SM/J (57 days), and SPRET/Ei (47 days).
All mice were individually housed in plastic “tub” cages (26.5 cm × 17 cm × 12 cm) with a stainless steel grid lid, and wood shavings scattered on the floor. The vivarium was maintained at 23°C on a 12-h light/12-h dark cycle with lights off at 7 pm. The mice had access to pelleted Teklad Rodent Diet 8604 (Harlan, Madison, WI). According to the manufacturer’s specifications, this cereal-based chow diet contains 24.5% protein, 4.4% fat, and 3.7% fiber (by weight; metabolizable energy content, 3.1 kcal/g). Deionized water was available from two drinking tubes (described later).
Test Procedures
The experiment was conducted in two replications of 13 and 15 strains each. After arrival, the mice were acclimated to individual cages for at least 6 days. Food and water intakes were measured daily for 4 days. Food intake was determined to the nearest 0.1 g by weighing the metal cage top, including the food. In previous tests with mice, we determined that average food spillage does not exceed 0.1 g/day/mouse (Bachmanov et al., 2001), and thus it was not taken into account here.
During the test, deionized water was available from two tubes (Fig. 1). This was done because this study was to be followed by a series of two-bottle choice tests (see Bachmanov et al., 2002). Construction of the drinking tubes and other experimental procedures have been described previously (Bachmanov et al., 1996) and are given in detail on our website (Tordoff and Bachmanov). Each drinking tube consisted of a 25-ml plastic serological pipette with 0.2 ml gradations (Fisher Cat. No. 13-678-14B). This was connected to a 63.5-mm long stainless steel straight sipper tube (Unifab, Cat. No. US-171-25) with a 15-mm piece of silicon tubing (Cole Palmer, Cat. No. 06411-76). The top of the pipette was closed with a size 00 rubber stopper. The drinking tubes were placed to the (mouse’s) right of the food hopper. The spouts extended 25 mm into the mouse cage and their tips were 15 mm apart. Each spout had a tip with a 3.175-mm diameter hole from which the mice could lick water. The positions of the two tubes were switched after 24 h to control for side preferences. Intakes were measured to the nearest 0.1 ml daily in the middle of the light period. Extensive experience has shown that fluid spillage and evaporation from drinking tubes rarely exceeds 0.2 ml over 48 h with these procedures, and so these were ignored.
Body weight was measured (to the nearest 0.1 g) at the beginning and end of the 4-day test. The average of these measurements was used for all subsequent analyses.
Data Analyses
For each mouse, average daily food and water intakes were calculated. Intakes adjusted for body weight were derived by dividing average intakes by the average body weight and multiplying the result by 30 g (the approximate weight of an adult mouse, used as a correction factor in our previous studies). Spout side preferences of individual mice were determined by dividing average 4-day water intakes from the left tube by average 4-day total water intakes (intake from left and right tubes combined; note, “left” and “right” refer to the mouse’s left and right).
Three inbred strains included mice with different genotypes because these strains are bred using a forced heterozygosity procedure. These were 129P3/J (Tyrc/Tyrc, albino coat color phenotype, n = 10; and Tyrc-ch/Tyrc, light chinchilla coat color phenotype, n = 2), SM/J (Aw/a, white-bellied agouti coat color phenotype, n = 7; and a/a, black coat color phenotype, n = 5) and SEA/GnJ (Bmp5se/Bmp5se, short ears phenotype, n = 6; and Bmp5se/+, normal ears phenotype, n = 6). There were no within-strain differences between mice with different genotypes for any index analyzed (p > .05, t tests). Therefore, data from mice of different genotypes for each of these strains were pooled together. We also monitored mice from the NOD/LtJ strain for symptoms of diabetes (polydipsia, weight loss) but these were not noticed.
Strain variation for each dependent variable was assessed using a one-way analysis of variance (ANOVA). Tukey Honestly Significant Difference post hoc tests were used to identify differences between pairs of means and ascertain homogenous groups, within which mouse strains did not differ significantly.
We calculated heritability as a ratio SSamong strains/SStotal based on the sums of squares (SS) obtained in a one-way ANOVA for each trait (Belknap, 1998; Hatton et al., 2000). Because inbred mice are homozygous at most genetic loci, the SSamong strains represents only an additive component of the genotypic variation (VA), and therefore the SSamong strains/SStotal ratio corresponds to heritability in the narrow sense (Falconer and Mackay, 1996). Details on how this estimate compares with heritabilities derived from other types of populations are given elsewhere (Hegmann and Possidente, 1981; Belknap, 1998).
Covariation between pairs of the variables was assessed using Pearson product-moment correlations based on strain means. This is a simple method to assess genetic correlation, which produces results very close to genetic correlations calculated based on partitioning of genetic and nongenetic variances and covariances (Blizard and Bailey, 1979; Hegmann and Possidente, 1981) and is often used in studies with multiple strains (e.g., Blizard and Bailey, 1979; Hegmann and Possidente, 1981; Crabbe, 1983; Crabbe et al., 1990; Mogil et al., 1999). Examination of scatterplots of strain means did not reveal nonlinear trends, suggesting that Pearson product-moment correlations were appropriate, and that no data transformations or nonparametric tests were necessary.
A criterion for statistical significance of p < .01 was used in all tests. This was chosen as a compromise between a conventional level ( p < .05) and that dictated by a Bonferroni correction (p < .0033), which is excessively conservative because it assumes comparisons among independent variables, whereas variables in this study were interrelated. Exact values of ANOVAs and correlations are given so that readers can use other criteria for testing significance.
RESULTS
Strain differences were significant for all six indexes analyzed in this study (body weight, food and water intakes per mouse and per 30 g of body weight, and spout preference), F(27,295) ≥ 6.1, p < .00001. Estimates of heritability were 0.87 (body weight), 0.72 (food intake per mouse), 0.78 (food intake adjusted for body weight), 0.69 (water intake per mouse), 0.78 (water intake adjusted for body weight) and 0.36 (spout side preference).
Body Weight
Mean body weights ranged from 12.0 ± 0.2 g (SPRET/Ei, mean ± standard error) to 33.2 ± 1.0 g (KK/HlJ); Fig. 2. The strain means formed several distinct groups. The SPRET/Ei and CAST/Ei belonged to a group with the lowest body weights, followed by the SM/J strain. The AKR/J and KK/HlJ strains belonged to a group with the highest body weights. Body weights of the remaining 23 strains were continuously distributed and were close to the overall strain mean (23.5 ± 0.9 g, n = 28).
Fig. 2.
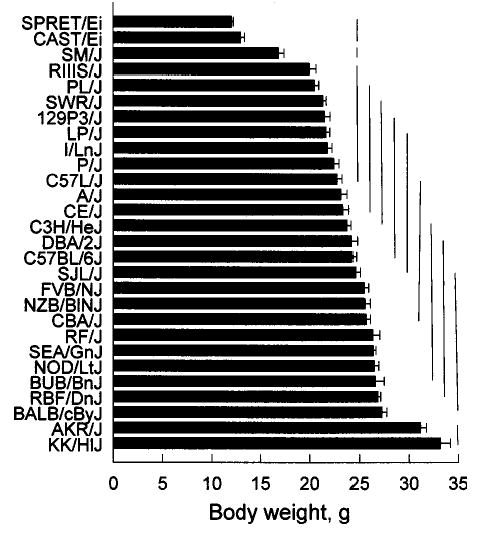
Mean body weights of 28 strains. Horizontal bars on columns are standard errors of the mean. Bars connected by a vertical line do not differ significantly from each other according to Tukey’s post hoc tests.
Most mice in this study were ~70 days old but the three lightest strains were younger (SPRET/Ei = 47 days, CAST/Ei = 59 days, SM/J = 57 days), which complicates the analysis. We therefore compared the weights of these mice at 71–72 days of age obtained as part of another experiment (Bachmanov et al., 2002), which did not involve manipulations that would be expected to influence growth rates. At this time the mean strain weights were: SPRET/Ei = 14.8 ± 0.3 g, CAST/Ei = 14.1 ± 0.4 g, and SM/J = 19.6 ± 0.7 g. An analysis using body weights of all mice aged ~70 days found no difference from the initial analysis in the rank order of strains. The SPRET/Ei and CAST/Ei strains still had significantly lower body weights than did all 26 other groups. However, in this age-equated analysis, the SM/J strain did not differ significantly in body weight from the six strains with the next lowest body weights (RIIIS/J – I/LnJ; see Fig. 2). SM/J (SM is from “small”) mice have small body size at birth and weaning, but this relatively small size tends to disappear as the animals mature (Festing, 1998). Thus, this change in grouping of the SM/J strain at two different age points is probably due to the rapid growth of these mice during this period.
Food Intake
Mean daily unadjusted food intakes ranged from 3.1 ± 0.1 g/mouse (SPRET/Ei) to 6.3 ± 0.3 g/mouse (RBF/DnJ), (Fig. 3, top). In most of the strains, food intakes were continuously distributed and were close to the overall stain mean (4.4 ± 0.1 g/mouse, n = 28). One exception was the RBF/DnJ strain, which had significantly higher food intakes than all the other groups.
Fig. 3.
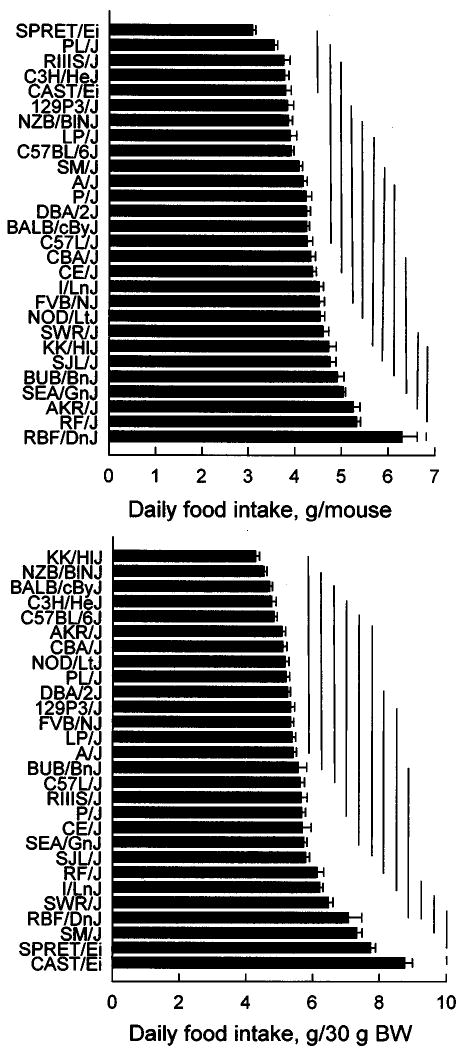
Mean food intakes (top panel) and food intakes adjusted for body weight (BW; food intake/body weight × 30; bottom panel) of 28 strains. Horizontal bars on columns are standard errors of the mean. Bars connected by a vertical line do not differ significantly from each other according to Tukey’s post hoc tests.
Mean daily food intakes adjusted for body weight ranged from 4.3 ± 1.1 g/30 g (KK/HlJ) to 8.8 ± 0.2 g/30 g (CAST/Ei), (Fig. 3, bottom). The adjusted food intakes of 27 strains were continuously distributed and were close to the overall strain mean (5.7 ± 0.2 g/30 g body weight, n = 28), with only one outlier, CAST/Ei with the highest food intake. The strain ranking was very different for unadjusted and adjusted and food intakes. For example, the SPRET/Ei strain with the lowest unadjusted intake had the second highest adjusted food intake.
Water Intake
Mean daily unadjusted water intakes ranged from 3.9 ± 0.2 ml/mouse (RIIIS/J) to 8.2 ± 0.3 ml/mouse (SEA/GnJ), and they were continuously distributed with the overall strain mean being 5.8 ± 0.2 ml/mouse (n = 28), (Fig. 4, top). The adjusted water intakes ranged from 5.7 ± 0.2 ml/30 g body weight (BALB/cByJ) to 11.4 ± 0.5 ml/30 g body weight (CAST/Ei) with the overall strain mean being 7.7 ± 0.3 ml/30 g body weight (n = 28), (Fig. 4, bottom). The adjusted water intakes were continuously distributed, however four strains (SWR/J, SM/J, SPRET/Ei, and CAST/Ei) tended to form a group with higher intakes than the rest.
Fig. 4.
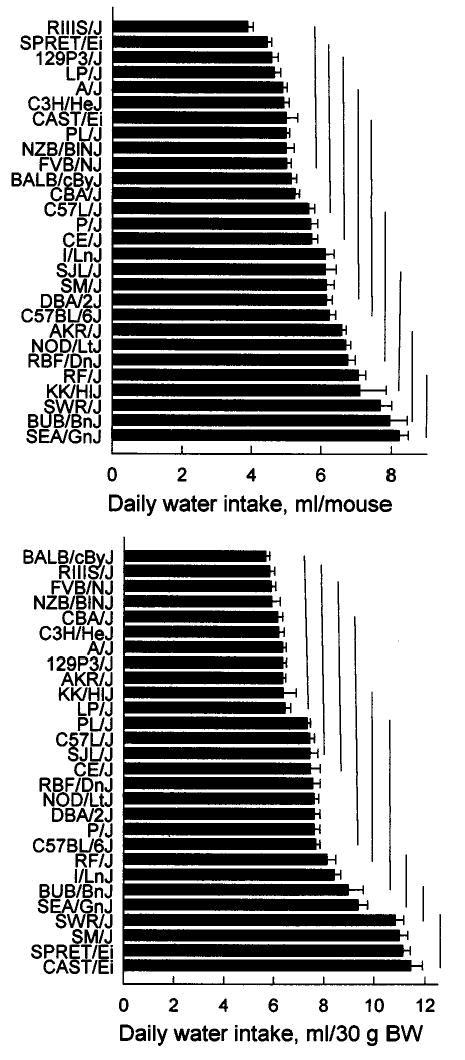
Mean water intakes (top panel) and water intakes adjusted for body weight (BW; water intake/body weight × 30; bottom panel) of 28 strains. Horizontal bars on columns are standard errors of the mean. Bars connected by a vertical line do not differ significantly from each other according to Tukey’s post hoc tests.
Spout Side Preference
Differences among the strains in spout side preference are presented in Figure 5. Based on one-sample t-tests of the mean strain side preferences relative to indifference (i.e., 50%), the SWR/J strain and 12 strains shown above it (Fig. 5) drank a significantly greater proportion of their water from the left than the right tube. The remaining 16 strains did not show a significant side preference (i.e., their preference score was not significantly different from 50%). No strains preferred the tube on the right.
Fig. 5.
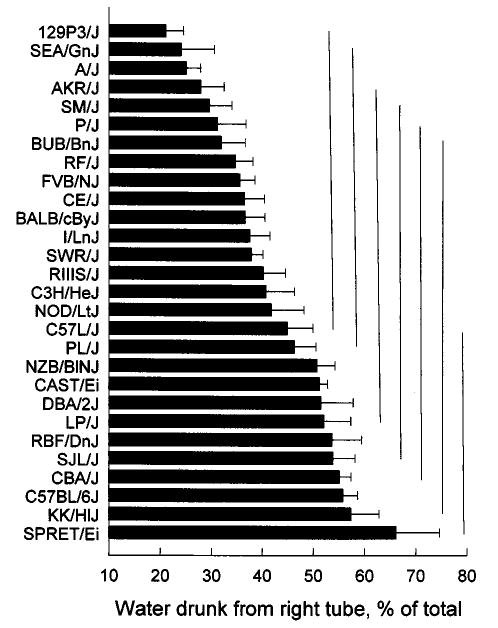
Mean spout side preferences of the 28 strains. Horizontal bars on columns are standard errors of the mean. Bars connected by a vertical line do not differ significantly from each other according to Tukey’s post hoc tests.
Correlations among the Measures
All reported correlation coefficients were calculated using strain means. Body weight correlated positively with unadjusted food and water intakes, and it correlated negatively with body-weight adjusted food and water intakes (Table I, Fig. 6). Food and water intakes were correlated positively, whether they were unadjusted or adjusted. Correlations between unadjusted and adjusted water intakes, and between unadjusted and adjusted food intakes were not significant. Neither body weight nor any of the measures of ingestion correlated significantly with spout preference (Table I).
Table I.
Correlations among Mean Body Weights, Food Intakes, and Water Intakes for 28 Strains
| Body weight | Water intake/mouse | Food intake/mouse | Water intake/30 g BW | Food intake/30 g BW | |
|---|---|---|---|---|---|
| Water intake/mouse | +.49* | ||||
| Food intake/mouse | +.65 † | +.72† | |||
| Water intake/30 g BW | −.61* | +.36 | −.05 | ||
| Food intake/30 g BW | −.73 † | −.00 | −.01 | +.82 † | |
| Spout preference | −.16 | −.20 | −.21 | +.07 | +.11 |
p < .01,
p < .001.
Fig. 6.
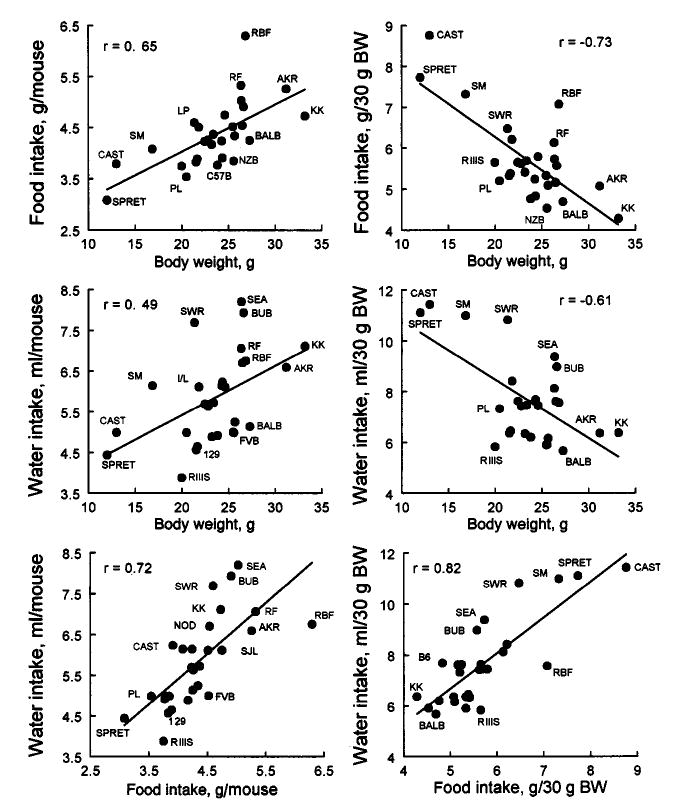
Scatterplots of mean strain values for body weight and indexes of food and water intakes. Data for individual strains are labeled with abbreviations when this does not obscure other data points.
DISCUSSION
This study provides normative data on intakes and body weights of male mice from 28 inbred strains. This set includes most of the commonly used strains, as well as representatives of genealogically unrelated strains (Altman and Katz, 1979; Beck et al., 2000), including CAST/Ei which is a different subspecies of M. musculus (M. musculus castaneus), and SPRET/Ei, which is a different mouse species (M. spretus). The strains tested here also include progenitors of 12 sets of recombinant inbred strains (AKXD, AKXL, AXB, BXA, BXD, BXH, BXJ, CXB, CXJ, NXSM, SWXJ, SWXC) and of other more recently developed mouse models for gene mapping (e.g., Vadasz et al., 1996; Nadeau et al., 2000; Iakoubova et al., 2001).
There was a considerable range of variation among the 28 mouse strains in all measures tested, with at least a two-fold difference between strains with the lowest and the highest trait values. For all indexes, the means for the majority of strains were continuously distributed with only a few or no outliers. This suggests that variation in body weight, feeding, drinking and spout preference among strains is due to multiple genes and/or alleles. (However, this does not preclude a difference between any pair of strains having a simpler mode of inheritance.)
Previous literature has demonstrated that the relationship between body size and intake is complex. Unadjusted intakes are generally positively correlated with body size, and this was also found in this study. Many investigators adjust for body size by dividing raw food or solution intakes by body weight or body surface area (see Richter and Brailey, 1929). However, “adjusted” intakes have several disadvantages (Kronmal, 1993; Allison et al., 1995). One is that the adjustment does not necessarily produce a ratio any more independent from body weight than the unadjusted intakes. This was the case here: Body weight accounted for 42% (r2) of the variance in unadjusted food intake and 24% of the variance in unadjusted water intake (with positive correlations). However, it accounted for 44% of the variance in adjusted food intake and 31% of the variance in adjusted water intake (with negative correlations). Therefore, in the overall analysis of strain variation, a simple linear adjustment of intakes for body weight did not make them independent of body weight; if anything, it tended to increase this dependence. Similar analyses using other adjustments (see Allometric Equations in the list of references) do little to alleviate the problem.
Adjustment of intakes for body weight can have profound effects on interpretation. For example, SPRET/Ei and CAST/Ei were among the strains with the lowest unadjusted food and water intakes but because of their low body weights, they had the highest weight-adjusted food and water intakes. Nevertheless, taking body weight into account when analyzing intakes can help to find sources of variation that are independent from body weight. For example, some strains with similar body weights have substantial differences in food (e.g., RBF vs. BALB or NZB) and water (e.g., SEA vs. BALB) intakes (see Fig. 6).
Food and water intakes also correlated positively. This may be due to their mutual dependence on body size, but an additional mechanism directly linking food and water intakes may also be involved. Rodents on pelleted diet consume most of their water immediately before and after they eat food, which is probably due to both osmotic and volumetric stimulation of thirst (Kraly, 1984). Thus, mice that eat more would tend also to drink more. However, inspection of individual values (Fig. 6) indicates that a component of the variation in water intake is independent from food intake: some strains with similar food intakes show large differences in water intakes (e.g., SWR and FVB).
Our finding that some mouse strains show preferences for the position of their drinking spout contributes to a literature on the genetic basis of lateralization in mice (e.g., Betancur et al., 1991; Collins, 1991; Signore et al., 1991; Biddle et al., 1993; Waters and Denenberg, 1994; Biddle and Eales, 1996). In particular, Biddle and Eales (1996) tested the degree of lateralization in 26 mouse strains by measuring paw entry into a tube containing food. We compared the results of 9 strains that were common to both studies and found no correlation between paw usage and spout side preference (r = .08). The paw usage reflects body laterality whereas spout preference may reflect body position within the cage, which may explain the lack of correlation between these two measures. In our test situation, the drinking spout on the mouse’s left was closest to the food hopper, so the left preference shown by several strains might reflect proximity of the water source to food or shelter (under the food hopper). At the very least, these results suggest that the experimenter must control for spout position when using two-bottle preference tests to compare mouse strains.
Genetic correlations based on means of multiple inbred strains depend on several factors, including pleiotropy, genetic linkage, and the number and genealogical relatedness of strains within the analyzed set. The use of a large number of unrelated strains minimizes the effects of linkage and random fixation, making the obtained strain correlations more predictive of a trait’s covariation in segregating crosses (Hegmann and Possidente, 1981). Given the relatively large number and genealogical diversity of strains examined here, we suspect that the correlations among body weight, feeding, drinking and spout preference found in this study can be generalized to the Mus musculus species.
In conclusion, we have characterized body weight, intakes of food and water, and left/right drinking spout preference in male mice from 28 inbred strains of different origins, including most of the commonly used strains. Considerable variation in each trait was found, with more than a two-fold difference between strains with the highest and lowest trait values. Food and water intakes were interrelated and strongly related to body weight. However, substantial strain variation in food and water intakes independent from body weight was present among the strains. These results provide reference data useful for many types of experiments, including designing mutagenesis screens and choosing mouse crosses for linkage analyses. Finally, they contribute to the community-wide Mouse Phenome Project (Paigen and Eppig, 2000). Most of these strains are included in the Mouse Phenome Database (www.jax.org/phenome), which makes possible meta-analyses of these data with other inbred strain characteristics deposited into the database.
Acknowledgments
This research was supported by NIH grants (DC-03853 (A. A. B.), AA-12715 (M. G. T.), DK-46791 (M. G. T.), and DK-058797 (D. R. R.). We thank Jessica Santo and Maria Theodorides for technical assistance. Raw data from this study are available on-line: Tordoff, M. G. and Bachmanov, A. A. Food intakes, water intakes, and spout side preferences, accession no. MPD:63. Mouse Phenome Database, The Jackson Laboratory, Bar Harbor, Maine (URL: http://www.jax.org/phenome).
Footnotes
Edited by Stephen Maxson
References
- Allometric Equations, http://www.epa.gov/ncea/pdfs/allometr.pdf National Center for Environmental Assessment of the Environmental Protection Agency, Washington, DC.
- Allison DB, Paultre F, Goran MI, Poehlman ET, Heymsfield SB. Statistical considerations regarding the use of ratios to adjust data. Int J Obes Relat Metab Disord. 1995;19:644–652. [PubMed] [Google Scholar]
- Altman, P. L., and Katz, D. D. (1979). Inbred and Genetically Defined Strains of Laboratory Animals, Part 1, Mouse and Rat Federation of American Societies for Experimental Biology, Bethesda, MD.
- Bachmanov AA, Beauchamp GK, Tordoff MG. Voluntary consumption of NaCl, KCl, CaCl2 and NH4Cl solutions by 28 mouse strains. Behav Genet. 2002;32:445–457. doi: 10.1023/a:1020832327983. [DOI] [PMC free article] [PubMed] [Google Scholar]
- Bachmanov AA, Reed DR, Tordoff MG, Price RA, Beauchamp GK. Nutrient preference and diet-induced adiposity in C57BL/6ByJ and 129P3/J mice. Physiol Behav. 2001;72:603–613. doi: 10.1016/s0031-9384(01)00412-7. [DOI] [PMC free article] [PubMed] [Google Scholar]
- Bachmanov AA, Tordoff MG, Beauchamp GK. Ethanol consumption and taste preferences in C57BL/6ByJ and 129/J mice. Alcohol Clin Exp Res. 1996;20:201–206. doi: 10.1111/j.1530-0277.1996.tb01630.x. [DOI] [PMC free article] [PubMed] [Google Scholar]
- Bachmanov AA, Tordoff MG, Beauchamp GK. Voluntary sodium chloride consumption by mice: Differences among five inbred strains. Behav Genet. 1998;28:117–124. doi: 10.1023/a:1021471924143. [DOI] [PMC free article] [PubMed] [Google Scholar]
- Beck JA, Lloyd S, Hafezparast M, Lennon-Pierce M, Eppig JT, Festing MF, Fisher EM. Genealogies of mouse inbred strains. Nat Genet. 2000;24:23–25. doi: 10.1038/71641. [DOI] [PubMed] [Google Scholar]
- Belknap JK. Effect of within-strain sample size on QTL detection and mapping using recombinant inbred mouse strains. Behav Genet. 1998;28:29–38. doi: 10.1023/a:1021404714631. [DOI] [PubMed] [Google Scholar]
- Betancur C, Neveu PJ, Le Moal M. Strain and sex differences in the degree of paw preference in mice. BehavBrain Res. 1991;45:97–101. doi: 10.1016/s0166-4328(05)80185-8. [DOI] [PubMed] [Google Scholar]
- Biddle FG, Coffaro CM, Ziehr JE, Eales BA. Genetic variation in paw preference (handedness) in the mouse. Genome. 1993;36:935–943. doi: 10.1139/g93-123. [DOI] [PubMed] [Google Scholar]
- Biddle FG, Eales BA. The degree of lateralization of paw usage (handedness) in the mouse is defined by three major phenotypes. Behav Genet. 1996;26:391–406. doi: 10.1007/BF02359483. [DOI] [PubMed] [Google Scholar]
- Blizard DA, Bailey DW. Genetic correlation between open-field activity and defecation: Analysis with the CXB recombinant-inbred strains. Behav Genet. 1979;9:349–357. doi: 10.1007/BF01066973. [DOI] [PubMed] [Google Scholar]
- Collins RL. Reimpressed selective breeding for lateralization of handedness in mice. Brain Res. 1991;564:194–202. doi: 10.1016/0006-8993(91)91455-a. [DOI] [PubMed] [Google Scholar]
- Crabbe JC. Sensitivity to ethanol in inbred mice: Genotypic correlations among several behavioral responses. BehavNeurosci. 1983;97:280–289. doi: 10.1037//0735-7044.97.2.280. [DOI] [PubMed] [Google Scholar]
- Crabbe JC, Phillips TJ, Kosobud A, Belknap JK. Estimation of genetic correlation: Interpretation of experiments using selectively bred and inbred animals. Alcohol Clin Exp Res. 1990;14:141–151. doi: 10.1111/j.1530-0277.1990.tb00461.x. [DOI] [PubMed] [Google Scholar]
- Falconer, D. S., and Mackay, T. F. C. (1996). Introduction to Quantitative Genetics. Longman, Essex, England.
- Festing, M. F. W. (1998). Listing of Inbred Strains of Mice: SM; http://www.informatics.jax.org/external/festing/mouse/docs/SM.shtml The Jackson Laboratory, Bar Harbor, ME.
- Fuller JL. Genetic aspects of regulation of food intake. Adv Psychosom Med. 1972;7:2–24. doi: 10.1159/000393291. [DOI] [PubMed] [Google Scholar]
- Hatton DC, Qi Y, Belknap JK. Heritability of the blood pressure response to acute ethanol exposure in five inbred strains of mice. Alcohol Clin Exp Res. 2000;24:1483–1487. [PubMed] [Google Scholar]
- Hegmann JP, Possidente B. Estimating genetic correlations from inbred strains. Behav Genet. 1981;11:103–114. doi: 10.1007/BF01065621. [DOI] [PubMed] [Google Scholar]
- Iakoubova OA, Olsson CL, Dains KM, Ross DA, Andalibi A, Lau K, Choi J, Kalcheva I, Cunanan M, Louie J, Nimon V, Machrus M, Bentley LG, Beauheim C, Silvey S, Cavalcoli J, Lusis AJ, West DB. Genome-tagged mice (GTM): Two sets of genome-wide congenic strains. Genomics. 2001;74:89–104. doi: 10.1006/geno.2000.6497. [DOI] [PubMed] [Google Scholar]
- Kraly FS. Physiology of drinking elicited by eating. Psychol Rev. 1984;91:478–490. [PubMed] [Google Scholar]
- Kronmal RA. Spurious correlation and the fallacy of the ratio standard revisited. J R Stat Soc. 1993;156:379–392. [Google Scholar]
- Kutscher CL, Miller DG. Age-dependent polydipsia in the SWR-J mouse. Physiol Behav. 1974;13:71–79. doi: 10.1016/0031-9384(74)90308-4. [DOI] [PubMed] [Google Scholar]
- Mogil JS, Wilson SG, Bon K, Lee SE, Chung K, Raber P, Pieper JO, Hain HS, Belknap JK, Hubert L, Elmer GI, Chung JM, Devor M. Heritability of nociception, II. ‘Types’ of nociception revealed by genetic correlation analysis. Pain. 1999;80:83–93. doi: 10.1016/s0304-3959(98)00196-1. [DOI] [PubMed] [Google Scholar]
- Nadeau JH, Singer JB, Matin A, Lander ES. Analysing complex genetic traits with chromosome substitution strains. Nat Genet. 2000;24:221–225. doi: 10.1038/73427. [DOI] [PubMed] [Google Scholar]
- Nagasawa H, Amano K, Araki M. Relationship between pup growth, mother weight, food or water intake in four strains of mice. In Vivo. 1992;6:69–71. [PubMed] [Google Scholar]
- Paigen K, Eppig JT. A mouse phenome project. Mammal Genome. 2000;11:715–717. doi: 10.1007/s003350010152. [DOI] [PubMed] [Google Scholar]
- Ramirez I, Sprott RL. Genetic mechanisms of drinking and feeding. Neurosci Biobehav Rev. 1978;2:15–56. [Google Scholar]
- Richter C, Brailey M. Water intake and its relation to the surface area of the body. Proc Natl Acad Sci USA. 1929;15:570–578. doi: 10.1073/pnas.15.7.570. [DOI] [PMC free article] [PubMed] [Google Scholar]
- Selman C, Lumsden S, Bunger L, Hill WG, Speakman JR. Resting metabolic rate and morphology in mice (Mus musculus) selected for high and low food intake. J Exp Biol. 2001;204:777–784. doi: 10.1242/jeb.204.4.777. [DOI] [PubMed] [Google Scholar]
- Signore P, Nosten-Bertrand M, Chaoui M, Roubertoux PL, Marchaland C, Perez-Diaz F. An assessment of handedness in mice. Physiol Behav. 1991;49:701–704. doi: 10.1016/0031-9384(91)90305-8. [DOI] [PubMed] [Google Scholar]
- Silverstein E, Sokoloff L, Mickelsen O, Jay JE. Polyuria, polydipsia and hydronephrosis in inbred strain of mice. Fed Proc. 1958;17:1796. [PMC free article] [PubMed] [Google Scholar]
- Smith BK, Andrews PK, West DB. Macronutrient diet selection in thirteen mouse strains. Am J Physiol Regul Integr Comp Physiol. 2000;278:R797–R805. doi: 10.1152/ajpregu.2000.278.4.R797. [DOI] [PubMed] [Google Scholar]
- Tordoff, M. G., and Bachmanov, A. A. Monell Mouse Taste Phenotyping Project, http://www.monell.org/MMTPP/.Monell Chemical Senses Center, Philadelphia, PA.
- Vadasz C, Sziraki I, Sasvari M, Kabai P, Laszlovszky I, Juhasz B, Zahorchak R. Genomic characterization of two introgression strains (B6.Cb4i5) for the analysis of QTLs . Mammal Genome. 1996;7:545–548. doi: 10.1007/s003359900161. [DOI] [PubMed] [Google Scholar]
- Waters NS, Denenberg VH. Analysis of two measures of paw preference in a large population of inbred mice. Behav Brain Res. 1994;63:195–204. doi: 10.1016/0166-4328(94)90091-4. [DOI] [PubMed] [Google Scholar]


