The application of MS to the analysis of large biomolecules has undergone explosive growth in the past 10 years. With the development of electrospray ionization (ESI) (1, 2) and matrix-assisted laser desorption/ionization (MALDI) (3), intact molecular ions of large molecules with molecular weights up to hundreds of megadaltons can now be formed and mass analyzed. These ionization methods have placed increasing demands on the performance of mass analyzers, challenging analytical chemists to develop new MS instrumentation and methods for obtaining molecular weight and structural information. MALDI has led to the resurgence of time-of-flight MS and new methods for increasing mass accuracy, sensitivity, and resolution. Similarly, mass analysis of multiply charged ions in the hundred-megadalton range, formed by ESI, has required the development of innovative detection methods.
Tandem MS (MS/MS)—in which a precursor ion is mass selected from a mixture, dissociated or reacted, and the product ions are mass analyzed—has become a powerful method for analyzing complex mixtures of small molecules and solving “needle-in-the-haystack” problems. The dissociation and chemical reactivity of small ions have been extensively studied by a wide range of techniques, and a significant amount of information about energetics and mechanisms has been obtained (4). As a result, MS/MS has become a powerful analytical tool for characterizing trace quantities of compounds in complex mixtures.
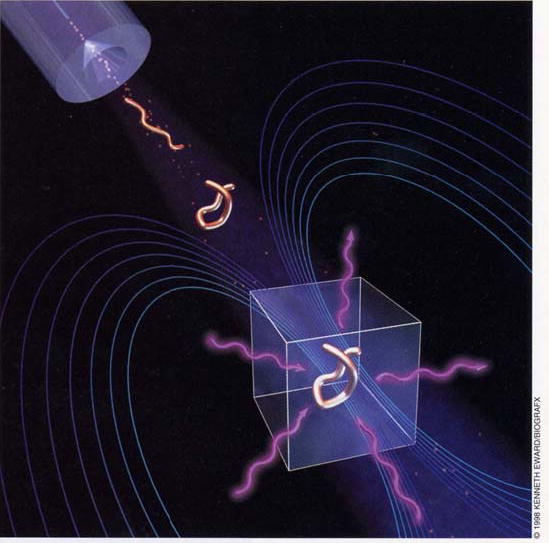
By comparison, the chemistry and structure of larger (>5 kDa) gas-phase ions is less well-known. However, significant advances have been made in recent years in instrumentation and structural characterization methods. These developments have made possible new applications of MS/MS for solving important problems in biochemistry and medicine, including obtaining sequence information, locating positions of post-translational modifications and binding sites, and identifying proteins found in cells.
For MS/MS applications, ESI has an advantage because the technique forms multiply charged ions of large molecules with m/z values that are typically 500–2500. For molecules larger than ~3500 Da, multiple charging facilitates ion dissociation and the production of more structurally useful fragments than those obtained from the singly charged ions typically produced by MALDI.
Various types of mass spectrometers are used for MS/MS experiments of ESI-generated ions. Of these instruments, Fourier transform MS (FTMS) has several powerful capabilities that make it well-suited to this application (5, 6). These capabilities include ultrahigh mass resolution (>105 at m/z 1000); ion remeasurement; multichannel detection over a wide mass range; long ion storage times; and extensive MSn capabilities, including two-dimensional methods for simultaneously recording MS/MS and MSn spectra (7). The combination of ESI with FTMS is becoming one of the most powerful methods for the structural analysis of large biomolecules. This Report covers selected topics that illustrate the type of information that is currently obtainable by ESI-FTMS. More comprehensive reviews on both ESI (1, 2) and FTMS (5–7) are available.
Instrumentation
The principal difficulty of combining ESI with FTMS is the vastly different pressures at which these two methods operate. ESI typically forms ions at atmospheric pressure, whereas pressures of less than 10−8 Torr are required for optimal FTMS performance. The most common solution to this problem involves the use of ESI sources “external” to the superconducting magnet.
A schematic of the Berkeley–Finnigan external ion-source instrument is shown in Figure 1. Ions formed at atmospheric pressure are introduced to the vacuum system through a capillary or small orifice and subsequently guided though several stages of differential pumping into the FTMS cell. Various ion optics are used to guide the ions through the fringing fields of the magnet. The most common of these methods involves radio frequency (rf) ion guides, such as quadrupoles, or as shown in Figure 1, constant-potential Einzel lens injection systems. Instruments using these types of ion guides with electrospray sources are now commercially available.
Figure 1. Schematic of an external ion-source FTMS instrument.
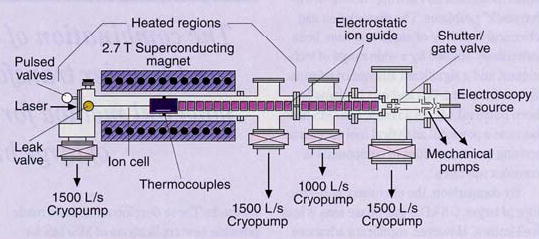
Electrospray ions generated at atmospheric pressure are guided through five differential pumping stages and into the ion cell at 10−9 Torr by means of an electrostatic ion guide system. Neutral atoms or molecules are introduced through the leak or pulsed valves for collisional activated dissociation or ion-molecule reactions; photodissociation occurs with lasers or blackbody photons from the heated vacuum chamber.
Another method is an “internal” electrospray source, developed by Hofstadler and Laude, in which ions are formed at atmospheric pressure but adjacent to the cell (8). Several stages of differential pumping are obtained using concentric tubes inside the bore of the magnet. Although the pumping efficiency of this configuration is lower than that obtained with external ion-source designs, this method offers the advantage of electrospray ions formed in a region of high magnetic field. This method confines the ions along the direction of the magnetic field, and more ions can be introduced into the vacuum chamber for a given orifice size.
Accurate mass measurement
The ultrahigh resolution possible with FTMS (7) provides several advantages for the analysis of large biomolecules. With sufficient resolving power, adducts, such as Na+, and degradation products, such as water or ammonia, can be distinguished from protonated molecular ions—even at masses greater than 105 Da. This capability makes more accurate mass assignments possible.
Natural isotopic abundances of 2H, 13C, 15N, 17O, 18O, and 34S lead to a distribution of molecular ions for each charge state that is separated by one nominal mass unit. With increasing molecular size, the probability that an ion will be a monoisotopic ion containing only the isotopes of lowest mass (1H, 12C, 14N, 16O, 32S) decreases. Above ~15 kDa, the abundance of the monoisotopic peak is negligible. The molecular ion distribution consists primarily of ions containing one or more of the heavier isotopes.
The isotope distribution of a large protein, chondroitinase II (112 kDa), measured by ESI/FTMS, is shown in Figure 2 (9). This molecule is the largest for which isotopic resolution has been reported. The spectrum in Figure 2a shows the distribution of multiply charged ions with each adjacent peak corresponding to molecular ions that differ by one proton—that is, (M + nH)n+ ions. After isolating the (M + 90H)90+ ion, resolution of the molecular ion isotope distribution is possible (Figure 2b) with increased S/N using time-domain sampling (Figure 2c). The peak at highest abundance corresponds to an ion 69 mass units greater than the monoisotopic ion, a conclusion that can be deduced by fitting the measured isotopic peak abundances to the calculated isotopic distribution of an “average” protein this size. Although the mass of these isotopic peaks can be measured quite precisely, the principal error in deducing the mass of a protein this size comes from fitting the peaks to the isotope distribution, which in this case yields an uncertainty of ± 3 Da. The ability to fit the isotopic distribution within the limits of the natural isotope variations and the precision with which peak abundances can be measured are the limiting factor in determining the precise mass of proteins of greater than 30 kDa.
Figure 2. ESI-FTMS spectrum of chondroitinase II.
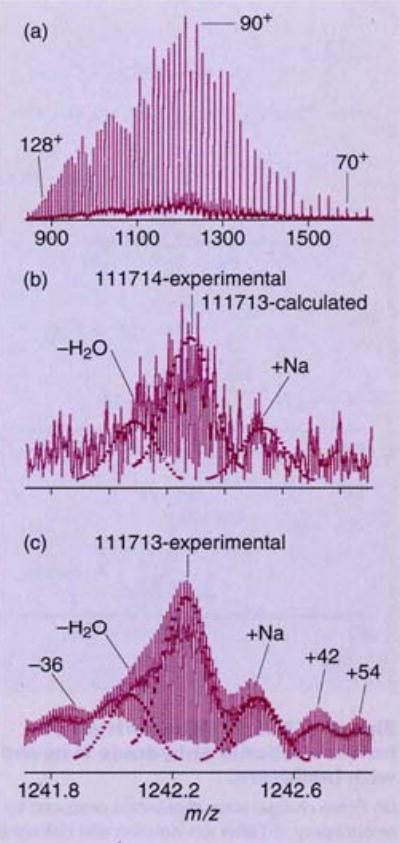
(a) Entire charge-state distribution produced by electrospray, (b) (M + 90H)90+ ions detected over a narrow bandwidth for high resolution, and (c) data from (b) after time-domain sampling, showing isotopically resolved molecular ions, adducts, and fragmentation products. (Adapted with permission from Ref. 9.)
This error can be reduced or even eliminated by using proteins that are depleted in the heavier isotopes. For example, the natural abundance of the monoisotopic ion of a mutant FK506 binding protein (11.8 kDa) is about 0.65% and is virtually undetectable in an ESI-FTMS spectrum (10). With protein isolated from E. coli grown on a medium depleted in 13C and 15N, however, the monoisotopic peak becomes the most abundant isotope; its mass is measurable down to the low- and even sub-ppm range. This capability eliminates any uncertainly from fitting the isotopic distribution, and it could simplify and improve the mass accuracy obtainable for much larger biomolecules.
An additional advantage of isotopic resolution is the ability to assign the mass of an ion directly from the spacing of the isotopic peaks (11). For example, the spacing between the isotopic peaks in Figure 2c is 1/90 of an m/z unit, indicating an ion with 90 charges. This advantage is particularly important in MSn experiments in which ions of the same mass differing by one charge state are not commonly produced and therefore it would be otherwise difficult to determine z. Isotopic resolution enables accurate assignment of the charge state of each product ion directly from the MS/MS spectrum.
Although ions of greater than 106 Da can be readily produced by ESI (1, 2, 12, 13), mass analysis of such large ions by conventional methods has remained elusive until recently. With increasing mass, the separation of the multiply charged molecular ion envelope produced by ESI decreases, and higher resolving power is required to separate the individual charge states. Sample heterogeneity, adducts, and other factors further increase the complexity of the spectrum. The ability of FTMS to directly measure ESI mass spectra of molecules of greater than 106 Da with high resolution is limited by space-charge effects—essentially, how many ions can be placed in the FTMS cell before coulomb interactions among ions degrade performance. This space–charge problem can be circumvented by mass analyzing individual ions.
Mass analysis of single multiply charged ions has been demonstrated with two methods that take advantage of the nondestructive detection capabilities of FTMS (12, 13). One method measures the frequency of a single ion; subsequent loss or addition of a single charge, such as Na+, during the detection transient produces a shift in the measured frequency (12). From this change in frequency and the additional frequency shifts that may occur because of the loss or gain of additional charges, the charge state of the ion can be determined. The other method determines the ion’s charge directly from the magnitude of the induced current that the ion produces on the detection electrodes in the FTMS cell (13). This method is less precise (currently ~10%), but it has been used to determine the mass of DNA ions of greater than 108 Da. The sensitivity of single-ion detection depends on the charge of the ion. Currently, a minimum of ~30 charges is required, but improvements in instrumentation will likely decrease this substantially in the future.
Sensitivity
The ESI-FTMS detection limit depends on many factors, including the analyte’s molecular size and structure, sample contamination, and so on. Perhaps the results obtained by combining ESI-FTMS with capillary etectrophoresis (CE) best illustrate this method’s possible sensitivity. CE readily manipulates small sample volumes, and these separation volumes nicely match the injection volumes typically used with microelectrospray sources (14).
Several demonstrations of CE/FTMS have been reported. Recently, Hofstadler et al. demonstrated single-cell analysis with CE/ESI-FTMS (15). An individual human erythrocyte cell was injected and subsequently lysed in the CE column. The α- and β-chains of hemoglobin, the major protein component in the cell (~450 amol), were detected with isotopic resolution.
McLafferty and co-workers analyzed a crude isolate from human blood (16). Carbonic anhydrase, representing about 1% by weight of the total protein in a single red blood cell, was readily detected with isotopic resolution from an approximately 60-pL injection volume, which corresponds to about 7 amol of protein. The average measured molecular weight was 42 mass units greater than expected. Dissociation of 9 amol of sample injected on-column produced sufficient sequence-specific ions for this protein to be correctly retrieved from a protein database; the 42 mass-unit difference between the measured and referenced mass was thus attributed to acetylation of carbonic anhydrase in the human blood sample.
An additional advantage of FTMS is that ions remain in the cell after detection, and their cyclotron orbits can be reduced by collisions with neutral molecules. These collisions reduce the ion kinetic energy; the ions spiral back down, close to the center of their original orbits, in which they are available for subsequent reaction or redetection (17). This process can be frequently repeated to obtain improved S/N. Laude and co-workers have demonstrated that ESI ions can be remeasured with unit efficiency and with high resolving power if experimental parameters are carefully controlled (18).
Probes of ion structure
Dissociation collisions.
Dissociation can be induced in the electrospray source by increasing the ion kinetic energy in the intermediate pressure regime, which affects collisional activation and subsequent dissociation. Such nozzle-skimmer dissociation can provide useful structural information from a pure component or a relatively simple mixture, but this approach is not “true” MS/MS because neither precursor ion selection nor MSn experiments are possible. In the ion cell, ions can be mass selected and collisions can be effected by various methods.
For large multiply charged biomolecule ions, McLafferty and co-workers found that one of these methods—sustained off-resonance irradiation collisionally activated dissociation (SORI-CAD) (19)—provides high efficiency (~ 90%), selectivity, and resolving power (~106) for product ion spectra (20). In this method, an rf signal ~1 to 2 kHz off the resonance frequency of the ion is applied to the cell. Ions are initially excited to higher cyclotron orbits, but they quickly go out of phase with the applied signal and are subsequently de-excited.
This cycle of expanding and contracting radius continues for the duration of the applied rf waveform. The maximum kinetic energy the ion obtains depends on the rf amplitude and the off-resonance frequency. This method forms fragment ions near the center of the cell so that they can be more efficiently detected. A disadvantage, however, is that fragment ions formed with m/z values corresponding to the applied rf are ejected from the cell. The result is “blind spots” in the spectrum, in which no fragment ions are observed—a problem for multiply charged ions, in which fragments can appear at higher and lower m/z than does the precursor. Two separate experiments in which the off-resonance frequency is changed are required for acquisition of a complete MS/MS spectrum. The relative merits of other CAD methods for large ions are discussed in Ref. 19.
Tandem mass spectra can be exquisitely sensitive to the primary sequence of large proteins. For example, Smith and co-workers examined the dissociation of (M + 15H)15+ ions from cytochrome c variants by using SORI-CAD (21). The spectra obtained from bovine, tuna, rabbit, and equine cytochrome c differed significantly despite the extensive sequence homology among these species. Equine and bovine cytochrome c differ by only three residues; dissociation of these (M + 15H)15+ ions produced fragmentation at different positions along the backbone and with different intensities. The difference in these spectra suggests that higher-order protein structure may influence the dissociation behavior of these large ions.
Significant sequence information can often be obtained directly by tandem FTMS of large molecular ions. Using a combination of dissociation methods, McLafferty and co-workers obtained 74 identifiable fragment ions from carbonic anhydrase (259 amino acids), from which 23 amino acid spacings were obtained (22). These results demonstrate the capability of tandem FTMS for verifying the sequence of recombinant proteins or protein sequences derived from CDNA data. If the correct molecular weight is not obtained, the sequence error can be localized to a specific region in the protein from the shifts in the observed fragment ion mass. This method was recently used to distinguish among several published sequences of human creatine kinase (43 kDa) (23).
Another promising application of tandem FTMS is the analysis of noncovalent complexes. Demonstrations have shown that relative binding constants of para-substituted benzene sulfonamides to carbonic anhydrase can be obtained from the relative abundance of the bound complexes in the ESI-FTMS spectrum (24). The mass of the inhibitor can be more readily measured by dissociating the complex; if the inhibitor retains a charge, its mass can be measured more accurately because of the higher performance of FTMS at lower m/z. In addition, the structure of the inhibitor can be probed by further dissociation steps. Figure 3 shows the mass spectrum of carbonic anhydrase bound with inhibitors (Figure 3a), dissociation of the isolated (M − 9H)9− ion with SORI-CAD (Figure 3b), and the subsequent dissociation of isolated inhibitor ions (Figure 3c). The inhibitors dissociate to fragments that are characteristic of their structure.
Figure 3. ESI-FTMS spectrum of bovine carbonic anhydrase II bound with inhibitors.
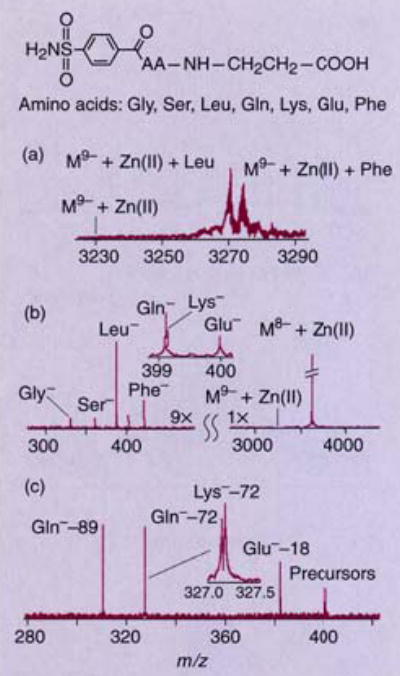
(a) Entire charge-state distribution produced by electrospray, (b) after ion isolation and collisional dissociation, and (c) isolation and dissociation of three inhibitors. (Adapted from Ref. 24.)
Ion-surface collisions have been used in FTMS to dissociate ions as large as carbonic anhydrase (29 kDa) (25). This method does not introduce collision gas into the mass spectrometer and allows more energetic dissociations to be induced at higher collision energies. Fragments similar to those obtained by SORI-CAD and IR-radiative multiphoton dissociation (IRMPD, which is discussed in the next section) are formed. Dissociation efficiencies range from 36% to 14% for 1 to 29 kDa ions, respectively.
Photons.
Photodissociation is an important structural characterization tool for small ions (5, 7) and is readily implemented in FTMS. Both IR (10 mm) and UV (193 nm) photons have been used to dissociate large multiply charged ions. These methods have the advantage that they do not increase the pressure inside the FTMS cell. To date, IRMPD has provided the most structurally informative fragments from both proteins and DNA (26, 27). The relatively long activation times (10 to 100s of milliseconds) make this method “slow heating”. Fragments similar to those obtained by SORI-CAD are produced.
IRMPD also has the advantage of no blind spots. Although 100% of the precursor ion can be depleted, fragment ions typically remain on-axis in the FTMS cell and can absorb additional photons. “This can cause fragment ions to dissociate further, resulting in a trade-off between completely dissociating the precursor ion for maximum dissociation efficiency versus retaining higher-mass structurally useful fragments for increased sequence information. With a reasonable balance, dissociation efficiencies can still be quite high (~30% to 80%) (26).
To illustrate the type of information obtained, a partial IRMPD spectrum of a DNA 50-mer (27) is shown in Figure 4. A large number of fragment ions are formed, providing a wealth of sequence information. Mass values for 75 different fragment ions were obtained with less than 0.05 Da error. The high mass accuracy makes possible specific assignment for most peaks. This has been demonstrated by using IRMPD, in combination with other dissociation methods, to generate the complete sequence for a 50-mer DNA and extensive sequence information for up to 108-mers (27).
Figure 4. Partial IRMPD spectrum of a DNA 50-mer.
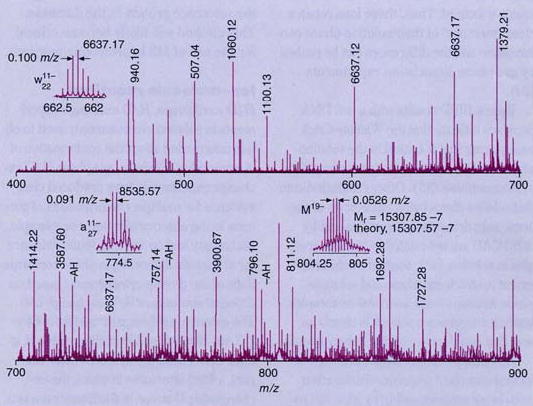
Insets show isotopic distributions for selected ions; ions were irradiated for 10 ms using a CO2 laser with a 10.6-μm wavelength. (Adapted from Ref. 27.)
An alternative to laser photodissociation in FTMS is to take advantage of the photon flux of the blackbody field generated by the vacuum chamber walls. The blackbody IR radiative dissociation (BIRD) method has been applied to a range of both small (28, 29) and large molecules (30–33).
With BIRD, ions are trapped in the FTMS cell for long times (10–1000 s) and thereby interact with the blackbody radiation field. Ions absorb and emit photons at rates that depend on both the ion structure and the vacuum chamber temperature. Dissociation rates can be readily varied by changing the temperature. This dissociation method can be simply implemented (by heating the vacuum chamber), has no blind spots, allows fragment ions to remain on-axis so that they can be readily detected, and favors low-energy dissociation processes that result in simplified dissociation spectra For many ions, the only loss that occurs is structurally uninformative small neutral molecules, such as water or ammonia (31). However, structurally useful backbone cleavages are typically observed for higher charge states of peptides and proteins (30–33).
For example, dissocial ion of ubiquitin molecular ions results in backbone cleavage only after acidic residues in the protein (33). The specificity of these cleavages in the gas phase are analogous to the specificity of proteolytic enzymes in solution. Dissociation efficiencies of 100% can be readily achieved. The efficiency of BIRD depends only on the temperature of the vacuum chamber and the ion storage time.
A key advantage of BIRD is that ions can be prepared with well-characterized internal energy distributions. Under readily achievable experimental conditions, large ions can equilibrate with the blackbody radiation field and have internal energies given by a Boltzmann distribution (32). From the temperature dependence of the unimolecular dissociation rate constants, information about dissociation energetics and mechanisms can be obtained.
This is illustrated in Figure 5, which shows BIRD spectra for the (M + 5H)5+ and (M + 11H)11+ charge states of the protein ubiquitin (32). At low temperatures, dissociation of the (M + 5H)5+ ion is kinetically favored; at high temperatures, the (M + 11H)11+ ion falls apart more readily. The (M + 11H)11+ and (M + 5H)5+ ions have Arrhenius activation energies of 1.6 and 1.2 eV, respectively. Thus, the more highly charged ion has a higher activation energy for dissociation, despite its increased coulomb repulsion! These and other results indicate that ion conformation plays a significantly greater role in the dissociation of this protein than do any effects of coulomb repulsion in lowering bond dissociation energies (32, 33).
Figure 5. Blackbody IR radiative dissociation spectra of ubiquitin.
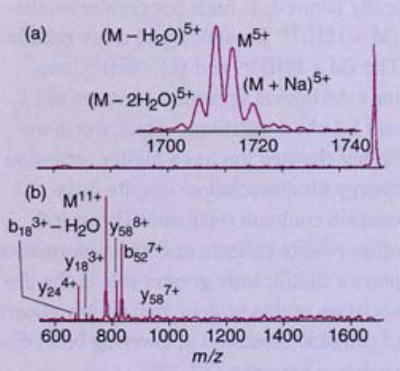
(a) (M + 11H)11+ and (b)(M + 5H)5+ ions taken from a series of measurements at delay tirnes. (Adapted from Ref. 32.)
From the Arrhenius pre-exponential factors obtained from BIRD of large ions, information about the dissociation mechanisms can be deduced. These pre-exponential factors for the (M + 11H)11+ and (M + 5H)5+ ions of ubiquitin are 1017 and 1012 s−1, respectively (32). The former value is consistent with an entropically favored direct bond cleavage, the latter, a simple rearrangement reaction. These results clearly demonstrate that relative dissociation efficiencies under one set of conditions cannot be used to determine energetics unless information about the dissociation mechanism is known.
Application of BIRD to noncovalent complexes appears to be particularly promising. Binding energies of gas-phase complexes can be accurately measured and compared with those in solution. Differences in gas-phase and solution-phase values should provide information about the role of water in the binding interactions in large biomolecule complexes. Activation energies for the dissociation of the heme group in holo-myoglobin have been measured and were found to depend on the solution-phase composition from which the ions are formed. Thus, these ions retain a clear “memory” of their solution-phase conformation and the differences can be probed by gas-phase dissociation experiments (34).
Recent BIRD results with small DNA duplexes indicate that the Watson–Crick base pairing that is critical in the solution-phase stability of these duplexes also exists in the gas phase (35). Other results indicate that relative dissociation efficiencies of carbonic anhydrase complexes obtained by SORI-CAD are not related to binding energies in solution (36). Further study of the extent to which gas-phase and solution-phase structures and noncovalent complex binding energies are related is clearly an area that could have exciting developments.
Database searching.
Although obtaining complete sequence information from large proteins solely by MS/MS remains a difficult challenge, even extremely limited sequence information can be used to unambiguously identify an unknown protein by comparing the known sequence information with that in a protein database.
Using sequence information obtained directly by MS/MS of four proteins with molecular weights between 8 and 43 kDa, Morte et al. successfully retrieved the correct protein from a nonredundant database containing 180,000 unique protein sequences (37). This method relies on obtaining one or more fragment ions corresponding to cleavage of the protein backbone at adjacent residues. The difference in mass between these fragments can identify the amino acid. For example, a 129.06 Da mass difference corresponds to glutamic acid. The mass of the fragment then indicates the mass of the sequence to either the C or N terminus. Higher specificity can be obtained by increasing the number of residues in the internal part of the sequence and by combining the information from several different internal sequences.
The results with the four proteins were obtained using a mass restriction of ± 2 Da; improved mass accuracy obtainable by FTMS (<0.1 Da) could provide even more specificity for database searches (37). Such searching could retrieve the correct protein, even if it has been post-translationally modified and no longer has the same molecular weight as the reference protein in the database. This method will likely become critical for the use of MS in proteomic research.
Ion-molecule reactions
H/D exchange.
H/D exchange experiments in solution are commonly used to obtain information about the conformation of biomolecules. Similarly, gas-phase H/D exchange experiments have produced clear evidence for multiple conformations of proteins in the absence of water. For example, McLafferty and co-workers found evidence for at least six different gas-phase conformations of the protein cytochrome c based on different amounts of H/D exchange (38). The extent of exchange ranged from 64 to 173 out of a total of 198 exchangeable H atoms. Less exchange indicated more compact, folded structures in which the exchangeable H atoms in the interior are protected. Further evidence for both the compact and elongate cytochrome c structures has recently been observed by ion mobility measurements (39). Heating these ions with either a CO2 laser or by collisional activation results in more exchange, consistent with the protein unfolding at higher ion temperatures (38). Evidence for two different ion structures for the (M + 12H)12+ charge state of ubiquitin has also been obtained using H/D exchange (40).
Proton transfer.
With increasing charge, multiply protonated ions become more prone to proton transfer because of the increased coulomb repulsion between charges. The reactivity of these ions can be obtained by measuring rate constants for proton transfer from a multiply charged ion to a molecule of known gas-phase basicity. By using reference bases with different basicity, the apparent basicity of each individual charge state is obtained in essentially a gas-phase “titration” experiment (41). Moreover, because the proton transfer reactivity depends on the coulomb repulsion, factors that influence the repulsion, such as ion conformation, can be probed in these experiments.
For example, proton transfer rates provide evidence for multiple, distinct conformations of the protein hen egg-white lysozyme (42). These conformers include denatured or elongated forms, and compact forms with reactivities consistent with those calculated using the X-ray crystal structure. Removing protons from ions formed directly by ESI results in lower charge-state ions that can have more compact or more open structures.
In other words, removing protons in the gas phase induces a protein to fold or unfold in the complete absence of water! This same phenomenon occurs with cytochrome c as reported by McLafferty and co-workers who used H/D exchange as a probe of conformation after proton removal (38).
Recent results from Lebrilla and co-workers indicate that rates of proton transfer are influenced by the chirality of the reactant base (43). Removing protons from cytochrome c occurred at a faster rate with (R)-2-butylamine than with the S-form. These results indicate that the chirality of a protonation site in the protein can affect its chemical reactivity.
Models for the charge distribution and the mechanism for ion formation in the electrospray process have been hotly debated (1, 2). Many factors influence the extent of charging. However, gas-phase ion-molecule chemistry clearly plays a role in the appearance of electrospray mass spectra. For example, the maximum number of charges an electrospray-generated ion can retain has been correlated to the gas-phase proton reactivity of the protein and solvent from which the ion was formed (44). Further studies of the gas-phase ion chemistry of these ions should improve our fundamental understanding and knowledge of the electrospray process and, ultimately, make ESI an even more analytically useful tool.
Bridging the gap
The topics described in this Report illustrate some of the current capabilities of ESI-FTMS/FTMS for the structural characterization of large molecules. FTMS performance increases with magnetic field strength; results at 9.4 T show the theoretically predicted increase in performance over lower field instruments. Newer instruments with even higher magnetic field strength are now in operation (45).
Tandem FTMS has already been applied to a number of important analytical problems, including analyzing cellular components, locating binding sites and post-translational modifications in large molecules, and verifying sequence information. The number of new applications will undoubtedly continue to grow dramatically.
Parallel developments in both instrumentation and characterization methods will be necessary to increase the information obtainable from more complex mixtures, as well as from even larger biomolecules. A more thorough understanding of ion structure and conformation, and how these factors affect ion dissociation, will make tandem MS an even more reliable tool for obtaining structural information from unknown samples.
Knowledge of gas-phase ion conformations will improve our understanding of the role of solvents in ion structure. Extensively hydrated biomolecules can be produced by ESI; these ions, prepared with a sufficient number of attached water molecules, should have solution-phase structures (46). By investigating the chemistry of the ions at intermediate extents of hydration, the gap in our understanding between the chemistry of isolated gas-phase ions and solution-phase ions can be bridged.
Footnotes
The research at Berkeley was made possible by a talented group of students and postdocs including Clifton K. Fagerquist, Deborah S. Gross, Rebecca A. Jockusch, John S. Klassen, William D. Price, Sandra Rodriguez-Cruz, Paul D. Schnier, Eric F. Strittmatter, and Yuexing Zhao, Financial support has been provided by the National Science Foundation (CHE-9258178) and the National Institutes of Health (IR29GM50336-01A2).
References
- 1.Fenn JB, Mann M, Meng CK, Wong SF, Whitehouse CM. Science. 1989;246:64–71. doi: 10.1126/science.2675315. [DOI] [PubMed] [Google Scholar]
- 2.Kebarle P, Tang I. Anal Chem. 1993;65:927 A–86 A. [Google Scholar]
- 3.Hillenkamp F, Karas M, Beavis RC, Chait BT. Anal Chem. 1991;63:1193 A–202 A. doi: 10.1021/ac00024a002. [DOI] [PubMed] [Google Scholar]
- 4.Armentrout PB, Baer T. J Phys Chem. 1996;100:12866–77. [Google Scholar]
- 5.Dienes T, et al. Mass Spectrom Rev. 1996;15:163–211. doi: 10.1002/(SICI)1098-2787(1996)15:3<163::AID-MAS2>3.0.CO;2-G. [DOI] [PubMed] [Google Scholar]
- 6.Buchanan MV, Hettich RI. Anal Chem. 1993;65:245 A–59 A. doi: 10.1021/ac00053a001. [DOI] [PubMed] [Google Scholar]
- 7.McLafferty FW. Acc Chem Res. 1994;27:379–86. [Google Scholar]
- 8.Hofstadler SA, Laude DA. J Am Soc Mass Spectrom. 1992;3:615–23. doi: 10.1016/1044-0305(92)85002-2. [DOI] [PubMed] [Google Scholar]
- 9.Kelleher NL, Senko MW, Siegel MM, McLafferty FW. J Am Soc Mass Spectrom. 1997;8:380–83. [Google Scholar]
- 10.Marshall AG, et al. J Am Chem Soc. 1997;119:433–34. [Google Scholar]
- 11.Henry KD, McLafferty FW. Org Mass Spectrom. 1990;25:490–92. [Google Scholar]
- 12.Bruce JE, et al. J Am Chem Soc. 1994;116:7839–47. [Google Scholar]
- 13.Chen R, et al. Anal Chem. 1995;67:1159–63. [Google Scholar]
- 14.Wilm MS, Mann M. Int J Mass Spectrom Ion Processes. 1994;136:167–80. [Google Scholar]
- 15.Hofstadler SA, Severs JC, Smith RD, Swanek FD, Ewing AG. Rapid Commun Mass Spectrom. 1996;10:919–22. doi: 10.1002/(SICI)1097-0231(19960610)10:8<919::AID-RCM597>3.0.CO;2-8. [DOI] [PubMed] [Google Scholar]
- 16.Valaskovic GA, Kelleher NL, McLafferty FW. Science. 1996;273:1199–202. doi: 10.1126/science.273.5279.1199. [DOI] [PubMed] [Google Scholar]
- 17.Williams ER, Henry KD, McLafferty FW. J Am Chem Soc. 1990;112:6157–62. [Google Scholar]
- 18.Campbell VI, Guan Z, Laude DA. J Am Soc Mass Spectrom. 1995;6:564–70. doi: 10.1016/1044-0305(95)00230-B. [DOI] [PubMed] [Google Scholar]
- 19.Gauthier JW, Trautman TR, Jacobson DB. Anal Chem Acta. 1991;246:211–25. [Google Scholar]
- 20.Senko MW, Speir JP, McLafferty FW. Anal Chem. 1994;66:2801–08. doi: 10.1021/ac00090a003. [DOI] [PubMed] [Google Scholar]
- 21.Wu Q, Van Orden S, Cheng X, Bakhtiar R, Smith RD. Anal Chem. 1995;67:2498–509. doi: 10.1021/ac00110a027. [DOI] [PubMed] [Google Scholar]
- 22.O’Connor PB, Speir JP, Senko MW, Little DP, McLafferty FW. J Mass Spectrom. 1995;30:88–93. [Google Scholar]
- 23.Wood TD, Chen LH, White CB, Babbitt PC, Kenyon GL, McLafferty FW. Proc Natl Acad Sci, USA. 1995;92:11451–55. doi: 10.1073/pnas.92.25.11451. [DOI] [PMC free article] [PubMed] [Google Scholar]
- 24.Cheng X, et al. J Am Chem Soc. 1995;117:8859–60. [Google Scholar]
- 25.Chorush RA, Little DP, Beu SC, Wood TD, McLafferty FW. Anal Chem. 1995;67:1042–46. doi: 10.1021/ac00102a004. [DOI] [PubMed] [Google Scholar]
- 26.Little DP, Speir JP, Senko MW, O’Connor PB, McLafferty FW. Anal Chem. 1994;66:2809–15. doi: 10.1021/ac00090a004. [DOI] [PubMed] [Google Scholar]
- 27.Little DP, Aaserud DJ, Valaskovic GA, McLafferty FW. J Am Chem Soc. 1996;118:9352–59. [Google Scholar]
- 28.Dunbar RC, McMahon TB, Tholmann D, Tonner DS, Salahub DR, Wei D. J Am Chem Soc. 1996;117:12819–25. [Google Scholar]
- 29.Price WD, Schnier PD, Williams ER. J Phys Chem B. 1997;101:664–73. doi: 10.1021/jp9628702. [DOI] [PMC free article] [PubMed] [Google Scholar]
- 30.Price WD, Schnier PD, Williams ER. Anal Chem. 1996;68:859–66. doi: 10.1021/ac951038a. [DOI] [PubMed] [Google Scholar]
- 31.Schnier PD, Price WD, Jockusch RA, Williams ER. Am Chem Soc. 1996;118:7178–89. doi: 10.1021/ja9609157. [DOI] [PMC free article] [PubMed] [Google Scholar]
- 32.Price WD, Schnier PD, Jockusch RA, Strittmatter EF, Williams ER. J Am Chem Soc. 1996;118:10640–44. doi: 10.1021/ja961812r. [DOI] [PMC free article] [PubMed] [Google Scholar]
- 33.Jockusch RA, Schnier PD, Price WD, Strittmatter EF, Demirev PA, Williams ER. Anal Chem. 1997;69:1119–26. doi: 10.1021/ac960804q. [DOI] [PMC free article] [PubMed] [Google Scholar]
- 34.Gross DS, Zhao Y, Williams ER. J Am Soc Mass Spectrom. 1997;8:519–24. doi: 10.1016/S1044-0305(97)00010-X. [DOI] [PMC free article] [PubMed] [Google Scholar]
- 35.Schnier, P. D.; Klassen, J. S.; Strittmatter, E. F.; Williams, E. R., J. Am. Chem. Soc., submitted. [DOI] [PMC free article] [PubMed]
- 36.Wu Q, Gao J, et al. Am Chem Soc. 1997;119:1157–58. [Google Scholar]
- 37.Mortz E, et al. Proc Natl Acad Sci, USA. 1996;93:8264–67. [Google Scholar]
- 38.Wood TD, Chorush RA, Wampler FM, Little DP, O’Connor PB, McLafferty FW. Proc Natl Acad Sci, USA. 1995;92:2451–54. doi: 10.1073/pnas.92.7.2451. [DOI] [PMC free article] [PubMed] [Google Scholar]
- 39.Shelimov KB, Clemmer DE, Hudgins RR, Jarrold MF. J Am Chem Soc. 1997;119:2240–48. [Google Scholar]
- 40.Cassady CJ, Carr SR. J Mass Spectrom. 1996;31:247–54. doi: 10.1002/(SICI)1096-9888(199603)31:3<247::AID-JMS285>3.0.CO;2-L. [DOI] [PubMed] [Google Scholar]
- 41.Williams ER. J Mass Spectrom. 1996;31:831–42. doi: 10.1002/(SICI)1096-9888(199608)31:8<831::AID-JMS392>3.0.CO;2-7. [DOI] [PMC free article] [PubMed] [Google Scholar]
- 42.Gross DS, Schnier PD, Rodriguez-Cruz SE, Fagerquist CK, Williams ER. Proc Natl Acad Sci, USA. 1996;93:3143–48. doi: 10.1073/pnas.93.7.3143. [DOI] [PMC free article] [PubMed] [Google Scholar]
- 43.Camara E, Green MK, Penn SG, Lebrilla CB. J Am Chem Soc. 1996;118:8751–52. [Google Scholar]
- 44.Schnier PD, Gross DS, Williams ER. J Am Soc Mass Spectrom. 1995;6:1086–97. doi: 10.1016/1044-0305(95)00532-3. [DOI] [PubMed] [Google Scholar]
- 45.Marshall AG, Guan SH, Eyler JR. Rapid Commun Mass Spectrom. 1996;10:1814–18. doi: 10.1002/(SICI)1097-0231(199611)10:14<1855::AID-RCM764>3.0.CO;2-B. [DOI] [PubMed] [Google Scholar]
- 46.Rodriguez-Cruz SE, Klassen JS, Williams ER. J Am Soc Mass Spectrom. 1997;8:565–68. doi: 10.1016/S1044-0305(99)00068-9. [DOI] [PMC free article] [PubMed] [Google Scholar]


