

Abstract
Background
Phenylthiocarbamide (PTC) and 6-n-propylthiouracil (PROP), chemically related compounds, are probes for genetic variation in bitter taste, although PROP is safer with less sulfurous odor. Threshold for PROP distinguishes nontasters (increased threshold) from tasters (lower threshold); perceived intensity subdivides tasters into medium tasters (PROP is bitter) and supertasters (PROP is very bitter). Compared with supertasters, nontasters have fewer taste papillae on the anterior tongue (fungiform papillae) and experience less negative (e.g., bitterness) and more positive (eg, sweetness) sensations from alcohol. We determined whether the TAS2R38 gene at 7q36 predicted PROP bitterness, alcohol sensation and use.
Methods
Healthy adults (53 women, 31 men; mean age 36 years)—primarily light and moderate drinkers—reported the bitterness of five PROP concentrations (0.032–3.2 mM) and intensity of 50% ethanol on the general Labeled Magnitude Scale. PROP threshold and density of fungiform papillae were also measured. Subjects had common TAS2R38 gene haplotypes [alanine-valine-isoleucine (AVI) and proline-alanine-valine (PAV)].
Results
PROP bitterness varied significantly across genotypes with repeated measures ANOVA: 26 AVI/AVI homozygotes tasted less bitterness than either 37 PAV/AVI heterozygotes or 21 PAV/PAV homozygotes. The PAV/PAV group exceeded the PAV/AVI group for bitterness only for the top PROP concentrations. The elevated bitterness was musch less than if we defined the groups using psychophysical criteria. With multiple regression analyses, greater bitterness from 3.2 mM PROP was a significant predictor of greater ethanol intensity and less alcohol intake—effects separate from age and sex. Genotype was a significant predictor of alcohol intake, but not ethanol intensity. With ANOVA, AVI/AVI homozygotes reported higher alcohol use than either PAV/AVI heterozygotes or PAV/PAV homozygotes. When age effects were minimized, PROP bitterness explained more variance in alcohol intake than did the TAS2R38 genotype.
Conclusions
These results support taste genetic effects on alcohol intake. PROP bitterness serves as a marker of these effects.
Keywords: Taste, Alcohol Consumption, Genetics, PTC/PROP Bitterness, TAS2R38
STRONG SUPPORT EXISTS for a familial component in the etiology of alcoholism and alcohol use [see Dick and Foroud (2003) for review]. Twin studies show that the heritability of alcoholism ranges from 50 to 60% (Heath et al., 1997) and that genetic influences can explain a 5-fold difference in alcohol use among adolescents in alcohol-predisposing environments (Dick et al., 2001). Genetic risk for alcoholism is complex; several different genes undoubtedly exert effects on the rewarding influence of drinking alcohol, on the metabolic tolerance of alcohol overconsumption, on brain systems that respond to reward, and on response to alcohol withdrawal (Crabbe, 2002). Specific gene mechanisms have been linked to, for example, the metabolism of alcohol via alcohol dehydrogenase (Mulligan et al., 2003; Osier et al., 1999) and aldehyde dehydrogenase (Oota et al., 2004), as well as dependence via γ-aminobutyric acid receptors (Song et al., 2003). The purpose of this study was to examine the association between genetic variation in taste and alcohol use in a group of reportedly healthy young adults.
Genetic variation in taste influences the sensations from alcoholic beverages and could be one of the genetic factors that interacts with environmental factors to determine the risk of alcohol overconsumption, as suggested by models of gene-environment interaction (Heath and Nelson, 2002). The ability to taste the bitterness of phenylthiocarbamide (PTC) and 6-n-propylthiouracil (PROP), which share an
 group, is a well documented phenotypic polymorphism. The distribution of thresholds for PTC or PROP tasting is bimodal: “nontasters” have increased thresholds (low sensitivity), and “tasters” have lower thresholds (higher sensitivity). Family studies have generally supported the model that tasting was a dominant trait and nontasting a recessive trait (Blakeslee, 1932; Snyder, 1931).
An important gene contributing to PTC perception has been identified (Kim et al., 2003). The gene (TAS2R38), located on chromosome 7q36, is a member of the bitter taste receptor family. There are two common molecular forms [proline-alanine-valine (PAV) and alanine-valine-isoleucine (AVI)] of this receptor defined by three nucleotide polymorphisms that result in three amino acid substitutions: Pro49Ala, Ala262Val, and Val296Ile. The ancestral human haplotype at these three amino acids—determined by sequencing DNA from several other ape species, an old world monkey, and a new world monkey—is PAV (Kim et al., 2003; Wooding et al., 2004). This molecular form is common in humans and is associated with tasting; the other common form, the triply derived molecular form, AVI, is associated with nontasting. Three other haplotypes have been observed: AAV, AAI, and PVI. The original report (Kim et al., 2003) studied 200 Europeans and 118 individuals from other regions.
Historically, researchers have used detection thresholds to classify individuals as nontasters or tasters of these bitter compounds (e.g., Fox, 1931; Harris and Kalmus, 1949). Fischer and Griffin (1964) replaced PTC with its chemical relative PROP, which lacks the sulfurous odor of PTC and may be less toxic (Barnicot et al., 1951; Lawless, 1980). Insensitivity to PTC or PROP is estimated at 30% in European populations, although the percentages vary with sex and among ethnic groups globally (Bartoshuk et al., 1994; Guo and Reed, 2001).
The taster group shows significant variability in the perceived bitterness of PROP. Although threshold measures may be used to separate individuals with low thresholds (tasters) from individuals with increased thresholds (nontasters), subsequent work by Bartoshuk et al. (1994) identified two distinct populations within the taster group. By comparing the perceived intensity of concentrated PROP, the taster group is subdivided into those who taste concentrated PROP (3.2 mM) as “strongly” bitter (medium tasters) and those who taste PROP as greater than “very strongly” bitter (supertasters) (Bartoshuk et al., 1994). Supertasters cannot be identified via thresholds, because the distributions between those who are sensitive and extremely sensitive to PROP overlap (Reed et al., 1995). Supertasters differ from medium tasters and nontasters in the number of taste papillae on the anterior tongue (fungiform papilla); PROP supertasters have, on average, the most fungiform papillae and taste buds as assessed with videomicroscopy (Bartoshuk et al., 1994). A positive relationship between PROP bitterness and fungiform papillae number is also observed by using lower magnification for papillae counting (Delwiche et al., 2001; Tepper and Nurse, 1997). Supertasting may result from an anatomical difference related to the density of fungiform papillae on the tongue, as well as an allelic variation of TAS2R38 that results in the presence or absence of a functional receptor, as proposed by Bartoshuk et al. (2001) and as supported by data shown in this article. The genetic control of fungiform papilla density is unknown.
The perceived bitterness of PROP is correlated with unpleasant and pleasant sensations from alcohol. Those who taste PROP as more bitter also report ethanol (Bartoshuk et al., 1993; Duffy et al., 2004; Prescott and Swain-Campbell, 2000), some types of beer (Intranuovo and Powers, 1998), scotch (Lanier et al., 2004), and red wines (Pickering et al., 2004) as more bitter or irritating. Nontasters not only perceive scotch as less bitter but also as more sweet than do supertasters (Lanier et al., 2005). The density of fungiform papillae can explain some of the oral sensory differences associated with PROP tasting, as first suggested by Miller and Reedy (1990). The taste buds are surrounded by fibers of the trigeminal nerve (cranial nerve V), which are believed to mediate oral burn (Finger et al., 1994; Whitehead et al., 1985; Whitehead and Kachele, 1994). It is interesting to note that sucrose and ethanol stimulate similar central brain centers in rats (Lemon et al., 2004) and that ethanol stimulates taste nerve fibers responsive to sucrose in primates (Hellekant et al., 1997).
Supertasters may have an inherent sensory aversion to consuming alcoholic beverages with high levels of ethanol and a pronounced alcohol flavor. Young adults who taste PROP as more bitter have been found to consume less beer (Guinard et al., 1996), including during their first year of drinking (Intranuovo and Powers, 1998). In young adults who were not college undergraduates, we found that PROP supertasters reported consuming alcoholic beverages less frequently than did nontasters (Duffy et al., 2004), a finding that was also seen in preliminary data in adults (primarily men) recruited through an industrial worksite wellness program (Hutchins et al., 2002). Not all studies, however, find associations between PROP bitterness and alcohol intake (e.g., Mattes and DiMeglio, 2001).
The literature is inconsistent with respect to a relationship between PROP tasting and risk of alcoholism. In studies with alcoholics compared with controls, some report an excess of nontasters among alcoholics (DiCarlo and Powers, 1998; Peeples, 1962; Spiegel, 1972), whereas other studies do not (Reid et al., 1968; Smith, 1972; Swinson, 1973). In studies examining family history of alcoholism, Pelchat and Danowski (1992) found significantly more PROP nontasters among children of alcoholics than among children of nonalcoholics, whether or not the children themselves were alcoholic. Kranzler and colleagues, however, were unable to show a significant relationship between PROP threshold and parental history of alcohol dependence in nonalcoholic young adults (Kranzler et al., 1998) or in those with alcohol dependency (Kranzler et al., 1996). One study found comorbidity between depression and alcoholism in college students who reported PROP as very bitter (DiCarlo and Powers, 1998).
Some of the inconsistencies in PROP effects on alcohol consumption behaviors could relate to the measurement of PROP tasting. A number of studies relating alcohol-ingestive behaviors to PROP have relied on a threshold procedure (Kranzler et al., 1996, 1998; Peeples, 1962; Pelchat and Danowski, 1992; Spiegel, 1972), which, because it cannot identify supertasters (Bartoshuk et al., 1994), has the potential to fail to find PROP effects. In fact, we reported positive and significant associations between the frequency of consuming alcoholic beverages and PROP bitterness, but not PROP threshold (Duffy et al., 2004). Distinguishing PROP supertasters from medium tasters and nontasters requires valid scaling methods, as reviewed previously (Bartoshuk et al., 2002b, 2004a,Bartoshuk et al., b).
Discovery of allelic variation in TAS2R38, the gene for the PTC receptor, presented the opportunity for examining its ability to predict the oral sensation from an ethanol probe and the frequency of consuming alcoholic beverages in a sample of healthy adults who were recruited into a study of taste genetics and dietary behaviors and who reported consuming alcoholic beverages. Analysis of these data showed that genotype predicts PROP bitterness and, because of its association with PROP bitterness, predicts alcohol intake. However, genotype fully accounts neither for supertasting nor for some of the oral sensations from alcohol.
METHODS
Subjects and Procedure
A convenience sample of reportedly healthy adults was recruited into an observational study to test the relationship between genetic variation in taste and dietary behaviors. A telephone screening and the first visit served to recruit healthy adults who did not smoke tobacco or have a high level of dietary restraint, as described previously (Duffy and Bartoshuk, 2000; Duffy et al., 2004). Of the potential 94 subjects, 4 with uncommon haplotypes and 6 non–alcohol drinkers were removed from the dataset. Eighty-four subjects (53 women and 31 men) with an age (mean ± SD) of 36 ± 13 years (range, 21–59 years) participated in 2 or 3 visits to the taste laboratory to collect the data reported in this article, with a separate visit to draw blood samples for genotyping. The only exception was that the PROP threshold was available for only 48 of the 84 subjects.
The sample was primarily of European ancestry, according to their responses to the following categories: 72 Caucasians, 4 Asians, 1 African American, 6 Hispanics, and 1 Asian Indian. The University of Connecticut and Yale University Institutional Review Boards approved all study procedures. Subjects gave written consent and were paid for their participation.
Subjects rated the intensity of oral stimuli on a computer that displayed the general Labeled Magnitude Scale (gLMS) (Bartoshuk et al., 2002a,b), an adjective-labeled ratio scale labeled as 0 for no sensation and 100 (at the top) for the “strongest imaginable sensation of any kind.” Intermediate-intensity descriptors were located at “barely detectable” (1.4), “weak” (6), “moderate” (17), “strong” (35), and “very strong” (53). Subjects were instructed to consider the top of the scale across all sensory domains. The ratings, thus, were not confined to the context of oral sensation, because previous research has shown that the intensity descriptors denote different absolute perceived intensities to groups who vary in their experiences with oral sensations (Bartoshuk et al., 2002b). To restrict the ratings just to an oral sensory domain would violate the assumption that the adjectives applied to oral sensation denote the same perceived intensities to all. Subjects pointed and clicked with the computer mouse to the location on the gLMS that represented the intensity of the sensation. A BASIC program (Microsoft BASIC, version 2.43; Microsoft, Redmond, WA) converted the response into a whole number visible to the subject. The experimenter was present to provide the samples and to record the intensity ratings.
Alcohol Sensory Intensity
During two visits, subjects rated the intensity of the 50% ethanol probe applied to the left tip of the tongue with a cotton-tipped applicator. The probe was selected as a measure of alcohol irritation and was prepared from dehydrated 200-proof ethyl alcohol diluted to 50% (v/v) with deionized water. Subjects extended their tongues, and the alcohol was swabbed onto the left anterior tongue. They were asked to keep their tongues extended and wait until the burning sensation had reached the strongest point before making their ratings. The mean of the two intensity ratings was used in the analysis.
PROP Tasting
Threshold
A PROP threshold test was available on the first 48 of 84 subjects who participated in the study. In these subjects, testing was completed on the first day. The threshold was related to the PTC genotype for comparison with the data reported by Kim et al. (2003). A modified up-down procedure (Bartoshuk, 1978; McBurney and Collings, 1984) was used with room temperature solutions ranging in quarter-log steps from 0.001 to 3.2 mM reagent-grade PROP dissolved in deionized water (Picotech System; Hydro, Garfield, NJ; 18 MΩ/ml). Subjects tasted two 10-ml samples served at room temperature (one was water, and one was a given concentration of PROP). Each tasting was preceded with a water rinse. Subjects were instructed to choose the sample with the stronger taste. With one correct choice, the same PROP concentration was presented again. After two correct choices, the next lower concentration was presented (a reversal). With one incorrect choice, the next highest concentration was presented (a reversal). The threshold was considered to be the geometric mean of the second through seventh reversals. A taster threshold was ≤0.1 mM, and a nontaster threshold was ≥0.2 mM PROP.
Perceived Intensity
On the final day of testing, at the end of the session, all subjects rated the intensity of PROP with a protocol that included intensity ratings of NaCl and 1000-Hz tones (Bartoshuk et al., 1994). Taste stimuli were presented in half-log steps: five NaCl solutions (from 0.01 to 1 M) and five PROP solutions (from 0.032 to 3.2 mM). Tones were presented in 12-dB steps (from 50 to 98 dB). Blocks of stimuli were presented in the following order: tones, NaCl, tones, NaCl, tones, PROP, tones, PROP, tones. The stimuli were randomized within each block. The PROP ratings were analyzed as raw gLMS ratings. NaCl and tones have been used as sensory standards to normalize the oral sensory data, but because raw and normalized data produce similar results (Duffy et al., 2004), this study used raw gLMS ratings.
Fungiform Papilla Number
By following a procedure similar to the method of Miller and Reedy (1990), the number of fungiform papillae on the right and left anterior tongue tip was determined with videomicroscopy. This procedure took place on the last day of testing. The subject’s tongue was painted with blue food coloring to contrast between stained filiform and unstained fungiform papillae. Subjects held their tongue tip between two plastic slides attached to each other with screws. With a Zeiss (Jena, Germany) operating microscope, magnification (× 15) allowed fungiform papillae to be easily distinguished from filiform papillae, which contain no taste buds. The images were recorded for 3 to 5 min to allow subsequent counting of the fungiform papillae in a 6-mm-diameter circle on right and left tongue tips on a high-resolution monitor. The average of counts from the two sides was used to compare with the alcohol sensory and intake measures.
Alcohol Intake
Yearly intake of beer, wine or wine coolers, and liquor or mixed drinks was assessed by using the Block Food Survey (Berkley Nutrition Services, 2000; Block et al., 1986), version 98.1. A registered dietitian interviewed each subject on the first or second day of testing by using this survey, and subjects reported how often they consumed each beverage (categories range from “never” to “every day”) and the amount consumed per time interval (e.g., glass, bottle, and drink and the size of the serving). Categories were coded to a number of drinks per year as follows: “few times per year” as 4 drinks, “once per month” as 12 drinks, “2–3 times per month” as 30 drinks, “once per week” as 52 drinks, “2 times per week” as 104 drinks, “3–4 times per week” as 182 drinks, “5–6 times per week” as 286 drinks, and “every day” as 365 drinks. Subjects reported consuming alcoholic beverages at least a “few times per year.” For each time, the number of servings of alcoholic beverage consumed was recorded. The total alcohol intake was the sum of the yearly intakes of beer, wine, and liquor.
TAS2R38 Gene Analyses
A trained phlebotomist drew blood samples from subjects in a visit that involved only drawing the blood samples. DNA was extracted from whole-blood samples that had been stored at subzero (−60°C) freezer temperatures with standard methods that generally followed the manufacturer’s instructions (Gentra, Minneapolis, MN), with occasional modification required for old, lysed samples. Purified DNA samples were stored at 4°C in Tris 10 mm; EDTA 1 mm (TE) until analyzed. Samples were analyzed by using the 5′-exonuclease reaction (TaqMan) with assays provided by Applied Biosystems (assay numbers C_9506826, C_9506827, and C_8876467; Foster City, CA) in 384-well format and read on an ABI Prism 9700 (Applied Biosystems, Foster City, CA). Samples that failed to give a clean genotype were repeated once.
Statistical Analyses
Data were analyzed with Statistica (Macintosh version 4.1, StatSoft, Tulsa, OK). The criterion for significance was p ≤ 0.05. Standard multiple regression analyses were used to predict the alcohol sensory and intake data from the taste phenotype, TAS2R38 genotype, sex, and age. Two levels of prediction were completed. The first used only the phenotype (PROP intensity and fungiform papillae number), age, and sex to predict alcohol sensation and intake. The second used the genotype, age, sex, and fungiform papillae number to predict the alcohol data. PROP intensity was not included because of the covariance with the genotype. Skewed variables were transformed to improve the normality of the distribution for this statistical procedure (Tabachnick and Fidell, 2001). Univariate and multivariate outliers were removed by the standardized residual (≥ 2.5) and the Mahalanobis distance criteria (critical χ2 table with p < 0.001; degrees of freedom are the number of independent variables) (Tabachnick and Fidell, 2001). The “Results” section presents the multiple regression coefficient (r) and semipartial correlations (sr) of significant contributors to the multiple r.
The degree of difference between genotypes was examined with ANOVA by using planned comparisons with t tests and the error term generated by the ANOVA (Keppel, 1991), as well as the χ2 statistic. Kendall’s τ statistic, which accounted for ties, was used to test the level of association between ranking individuals by genotype (AVI/AVI, PAV/AVI, and PAV/PAV) and phenotype according to the bitterness of 3.2 mM PROP (nontasters, medium tasters, and supertasters).
RESULTS
Relationship Between Genotype and Taste Phenotype
Individuals had only three patterns on genotyping for the three polymorphic sites: only P, A, and V present; only A, V, and I present; and both alleles present at all three sites. Given extensive population data (Bamshad et al., 2004; Kidd et al., 2004), these correspond to PAV homozygotes, AVI homozygotes, and PAV/AVI heterozygotes, respectively, with probabilities greater than 99%. The four individuals with other results were excluded from subsequent analyses, as reported previously.
Figure 1 shows the distribution of taste thresholds across genotypes. The PROP threshold was significantly different across genotypes [F(2,46) = 89.783; p < 0.0001] such that the mean threshold for the AVI homozygotes (0.579 ± 0.10 mM; mean ± SEM) was greater than for PAV/AVI heterozygotes (0.038 ± 0.001 mM), which it turn was greater than for PAV homozygotes (0.011 ± 0.003 mM). There was strong concordance between nontasters defined by PROP threshold (n = 17) and by genotype (AVI/AVI; n = 18). One individual had an AVI/AVI genotype but a taster threshold (0.0468 mM PROP).
Fig. 1.
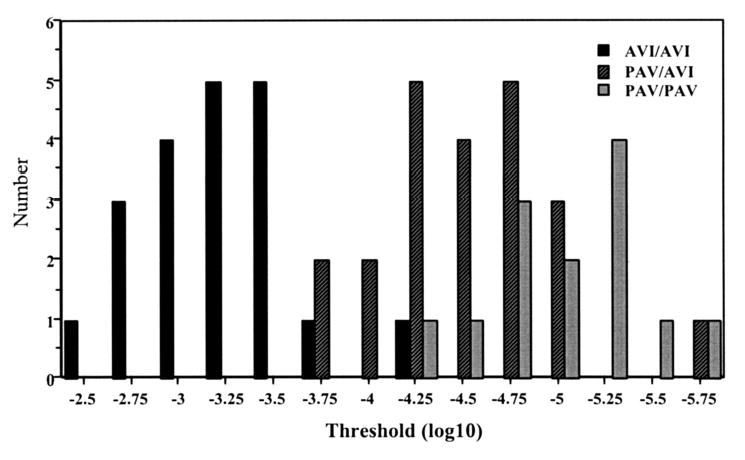
Distribution of common genotypes for the TAS2R38 gene by PROP threshold, with number of subjects (y axis) and PROP molar concentration (log10 transformed).
Figure 2 shows the PROP bitterness functions for individuals with the three common genotypes. The genotype and phenotype groups were similar for age across groups but had some variability in numbers of men and women (Table 1). The genotype × PROP intensity ANOVA showed significant main effects of genotype [F(2,81) = 28.594; p < 0.0001] and concentration [F(4,324) = 215.01; p < 0.0001] and a significant genotype × concentration interaction [F(8,324) = 14.15; p < 0.0001]. By pairwise comparisons, the three functions differ significantly for the three highest concentrations of PROP (PAV/PAV homozygotes > PAV/AVI heterozygotes > AVI/AVI homozygotes, p ≤ 0.001). However, the function for the PAV/PAV homozygotes was only slightly above that for the PAV/AVI heterozygotes. Figure 2 also shows the same subjects classified by psychophysical criteria: the 25% with the lowest ratings for 3.2 mM PROP (near saturation) were classified as nontasters, the 25% with the highest ratings were classified as supertasters, and the remaining 50% were classified as medium tasters. There was a significant correspondence between the genotype and phenotype rankings according to a Kendall’s τ of 0.46 (p < 0.01; Table 2).
Fig. 2.
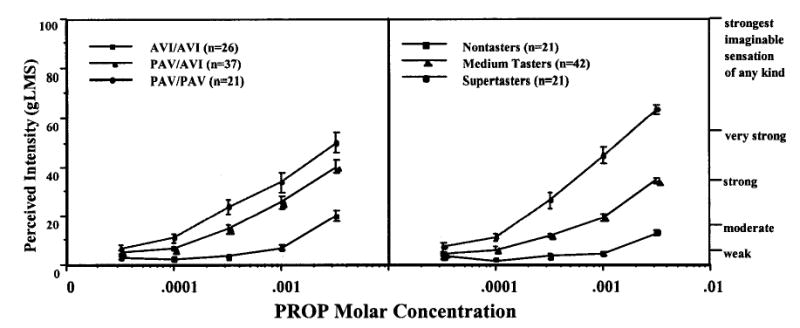
PROP bitterness functions (perceived intensity on the general Labeled Magnitude Scale by molar concentration) in genotype groups (left) and psychophysical groups defined from the bitterness of 3.2 mM PROP (right).
Table 1.
Age and Sex Breakdown for Genotype and Phenotype Groups1
| Variable | Sex (F/M) | Age, years (mean ± SEM) |
|---|---|---|
| AVI/AVI | 15/11 | 34.19 ± 2.47 |
| PAV/AVI | 21/16 | 37.41 ± 2.02 |
| PAV/PAV | 17/4 | 35.81 ± 2.87 |
| Nontasters | 13/8 | 37.43 ± 3.10 |
| Medium tasters | 27/15 | 35.64 ± 1.99 |
| Supertasters | 13/8 | 35.33 ± 2.34 |
Table 2.
| Variable | Nontasters | Medium tasters | Supertasters | n |
|---|---|---|---|---|
| AVI/AVI | 15 | 9 | 2 | 26 |
| PAV/AVI | 5 | 23 | 9 | 37 |
| PAV/PAV | 1 | 10 | 10 | 21 |
| n | 21 | 42 | 21 |
Based on the bitterness of 3.2 mM PROP (nontasters, ≤moderately bitter; supertasters, ≥very strong; and medium tasters in between).
TAS2R38 gene (Kim et al., 2003).
In a genotype × sex ANOVA, the average number of fungiform papillae did not vary significantly across genotypes. The average number was higher in women (26.48 ± 0.96; mean ± SEM) than in men (22.60 ± 1.05; t = 2.688; p < 0.01), and PAV/PAV homozygous women tended to be distributed toward more fungiform papilla than did AVI/AVI homozygous women. In χ2 analyses, PAV/PAV women tended to be in the category of ≥ 25 papillae in the 6-mm area, whereas AVI/AVI women tended to be in the category of fewer than 25 papillae (χ2 = 3.012; p = 0.08).
Via multiple regression analyses, genotype and fungiform papillae number were significant contributors to predicting PROP bitterness. The model to predict 3.2 mM PROP bitterness contained genotype, fungiform papillae number, sex, and age, yet only genotype and fungiform papillae number were significant predictors (r = 0.64; p < 0.0001; R2 = 0.41). Although genotype predicted most of the variance in PROP bitterness (sr = 0.55; p < 0.00001), the fungiform papillae number explained an additional 5% (sr = 0.21; p < 0.05).
Predicting Alcohol Sensation
The intensity of the ethanol probe averaged nearly “strong” (33.98 ± 1.91; mean ± SEM) and ranged from “weak” to above “very strong.” Phenotypical measures of taste accounted for significant variance in intensity ratings of the ethanol probe. The regression model contained the phenotypical measures (PROP bitterness and fungiform papillae), age, and sex, yet only PROP bitterness and age were significant contributors (r = −0.46; p < 0.001; R2 = 0.22). The intensity of the ethanol probe was greater in the older subjects (sr = 0.38; p < 0.001). PROP bitterness explained an additional 7% of the variance in intensity of the ethanol probe; those who tasted PROP as more bitter also reported that the probe was more intense (sr = 0.26; p < 0.01).
The genotype was not an adequate substitute for PROP bitterness in predicting the intensity of the ethanol probe. By replacing PROP bitterness with genotype in the regression model with fungiform papillae, age, and sex, only age and fungiform papillae were significant contributors (r = 0.47; p < 0.001; R2 = 0.22). The fungiform papillae number explained an additional 5% of the variance in intensity of the ethanol probe; those with the most papillae reported that the probe was the most intense (sr = 0.23; p < 0.05).
Predicting Alcohol Intake From Taste Phenotype and Genotype
Subjects reported consuming an average of 199 ± 22.35 (mean ± SEM) drinks per year (ranging from a “few times per year” to 3 drinks per day), which translates to approximately 3 to 4 drinks per week. Presented according to categories of alcohol drinking from the National Longitudinal Alcohol Epidemiologic Survey (Stinson et al., 1998), there were 40 “light drinkers” (a couple of drinks per year but fewer than 3 drinks per week), 42 “moderate drinkers” (3 to fewer than 14 drinks per week), and 2 “heavy drinkers” (2 or more drinks per day). The average yearly intake of alcoholic beverages was significantly greater in men (261.74 ± 45.00; mean ± SEM) than in women (162.19 ± 22.85; t = 2.188; p < 0.05).
By psychophysical groups according to 3.2 mM PROP bitterness, nontasters consumed 288.81 ± 64.65 drinks per year, medium tasters 188.05 ± 28.10, and supertasters 134.43 ± 21.59. In multiple regression analyses, those who tasted PROP as more bitter reported consuming less alcohol, an effect that was separate from age and sex effects on alcohol intake. In the model with phenotypical measures, sex, and age, only age and PROP bitterness were significant predictors of alcohol intake (r = 0.38; p < 0.01; R2 = 0.15). Although those who were older (sr = 0.27; p = 0.01) reported less frequent intake of alcoholic beverages, PROP bitterness predicted an additional 4.4% of the variance in intake of alcoholic beverages (sr = −0.21; p = 0.05; Fig. 3).
Fig. 3.
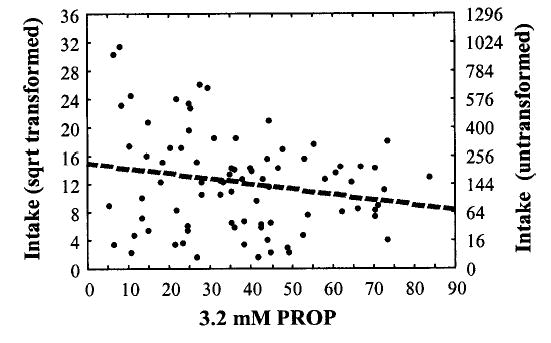
Yearly intake of alcoholic beverages by the bitterness of 3.2 M PROP rated on the general Labeled Magnitude Scale. The intake data were square root–transformed because of the positive skew. The x axis on the left is labeled as the transformed value and on the right as the untransformed value.
Genotype served as an adequate substitute for PROP bitterness in predicting alcohol intake. By replacing perceived PROP bitterness with genotype in the regression model with age and sex, only age and genotype were significant predictors (r = 0.38; p < 0.01; R2 = 0.14). The TAS2R38 genotype explained an additional 5% of the variance in alcohol intake beyond that explained by age (sr = 0.21; p = 0.05). Alcohol intake by genotype is shown in Fig. 4. ANOVA across the entire sample showed significant effects of genotype [F(2,81) = 3.60; p < 0.05]. By pairwise comparisons, the AVI/AVI homozygotes consumed significantly more alcoholic beverages (285.16 ± 55.82 drinks per year; mean ± SEM) than either the PAV/AVI heterozygotes (180.49 ± 29.32; p < 0.05) or the PAV/PAV homozygotes (132.90 ± 21.98; p = 0.01). Because two individuals in the AVI/AVI group seemed to be outliers (Fig. 4), the difference in alcohol intake between AVI/AVI homozygotes and PAV/AVI heterozygotes was tested with the χ2 statistic. Those who were PAV/AVI were significantly more likely than those who were AVI/AVI to consume 250 or less drinks per year (31 vs. 13, respectively) and were significantly less likely to consume more than 250 drinks per year (6 vs. 13, respectively; χ2 = 6.748; df = 1; p < 0.01).
Fig. 4.

Yearly intake of alcoholic beverages across the entire sample by TAS2R38 genotype groups.
Putting perceived PROP bitterness and genotype in the regression model showed that PROP bitterness exceeded the ability of genotype to predict alcohol intake. For this analysis, the effect of age on alcohol intake was minimized by only examining individuals who were ≤ 40 years old (23 women and 26 men). In multiple regression analyses with genotype, PROP bitterness, and sex in the model, only PROP bitterness contributed significantly to the prediction of alcohol intake (r = 0.46; p = 0.01; R2 = 0.21).
DISCUSSION
The TAS2R38 genotype for common haplotypes explained significant variance in the intensity of bitterness from PROP and intake of alcoholic beverages in the sample of reportedly healthy adults who were classified as primarily light and moderate drinkers. Individuals who were AVI/AVI homozygotes tasted PROP as least bitter and reported significantly greater intake of alcoholic beverages than either AVI/PAV heterozygotes or PAV/PAV homozygotes. The genotype neither explained full variability in PROP bitterness nor was a probe of alcohol sensation. Using fungiform papillae number and genotype increased the ability to predict the bitterness of PROP and the intensity from the alcohol probe.
The sample was recruited for diversity in PROP bitterness. Dividing individuals by tertiles of PROP bitterness produced a group of nontasters (n = 21) to whom PROP was less than “moderately” bitter, a group of medium tasters (n = 42) to whom PROP tasted “strongly” bitter, and a group of supertasters (n = 21) to whom PROP tasted “very strongly” bitter. A similar distribution of common genotypes of the TAS2R38 gene was observed: 26 AVI/AVI homozygotes (31%), 37 PAV/AVI heterozygotes (44%), and 21 PAV/PAV homozygotes (25%). However, the PROP bitterness functions by genotype were not as distinct as those divided by phenotype (Fig. 2). The PAV/AVI heterozygotes had steeper bitterness functions than the medium tasters, and the PAV/PAV homozygote functions were less steep than the supertasters’. With multiple regression analyses, the number of fungiform papillae and genotype were separate predictors of PROP bitterness. Supertasting thus seems to result from both homozygosity at TAS2R38 and at least one other genetic determinant, such as that determining the density of fungiform papillae. PROP bitterness also differs between men and women (Bartoshuk et al., 1994; Prutkin et al., 2000) and with exposure to taste-related pathology (Bartoshuk et al., 1995). Thus, PROP bitterness responses likely result from a functional receptor that responds specifically to PROP, the fungiform papilla density, and a number of factors not directly related to genetic endowment (e.g., taste-related pathology). In addition, a formal possibility is regulatory variation of TAS2R38 such that more receptors are produced to increase the taste responsiveness. To date, no regulatory variation has been identified because the regions that regulate expression of the gene are not fully defined.
This study seems to be the first to report on the association between TAS2R38 gene and fungiform papilla density. The genotype did not account for differences in number of fungiform papillae across the entire sample, although there was a trend for PAV/PAV women to have a higher density of fungiform papillae than AVI/AVI women. Ample evidence exists for an association between PROP bitterness and fungiform papillae number; individuals who taste PROP as more bitter have, on average, more fungiform papillae numbers those for whom PROP is less bitter, as assessed with videomicroscopy (Bartoshuk et al., 1994; Miller and Reedy, 1990) and by counting with handheld magnification (Delwiche et al., 2001; Tepper and Nurse, 1998). The present dataset may have been too small to detect an association between TAS2R38 genotype and fungiform papillae. However, it is unknown whether the TAS2R38 gene should be associated with fungiform papilla density. Because the TAS2R38 gene codes for a receptor that responds to compounds with the
, it is uncertain why fungiform papilla density would associate with the presence or absence of the ability to taste PTC/PROP. The lack of knowledge on the location of genes that mediate fungiform density also makes specific genetic linkages uncertain.
Intensity from the alcohol probe was predicted by either PROP bitterness or the number of fungiform papillae, but not by genotype. This probe likely stimulated burning but also could have stimulated taste sensations of bitterness (Bartoshuk et al., 1993; Pickering et al., 2004; Prescott and Swain-Campbell, 2000) or sweetness, as shown in rats (Lemon et al., 2004) and in primates (Hellekant et al., 1997). The lack of association between alcohol intensity and genotype suggests that the TAS2R38 gene codes for the receptor that responds to PTC and chemically related compounds, but not for perceived irritation. Fungiform papillae are innervated by taste and oral somatosensory nerves—this indicates that responses to alcohol sensation on the tongue tip are related to PROP bitterness and the number of fungiform papillae (Duffy et al., 2004).
The relationship between genotype and alcohol intake is probably mediated through the bitterness of PROP. PROP bitterness is associated with oral sensations from alcohol, including bitterness, irritation/astringency (Bartoshuk et al., 1993; Pickering et al., 2004; Prescott and Swain-Campbell, 2000), and sweetness (Lanier et al., 2005). Individuals who taste PROP as most bitter may experience more negative oral sensations from alcoholic beverages (e.g., bitterness and irritation) and fewer positive sensations (e.g., sweetness) as a sensory hindrance for overconsumption, as suggested by data from our laboratory (Duffy et al., 2004) and others (Guinard et al., 1996; Intranuovo and Powers, 1998). Thus, the relationship between genotype and alcohol intake serves to verify the results of PROP relations with alcohol intake.
Associations between the TAS2R38 gene and alcohol drinking add to the evidence of genetic influences on alcohol use and suggest a new region that might be related to oral sensory motivations to drink alcohol. Genome-wide scans link maximum alcohol consumption with gene regions on chromosome 9 (9q21.11) (Bergen et al., 2003). Alcohol dependence defined by clinical criteria and family history has been linked through a genome-wide scan by the Collaborative Study on the Genetics of Alcoholism to regions on chromosomes 1 and 7, with some evidence for regions on chromosomes 2 and 3 (Foroud et al., 2000). The Collaborative Study on the Genetics of Alcoholism data confirm earlier findings of Reich et al. (1998) with linkages on chromosomes 1, 2, and 7. The TAS2R38 gene location on chromosome 7 (7q36) is unlinked to the loci for alcohol dependence (7p12.3). Regions on chromosome 7 identified with alcohol dependence are near the markers D7S1793 (Reich et al., 1998), D7S821, D7S1830, and D7S1797 (Foroud et al., 2000). Nonetheless, as discussed by Foroud et al. (2000), multiple loci on chromosome 7 may influence susceptibility to alcoholism. Thus, genetic control of alcohol behaviors, involving bingeing (i.e., maximal drinking) and alcohol dependence, may not be linked to those that involve alcohol preference.
Alcohol sensations and intake showed interesting age relationships within this sample. The intensity of the alcohol probe showed age-related increases. Interactions between taste and trigeminal innervation on the tongue tip may offer one explanation for this age-related increase in alcohol intensity. The probability of exposure to conditions that can damage taste on the anterior tongue increases with aging. The chorda tympani branch of cranial nerve VII mediates taste on the anterior tongue. Taste from the chorda tympani nerve is depressed with a history of diseases such otitis media and head trauma (Bartoshuk et al., 1995). Decreased taste on the anterior tongue can remove the usual inhibition that taste has on trigeminal sensations from the anterior tongue, as seen in experimental evidence with temporary anesthesia of the chorda tympani nerve (Tie et al., 1999) and oral pain phantoms arising from the anterior tongue (Grushka and Bartoshuk, 2000). Thus, the increased intensity from the alcohol probe in the older subjects could have resulted from changes in the interactions between taste and trigeminal sensations. Our sample showed age-related decreases in consumption of alcoholic beverages, a finding that parallels that seen in national statistics from the Behavioral Risk Factor Surveillance System for 1994 to 1997 and from the National Health Interview Survey (Kamimoto et al., 1999). Thus, increased intensity from alcohol, such as increased burn or astringency, could also serve as a sensory hindrance for overconsuming alcoholic beverages with aging.
Footnotes
Supported by NRICGP/USDA Grants 2002-00788, DC00283, AA09379, GM57672, and DC004698.
References
- Bamshad M, Wooding S, Salisbury BA, Stephens JC. Deconstructing the relationship between genetics and race. Nat Rev Genet. 2004;5:598–609. doi: 10.1038/nrg1401. [DOI] [PubMed] [Google Scholar]
- Barnicot NA, Harris H, Kalmus H. Taste thresholds of further eighteen compounds and their correlation with P.T.C. thresholds. Ann Eugen. 1951;16:119–128. doi: 10.1111/j.1469-1809.1951.tb02464.x. [DOI] [PubMed] [Google Scholar]
- Bartoshuk L. The psychophysics of taste. Am J Clin Nutr. 1978;31:1068–1077. doi: 10.1093/ajcn/31.6.1068. [DOI] [PubMed] [Google Scholar]
- Bartoshuk L, Conner E, Grubin D, Karrer T, Kochenbach K, Palcso M, Snow D, Pelchat M, Danowski S. PROP supertasters and the perception of ethyl alcohol. Chem Senses. 1993;18:526–527. [Google Scholar]
- Bartoshuk L, Duffy V, Chapo AK, Fast K, Snyder D, Yiee J, Hoffman H, Ko K, Snyder DJ (2004a) From psychophysics to the clinic: missteps and advances. Food Qual Pref, in press.
- Bartoshuk L, Duffy V, Fast K, Kveton J, Lucchina L, Phillips M, Prutkin J, Reed D, Snyder D. What makes a supertaster (abstract)? Chem Senses. 2001;26:1074. [Google Scholar]
- Bartoshuk L, Duffy V, Reed D, Williams A. Supertasting, earaches and head trauma: genetics and pathology alter our taste worlds. Neurosci Biobehav Rev. 1995;20:79–87. doi: 10.1016/0149-7634(95)00042-d. [DOI] [PubMed] [Google Scholar]
- Bartoshuk LM, Duffy VB, Fast K, Green BG, Snyder DJ (2002a) Hormones, age, genes and pathology: how do we assess variation in sensation and preference? in Food Selection: From Genes to Culture (Anderson H, Blundell J, Chiva M eds), pp 173–188. Danone Institute, Paris.
- Bartoshuk LM, Duffy VB, Fast K, Green BG, Snyder DJ. Labeled scales (e.g., category, Likert, VAS) and invalid across-group comparisons: what we have learned from genetic variation in taste. Food Qual Pref. 2002b;14:125–138. [Google Scholar]
- Bartoshuk LM, Duffy VB, Fast K, Snyder DJ (2004b) Genetic differences in human oral perception: advanced methods reveal basic problems in intensity scaling, in Genetic Variation in Taste Sensitivity (Prescott J, Tepper B eds), pp 1–42. Marcel Dekker, New York.
- Bartoshuk LM, Duffy VB, Miller IJ. PTC/PROP tasting: anatomy, psychophysics, and sex effects. Physiol Behav. 1994;56:1165–1171. doi: 10.1016/0031-9384(94)90361-1. [DOI] [PubMed] [Google Scholar]
- Bergen AW, Yang XR, Bai Y, Beerman MB, Goldstein AM, Goldin LR. Genomic regions linked to alcohol consumption in the Framingham Heart Study. BMC Genet (Suppl 1) 2003;4:S101. doi: 10.1186/1471-2156-4-S1-S101. [DOI] [PMC free article] [PubMed] [Google Scholar]
- Berkley Nutrition Services (2000) Available at: http://www.nutritionquest-.com/validation.html Accessed: June 1, 2004
- Blakeslee A. Genetics of sensory thresholds: taste for phenyl thio carbamide. Proc Natl Acad Sci USA. 1932;18:120–130. doi: 10.1073/pnas.18.1.120. [DOI] [PMC free article] [PubMed] [Google Scholar]
- Block G, Hartman A, Dresser C, Carrol M, Gannon J, Gardner L. A data-based approach to diet questionnaire design and testing. Am J Epidemiol. 1986;124:453–469. doi: 10.1093/oxfordjournals.aje.a114416. [DOI] [PubMed] [Google Scholar]
- Crabbe J. Alcohol and genetics: new models. Am J Med Genet. 2002;114:969–974. doi: 10.1002/ajmg.b.10984. [DOI] [PubMed] [Google Scholar]
- Delwiche JF, Buletic Z, Breslin PA. Relationship of papillae number to bitter intensity of quinine and PROP within and between individuals. Physiol Behav. 2001;74:329–337. doi: 10.1016/s0031-9384(01)00568-6. [DOI] [PubMed] [Google Scholar]
- DiCarlo S, Powers A. Propylthiouracil tasting as a possible genetic association marker for two types of alcoholism. Physiol Behav. 1998;64:147–152. doi: 10.1016/s0031-9384(98)00043-2. [DOI] [PubMed] [Google Scholar]
- Dick DM, Foroud T. Candidate genes for alcohol dependence: a review of genetic evidence from human studies. Alcohol Clin Exp Res. 2003;27:868–879. doi: 10.1097/01.ALC.0000065436.24221.63. [DOI] [PubMed] [Google Scholar]
- Dick DM, Rose RJ, Viken RJ, Kaprio J, Koskenvuo M. Exploring gene-environment interactions: socioregional moderation of alcohol use. J Abnorm Psychol. 2001;110:625–632. doi: 10.1037//0021-843x.110.4.625. [DOI] [PubMed] [Google Scholar]
- Duffy V, Bartoshuk L. Food acceptance and genetic variation in taste. J Am Diet Assoc. 2000;100:647–655. doi: 10.1016/S0002-8223(00)00191-7. [DOI] [PubMed] [Google Scholar]
- Duffy VB, Peterson JM, Bartoshuk LM. Associations between taste genetics, oral sensation and alcohol intake. Physiol Behav. 2004;82:435–445. doi: 10.1016/j.physbeh.2004.04.060. [DOI] [PubMed] [Google Scholar]
- Finger TE, Nelson GM, Bryant B, Moore PA (1994) Intragemmal and perigemmal fibers in taste buds: immunocytochemistry and differential sensitivity to capsaicin (abstract). Soc Neurosci Abstr 402.12.
- Fischer R, Griffin F. Pharmacogenetic aspects of gustation. Drug Res. 1964;14:673–686. [PubMed] [Google Scholar]
- Foroud T, Edenberg HJ, Goate A, Rice J, Flury L, Koller DL, et al. Alcoholism susceptibility loci: confirmation studies in a replicate sample and further mapping. Alcohol Clin Exp Res. 2000;24:933–945. [PubMed] [Google Scholar]
- Fox AL. Six in ten “tasteblind” to bitter chemical. Sci News Lett. 1931;9:249. [Google Scholar]
- Grushka M, Bartoshuk L. Burning mouth syndrome and oral dysesthesias. Can J Diagn. 2000;17:99–109. [Google Scholar]
- Guinard J-X, Zoumas-Morse C, Dietz J, Goldberg S, Holz M, Heck E, Amoros A. Does consumption of beer, alcohol, and bitter substances affect bitterness perception? Physiol Behav. 1996;59:625–631. doi: 10.1016/0031-9384(95)02124-8. [DOI] [PubMed] [Google Scholar]
- Guo SW, Reed DR. The genetics of phenylthiocarbamide perception. Ann Hum Biol. 2001;28:111–142. doi: 10.1080/03014460151056310. [DOI] [PMC free article] [PubMed] [Google Scholar]
- Harris H, Kalmus H. The measurement of taste sensitivity to phenylthiourea (P.T.C.) Ann Eugen. 1949;15:24–31. doi: 10.1111/j.1469-1809.1949.tb02419.x. [DOI] [PubMed] [Google Scholar]
- Heath A, Nelson E. Effects of the interaction between genotype and environment. Research into the genetic epidemiology of alcohol dependence. Alcohol Res Health. 2002;26:193–201. [PMC free article] [PubMed] [Google Scholar]
- Heath AC, Bucholz KK, Madden PA, Dinwiddie SH, Slutske WS, Bierut LJ, et al. Genetic and environmental contributions to alcohol dependence risk in a national twin sample: consistency of findings in women and men. Psychol Med. 1997;27:1381–1396. doi: 10.1017/s0033291797005643. [DOI] [PubMed] [Google Scholar]
- Hellekant G, Danilova V, Roberts T, Ninomiya Y. The taste of ethanol in a primate model: I. Chorda tympani nerve response in Macaca mulatta. Alcohol. 1997;14:473–484. doi: 10.1016/s0741-8329(96)00215-7. [DOI] [PubMed] [Google Scholar]
- Hutchins H, Pescatello L, Allen G, Duffy V. Associations between genetic variation in taste and cardiovascular disease risk (abstract) J Am Diet Assoc. 2002;102(Suppl):A-12. [Google Scholar]
- Intranuovo L, Powers A. The perceived bitterness of beer and 6-n-propylthiouracil (PROP) taste sensitivity. Ann NY Acad Sci. 1998;855:813–815. doi: 10.1111/j.1749-6632.1998.tb10665.x. [DOI] [PubMed] [Google Scholar]
- Kamimoto L, Easton A, Maurice E, Husten C. Surveillance for five health risks among older adults—United States, 1993–1997. MMWR Morb Mortal Wkly Rep. 1999;48(SS08):89–130. [PubMed] [Google Scholar]
- Keppel G (1991) Design and Analysis: A Researcher’s Handbook. 3rd ed. Prentice Hall, Englewood Cliffs, NJ.
- Kidd KK, Davidson AC, Pakstis AJ, Speek WC, Bartoshuk LM, Duffy VB, Kidd JR. PTC-tasting and negative evidence for balancing selection (abstract) Am J Hum Genet Suppl. 2004;75:abstract 1175. in press. [Google Scholar]
- Kim UK, Jorgenson E, Coon H, Leppert M, Risch N, Drayna D. Positional cloning of the human quantitative trait locus underlying taste sensitivity to phenylthiocarbamide. Science. 2003;299:1221–1225. doi: 10.1126/science.1080190. [DOI] [PubMed] [Google Scholar]
- Kranzler H, Moore P, Hesselbrock V. No association of PROP taster status and parental history of alcohol dependence. Alcohol Clin Exp Res. 1996;20:1495–1500. doi: 10.1111/j.1530-0277.1996.tb01154.x. [DOI] [PubMed] [Google Scholar]
- Kranzler H, Skipsey K, Modesto-Lowe V. PROP taster status and parental history of alcohol dependence. Drug Alcohol Depend. 1998;52:109–113. doi: 10.1016/s0376-8716(98)00081-7. [DOI] [PubMed] [Google Scholar]
- Lanier S, Hayes J, Duffy V (2005) Sweet and bitter tastes of alcoholic beverages mediate alcohol intake in of-age undergraduates. Physiol Behav, in press. [DOI] [PubMed]
- Lawless HT. A comparison of different methods used to assess sensitivity to the taste of phenylthiocarbamide (PTC) Chem Senses. 1980;5:247–256. [Google Scholar]
- Lemon CH, Brasser SM, Smith DV. Alcohol activates a sucrose-responsive gustatory neural pathway. J Neurophysiol. 2004;92:536–544. doi: 10.1152/jn.00097.2004. [DOI] [PubMed] [Google Scholar]
- Mattes RD, DiMeglio D. Ethanol perception and ingestion. Physiol Behav. 2001;72:217–229. doi: 10.1016/s0031-9384(00)00397-8. [DOI] [PubMed] [Google Scholar]
- McBurney DH, Collings VB (1984) Introduction to Sensation/Perception 2nd ed. Prentice Hall, Englewood Cliffs, NJ.
- Miller I, Reedy F. Variation in human taste bud density and taste intensity perception. Physiol Behav. 1990;47:1213–1219. doi: 10.1016/0031-9384(90)90374-d. [DOI] [PubMed] [Google Scholar]
- Mulligan C, Robin R, Osier M, Sambuughin N, Goldfarb L, Kittles R, Hesselbrock D, Goldman D, Long J. Allelic variation at alcohol metabolism genes (ADH1B, ADH1C, ALDH2) and alcohol dependence in an American Indian population. Hum Genet. 2003;113:325–336. doi: 10.1007/s00439-003-0971-z. [DOI] [PubMed] [Google Scholar]
- Oota H, Pakstis AJ, Bonne-Tamir B, Goldman D, Grigorenko E, Kajuna SL, et al. The evolution and population genetics of the ALDH2 locus: random genetic drift, selection, and low levels of recombination. Ann Hum Genet. 2004;68(Pt 2):93–109. doi: 10.1046/j.1529-8817.2003.00060.x. [DOI] [PubMed] [Google Scholar]
- Osier M, Pakstis AJ, Kidd JR, Lee JF, Yin SJ, Ko HC, Edenberg HJ, Lu RB, Kidd KK. Linkage disequilibrium at the ADH2 and ADH3 loci and risk of alcoholism. Am J Hum Genet. 1999;64:1147–1157. doi: 10.1086/302317. [DOI] [PMC free article] [PubMed] [Google Scholar]
- Peeples E (1962) Taste Sensitivity to Phenylthioucarbamide in Alcoholics, Unpublished Master’s Thesis, Stetson University, Deland, FL.
- Pelchat M, Danowski S. A possible genetic association between PROP-tasting and alcoholism. Physiol Behav. 1992;51:1261–1266. doi: 10.1016/0031-9384(92)90318-v. [DOI] [PubMed] [Google Scholar]
- Pickering G, Simunkova K, DiBattista D. Intensity of taste and astringency sensations elicited by red wines is associated with sensitivity to PROP (6-n-proplthiouracil) Food Qual Pref. 2004;15:147–154. [Google Scholar]
- Prescott J, Swain-Campbell N. Responses to repeated oral irritation by capsaicin, cinnamaldehyde and ethanol in PROP tasters and nontasters. Chem Senses. 2000;25:239–246. doi: 10.1093/chemse/25.3.239. [DOI] [PubMed] [Google Scholar]
- Prutkin J, Duffy V, Etter L, Fast K, Lucchina L, Snyder D, Tie K, Bartoshuk L. Genetic variation and inferences about perceived taste intensity in mice and men. Physiol Behav. 2000;61:161–173. doi: 10.1016/s0031-9384(00)00199-2. [DOI] [PubMed] [Google Scholar]
- Reed DR, Bartoshuk LM, Duffy V, Marino S, Price RA. Propylthiouracil tasting: determination of underlying threshold distributions using maximum likelihood. Chem Senses. 1995;20:529–533. doi: 10.1093/chemse/20.5.529. [DOI] [PubMed] [Google Scholar]
- Reich T, Edenberg HJ, Goate A, Williams JT, Rice JP, Van Eerdewegh P, et al. Genome-wide search for genes affecting the risk for alcohol dependence. Am J Med Genet. 1998;81:207–215. [PubMed] [Google Scholar]
- Reid N, Brunt P, Bias W, Maddrey W, Alonso B, Iber F. Genetic characteristics and cirrhosis: a controlled study of 200 patients. Br Med J. 1968;2:463–465. doi: 10.1136/bmj.2.5603.463. [DOI] [PMC free article] [PubMed] [Google Scholar]
- Smith S. Taste thresholds in drug addicts and alcoholics. Br J Addict. 1972;67:317–321. doi: 10.1111/j.1360-0443.1972.tb01214.x. [DOI] [PubMed] [Google Scholar]
- Snyder LH. Inherited taste deficiency. Science. 1931;74:151–152. doi: 10.1126/science.74.1910.151. [DOI] [PubMed] [Google Scholar]
- Song J, Koller DL, Foroud T, Carr K, Zhao J, Rice J, et al. Association of GABA(A) receptors and alcohol dependence and the effects of genetic imprinting. Am J Med Genet. 2003;117B:39–45. doi: 10.1002/ajmg.b.10022. [DOI] [PubMed] [Google Scholar]
- Spiegel J (1972) Taste Sensitivity as a Possible Genetic Marker for Inheritance of Alcoholism, Unpublished Honors Thesis, Saint Louis University, St. Louis, MO.
- Stinson FS, Yi H, Grant BF, Chou P, Dawson DA, Pickering R. Drinking in the United States: main findings from the 1992 National Longitudinal Alcohol Epidemiologic Survey (NLAES), in U.S. Alcohol Epidemiologic Data Reference Manual, vol 6. National Institute on Alcohol Abuse and Alcoholism, Division of Biometry and Epidemiology, Rockville, MD. Available at: http://www.niaaa.nih.gov/databases/dkpat19.htm. Accessed: June. 1998;1:2004. [Google Scholar]
- Swinson R. Phenylthiocarbamide taste sensitivity in alcoholism. Br J Addict. 1973;68:33–36. doi: 10.1111/j.1360-0443.1973.tb01219.x. [DOI] [PubMed] [Google Scholar]
- Tabachnick B, Fidell L (2001) Using Multivariate Statistics 2nd ed. Allyn & Bacon, Boston.
- Tepper B, Nurse R. Fat perception is related to PROP taster status. Physiol Behav. 1997;61:949–954. doi: 10.1016/s0031-9384(96)00608-7. [DOI] [PubMed] [Google Scholar]
- Tepper B, Nurse R. PROP taster status is related to fat perception and preference. Ann NY Acad Sci. 1998;855:802–804. doi: 10.1111/j.1749-6632.1998.tb10662.x. [DOI] [PubMed] [Google Scholar]
- Tie K, Fast K, Kveton J, Cohen Z, Duffy V, Green B, Prutkin J, Bartoshuk L. Anesthesia of chorda tympani nerve and effect on oral pain (abstract) Chem Senses. 1999;24:609. [Google Scholar]
- Whitehead MC, Beeman CS, Kinsella BA. Distribution of taste and general sensory nerve endings in fungiform papillae of the hamster. Am J Anat. 1985;173:185–201. doi: 10.1002/aja.1001730304. [DOI] [PubMed] [Google Scholar]
- Whitehead MC, Kachele DL. Development of fungiform papillae, taste buds, and their innervation in the hamster. J Comp Neurol. 1994;340:515–530. doi: 10.1002/cne.903400405. [DOI] [PubMed] [Google Scholar]
- Wooding S, Kim UK, Bamshad MJ, Larsen J, Jorde LB, Drayna D. Natural selection and molecular evolution in PTC, a bitter-taste receptor gene. Am J Hum Genet. 2004;74:637–646. doi: 10.1086/383092. [DOI] [PMC free article] [PubMed] [Google Scholar]