

Abstract
Background
The authors present statistics and long-term trends in oral and pharyngeal cancer (OPC) incidence, mortality and survival among U.S. blacks and whites.
Methods
The authors obtained incidence, mortality and five-year relative survival rates via the Surveillance, Epidemiology and End Results (SEER) Program Web site. Current rates and time trends for 1975 through 2002 are presented.
Results
From 1975 through 2002, age-adjusted incidence rates (AAIRs) and mortality rates (AAMRs) were higher among males than among females and highest for black males. By the mid-1980s, incidence and mortality rates were declining for black and white males and females; however, disparities persisted. During the period 1998–2002, AAIRs were more than 20 percent higher for black males compared with white males, while the difference in rates for black and white females was small. AAMRs were 82 percent higher for black males compared with white males, but rates were similar for black and white females. Five-year relative survival rates for patients diagnosed during the period 1995–2001 were higher for whites than for blacks and lowest for black males.
Conclusions
Despite recent declines in OPC incidence and mortality rates, disparities persist. Disparities in survival also exist. Black males bear the brunt of these disparities.
Practice Implications
Dentists can aid in reducing OPC incidence and mortality by assisting patients in the prevention and cessation of tobacco use and alcohol abuse. Five-year relative survival may be improved through early detection.
Keywords: Oral cancer, pharyngeal cancer, trends, incidence, mortality, survival
In the United States, it is expected that 29,370 new cases of oral and pharyngeal cancer (OPC) will be diagnosed in 2005 and that 7,320 deaths will be attributed to cancers at these sites.1 OPC incidence, mortality and relative survival rates and trends are dynamic, however, and can vary over time and across age, sex and racial groups.2,3
The National Cancer Institute’s Surveillance, Epidemiology and End Results (SEER) Program collects and reports high-quality cancer incidence and survival data and statistics for the United States. Registration began in 1973 and, over time, the SEER Program expanded its coverage, from approximately 10 percent of the U.S. population in 1975 to its current coverage of 26 percent.4 Presently, the program collects data regarding cases of in situ and invasive cancer via 14 population-based registries in selected states, metropolitan areas and counties, as well as through three supplemental registries.4 The SEER program also reports mortality statistics based on data amassed by the National Center for Health Statistics.4 Data and statistics are disseminated in part via the SEER Web site (“www.seer.cancer.gov”).
The purpose of this article is to present current statistics and long-term trends for OPC incidence, mortality and five-year relative survival in the United States, as provided by the SEER Program, with an emphasis on rates and trends observed for black and white Americans.
MATERIALS AND METHODS
Cancers of the oral cavity and pharynx were defined broadly and included all anatomical sites under the heading of “lip, oral cavity and pharynx,” as classified by the third revision of the International Classification of Diseases for Oncology (ICD-O).5 These sites (ICD-O C00-C14) include the lip (excluding the skin of the lip), oral cavity, pharynx and major salivary glands, as well as other and ill-defined sites in the lip, oral cavity and pharynx.
The oral cavity accounted for approximately one-half of all new cases of oral and pharyngeal cancer in blacks and whites.
For this article, we defined the oral cavity as including the tongue, floor of the mouth, gingiva and palate, as well as other and unspecified parts of the mouth. The pharynx included the tonsil, oropharynx, hypopharynx and nasopharynx. Anatomical sites classified as “other and ill-defined sites in the lip, oral cavity and pharynx” (ICD-O C14; hereafter referred to as “other oral cavity and pharynx”) include not otherwise specified areas of the pharynx, Waldeyer’s ring and overlapping lesions of the lip, oral cavity and pharynx.
Incidence and mortality rates
The OPC incidence rate for a given year is defined as the number of new OPC cases diagnosed per 100,000 persons at risk during that year. Analogously, the OPC mortality rate for a given year is defined as the number of deaths in which OPC was the underlying cause per 100,000 persons in the population during that year. Age-adjusted incidence rates (AAIRs) and age-adjusted mortality rates (AAMRs), which included all ages, were standardized by SEER to the 2000 U.S. standard population in 19 age strata.
The tables and figures in this report are based on statistics obtained from the SEER Cancer Statistics Review 1973–20026 or the SEER Cancer Query Systems Web site7 and are based on the most currently available statistics at the time we prepared the article. The apparent delay in the availability of such statistics (that is, the fact that the statistics end with the year 2002) is a function of the time required to collect, record and analyze the relevant data.
In this article, we limit the reported statistics to invasive cancers and to people whose race was reported as black or white, including black and white Hispanics. Unless otherwise noted, we based incidence and survival statistics on data from nine SEER areas (that is, the states of Connecticut, Hawaii, Iowa, New Mexico and Utah, as well as the metropolitan areas of Atlanta, Detroit, San Francisco-Oakland and Seattle-Puget Sound). Where statistics for 13 SEER areas are presented, the geographical areas include those above, plus Los Angeles, San Jose-Monterey, rural Georgia and the Alaska Native Registry. Mortality rates include data from the entire United States.
Statistical software
We based our description of incidence and mortality trends on analyses using statistical software (Joinpoint Regression Program), which models on the natural logarithm of the rate, identifies points (years) at which a trend changes and connects those points by a series of straight line segments.8,9 Each time trend segment has an associated estimated annual percentage change, which can be evaluated in terms of its statistical significance (that is, testing the hypothesis that the slope of the segment is different from zero).
Relative survival—the ratio of the proportion of observed survivors in a cohort of cancer cases to the proportion of expected survivors in a comparable cohort of people without cancer—is a measure of net survival and is calculated by SEER using the method of Ederer and colleagues.10 The five-year relative survival rate can be interpreted as the estimated likelihood that a patient with cancer will not die of causes specifically related to the cancer within the five-year period following diagnosis.11
RESULTS
Tables 1 and 2 (page 206) present AAIRs and AAMRs by anatomical site and sex for black and white Americans during the period 1998–2002. In terms of incidence, age-adjusted rates were notably higher among males than among females, and were highest for black males. The oral cavity accounted for approximately one-half of all new cases of OPC in both races, with the tongue being the most frequently involved single site within the oral cavity. In the pharynx, the tonsil was the most frequently involved site. Pharyngeal cancer contributed a higher fraction of new OPC cases among blacks (38 percent) than among whites (26 percent), while the opposite was true for lip cancer (1 percent versus 11 percent).
TABLE 1.
| ANATOMICAL SITE | INCIDENCE RATE‡ (PERCENTAGE OF ALL SITES) | |||||
|---|---|---|---|---|---|---|
| Whites | Blacks | |||||
| Male and Female | Male | Female | Male and Female | Male | Female | |
| Lip | 1.2 (11) | 2.1 (13) | 0.4 (7) | 0.1 (1) | 0.1 (0) | 0.2 (3) |
| Oral Cavity | 5.3 (49) | 7.1 (45) | 3.7 (56) | 5.7 (48) | 9.0 (46) | 3.2 (53) |
| Tongue | 2.7 (25) | 3.9 (25) | 1.7 (25) | 2.6 (22) | 4.2 (22) | 1.4 (23) |
| Floor of mouth | 0.8 (8) | 1.2 (8) | 0.5 (8) | 1.1 (10) | 2.0 (10) | 0.5 (8) |
| Gum and other oral cavity | 1.7 (16) | 2.0 (12) | 1.5 (23) | 2.0 (17) | 2.8 (15) | 1.3 (22) |
| Pharynx | 2.8 (26) | 4.5 (28) | 1.3 (20) | 4.4 (38) | 8.1 (42) | 1.7 (28) |
| Tonsil | 1.4 (13) | 2.2 (14) | 0.5 (8) | 1.8 (15) | 3.3 (17) | 0.6 (10) |
| Oropharynx | 0.3 (3) | 0.4 (3) | 0.2 (2) | 0.7 (6) | 1.2 (6) | 0.3 (4) |
| Hypopharynx | 0.8 (7) | 1.3 (8) | 0.4 (5) | 1.4 (12) | 2.8 (14) | 0.5 (8) |
| Nasopharynx | 0.4 (4) | 0.6 (4) | 0.2 (4) | 0.6 (5) | 0.9 (4) | 0.3 (6) |
| Major Salivary Glands | 1.3 (12) | 1.7 (11) | 1.0 (16) | 1.0 (9) | 1.4 (7) | 0.8 (14) |
| Other Oral Cavity and Pharynx | 0.3 (3) | 0.4 (3) | 0.2 (2) | 0.5 (4) | 0.9 (4) | 0.2 (3) |
| TOTAL | 10.8 | 15.7 | 6.6 | 11.8 | 19.5 | 6.0 |
OPC: Oral and pharyngeal cancer.
Includes all ages. All rates were adjusted to the 2000 U.S. standard population (19 age groups). Incidence rates are based on nine Surveillance, Epidemiology and End Results (SEER) areas.7
Reported incidence rates were based on rates calculated to two decimal places; apparent discrepancies in totals are the result of rounding.
TABLE 2.
| ANATOMICAL SITE | MORTALITY RATE§ (PERCENTAGE OF ALL SITES) | |||||
|---|---|---|---|---|---|---|
| Whites | Blacks | |||||
| Male and Female | Male | Female | Male and Female | Male | Female | |
| Lip | 0 (1) | 0.1 (1) | 0 (1) | 0 (0) | 0 (0) | 0 (1) |
| Oral Cavity | 1.1 (43) | 1.5 (39) | 0.8 (49) | 1.4 (35) | 2.4 (34) | 0.7 (37) |
| Tongue | 0.6 (24) | 0.9 (23) | 0.4 (26) | 0.8 (19) | 1.4 (19) | 0.4 (19) |
| Floor of mouth | 0.1 (2) | 0.1 (2) | 0 (2) | 0.1 (2) | 0.2 (2) | 0 (2) |
| Gum and other oral cavity | 0.4 (17) | 0.5 (14) | 0.3 (22) | 0.6 (13) | 0.9 (13) | 0.3 (16) |
| Pharynx | 0.7 (26) | 1.1 (27) | 0.4 (23) | 1.4 (33) | 2.3 (33) | 0.6 (32) |
| Tonsil | 0.2 (7) | 0.3 (8) | 0.1 (6) | 0.4 (9) | 0.7 (9) | 0.1 (7) |
| Oropharynx | 0.2 (7) | 0.3 (7) | 0.1 (6) | 0.4 (10) | 0.8 (11) | 0.2 (10) |
| Hypopharynx | 0.1 (5) | 0.2 (5) | 0.1 (3) | 0.2 (5) | 0.4 (6) | 0.1 (4) |
| Nasopharynx | 0.2 (7) | 0.3 (7) | 0.1 (8) | 0.3 (8) | 0.5 (7) | 0.2 (11) |
| Major Salivary Glands | 0.3 (10) | 0.4 (10) | 0.2 (10) | 0.2 (5) | 0.2 (3) | 0.2 (8) |
| Other Oral Cavity and Pharynx | 0.5 (20) | 0.9 (22) | 0.3 (16) | 1.1 (27) | 2.1 (29) | 0.4 (22) |
| TOTAL | 2.6 | 3.9 | 1.6 | 4.1 | 7.1 | 1.9 |
OPC: Oral and pharyngeal cancer.
Includes all ages. All rates were adjusted to the 2000 U.S. standard population (19 age groups). Mortality rates are for the entire United States.
Source: National Cancer Institute, National Institutes of Health.7
Reported mortality rates were based on rates calculated to two decimal places; apparent discrepancies in totals are the result of rounding.
With regard to mortality, age-adjusted rates also were higher for males than for females, and were highest for black males. Among whites, death rates were notably higher for people with cancer of the oral cavity than for those with cancer at any other aggregated site, while among blacks, mortality rates for those with pharyngeal cancer were similar to those for people with cancer of the oral cavity. In both races, death rates for people with cancer of the tongue were higher than rates for people with cancer at any other single OPC anatomical site. Notably, the proportion of cancers in sites classified as “other oral cavity and pharynx” accounted for a greater fraction of OPC deaths among blacks than among whites. For the anatomical sites presented in Table 2, mortality rates were lowest for cancers of the lip. Figure 1 (page 207) presents age-specific OPC incidence rates by age and sex for black and white Americans, based on nine SEER areas, during the period 1998–2002.7 For the youngest age categories, incidence rates generally were less than 1 per 100,000 persons per year; however, after about the third decade of life, rates began to increase notably, with the sharpest increases seen for males, particularly black males. The curve for black males also peaked at both an earlier age and a higher rate than that for any other racial-sex group. Incidence rates tended to plateau for older whites and declined rapidly for older black males. For black females, incidence rates increased only modestly with age for women 60 years and older, followed by a decline in rates for the oldest black females. On the basis of data from 13 SEER areas, the overall median age at diagnosis of OPC was higher for whites (64 years) than it was for blacks (57 years).
Figure 1.
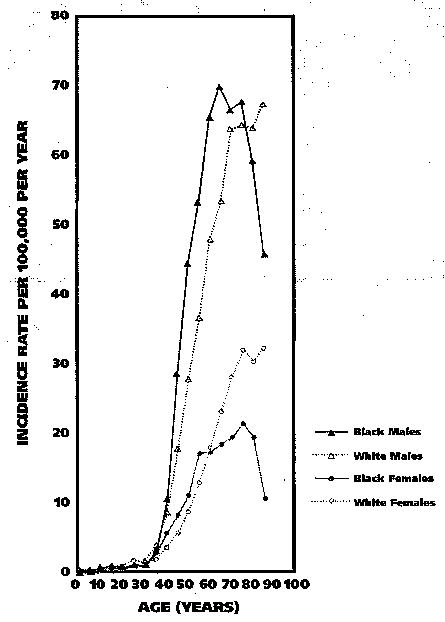
Age-specific incidence rates for cancer of the oral cavity and pharynx by age, sex and race in nine Surveillance, Epidemiology and End Results (SEER) Program registries, 1998–2002.7
Figure 2 shows age-specific OPC mortality rates by age and sex for U.S. blacks and whites during the period 1998–2002.7 As with OPC incidence rates, mortality rates were very low during the earliest decades of life, and then began to increase rapidly after the third decade of life. Thereafter, rates were higher for males than for females and, for most age categories, highest for black males. For whites, rates increased with age. For black males, rates peaked at about age 70 years before declining for each of the oldest age groups. For black females, rates increased into the seventh decade of life, then showed signs of leveling off before again increasing for the oldest strata. During the period 1998–2002, the median age at death for patients with OPC was 70 years for whites and 61 years for blacks.
Figure 2.

Age-specific mortality rates for cancer of the oral cavity and pharynx by age, sex and race in the United States, 1998–2002.7
AAIRs
Figure 3 (page 208) shows AAIRs by race and sex for the years spanning 1975 through 2002.7 AAIRs were notably higher for males than for females, and black males had the highest rates during most of this 28-year period. For black males, AAIRs tended to rise sharply from the mid-1970s through the mid-1980s before showing a dramatic decline that began in the middle to late 1980s and continued through the turn of the century. For white males, AAIRs declined from the mid-1970s into the early 2000s. Rates for white females increased modestly from the mid-1970s into the early 1980s, but tended to decrease thereafter, while for black females, the Joinpoint Regression Program identified a general downward trend in AAIRs.
Figure 3.
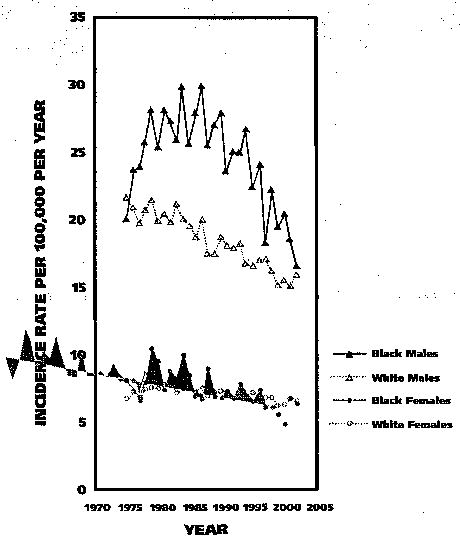
Age-adjusted incidence rates for oral and pharyngeal cancer by race and sex for all ages in nine Surveillance, Epidemiology and End Results (SEER) Program registries, 1975–2002.7
Each of the time trend segments, as described above for each of the four racial-sex groups (for example, the trend for black males between the mid-1970s and the mid-1980s), was statistically significant (P < .05; that is, the slope of the trend line over time was statistically different from zero, as determined by the Joinpoint Regression Program). A comparison of AAIRs for 1975 with those for 2002 showed a net decline of 17 percent, 26 percent, 22 percent and 5 percent for black males, white males, black females and white females, respectively. Between 1987 and 2002 alone, reported AAIRs for black males declined by more than 40 percent, with an estimated annual decrease of 3.1 percent (P < .05). However, during the most recent five-year period for which statistics are available (1998–2002), AAIRs were still more than 20 percent higher for black males than for white males. During the same period, the AAIR was 10 percent higher among white females than among black females; however, the absolute difference in rates was small.
AAMRs
Figure 4 shows AAMRs by race and sex for the years 1975 through 2002.7 Males had higher mortality rates than did females, and black males had the highest rates, while white females had the lowest. OPC mortality rates for black males increased markedly from 1975 through 1980, before showing an equally marked decline through the 1990s and into the early 2000s. Rates declined for white males throughout the 28-year period. For black females, the regression model identified a modest decrease in rates from the mid-1970s into the mid-1990s before declining more sharply. Rates for white females fell during most of the period from 1975 through 2002. Each of the time trend segments identified above was statistically significant.
Figure 4.
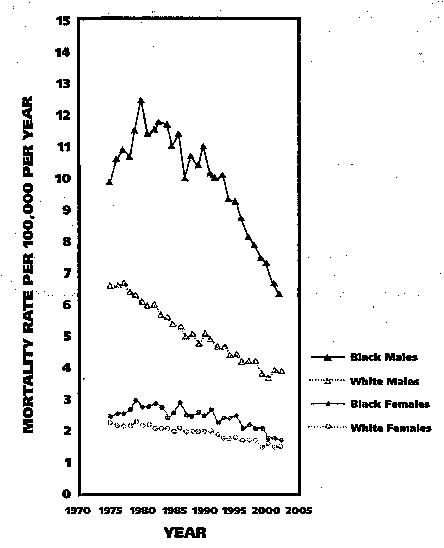
Age-adjusted mortality rates for oral and pharyngeal cancer by race and sex for all ages in the United States, 1975–2002.7
Between 1975 and 2002, AAMRs for black males showed a net decrease of 22 percent, while for white males, rates declined 29 percent. For black and white females, AAMRs showed net declines of 15 percent and 16 percent, respectively. During the period 1998–2002, OPC mortality rates were 82 percent higher for black males than for white males, while the difference in rates for black and white females was small.
For OPC cases diagnosed during the period 1995–2001, overall five-year relative survival rates were highest for white females (63 percent) and males (61 percent), intermediate for black females (52 percent) and lowest for black males (34 percent). As presented in Table 3, relative survival rates declined with each successively higher stage at diagnosis, and this trend was seen for each racial-sex group. We observed the highest five-year relative survival rates for whites and black females who were diagnosed with localized disease (> 80 percent), while black males who were diagnosed with distant metastases or unstaged disease had the lowest rates (23 percent) (Table 3). Black males diagnosed with localized or regional disease also had notably lower five-year relative survival rates than did any other group.
TABLE 3.
Five-year relative survival rates for patients with OPC,* by stage, age at diagnosis and anatomical site, 1995–2001.†
| CHARACTERISTIC | FIVE-YEAR RELATIVE SURVIVAL (PERCENTAGE OF PATIENTS) | |||||
|---|---|---|---|---|---|---|
| Whites | Blacks | |||||
| Male and Female | Male | Female | Male and Female | Male | Female | |
| Stage at Diagnosis | ||||||
| All stages | 61.8 | 61.1 | 63.1 | 39.5 | 34.3 | 52.0 |
| Localized | 83.0 | 83.9 | 81.5 | 70.7 | 59.8 | 85.2 |
| Regional | 53.2 | 53.1 | 53.5 | 33.0 | 31.3 | 37.7 |
| Distant | 27.6 | 25.2 | 32.7 | 25.3 | 22.5 | 31.1 |
| Unstaged | 48.1 | 50.5 | 43.7 | 30.3 | 22.5 | —‡ |
| Age at Diagnosis (Years) | ||||||
| < 45 | 80.2 | 76.7 | 86.3 | 58.8 | 51.1 | 70.5 |
| 45–54 | 67.8 | 66.1 | 73.2 | 37.7 | 34.1 | 50.5 |
| 55–64 | 61.1 | 59.1 | 66.1 | 35.0 | 30.8 | 48.3 |
| 65–74 | 56.6 | 56.3 | 57.2 | 32.2 | 29.7 | 37.8 |
| ≥75 | 48.6 | 50.5 | 45.7 | 30.2 | 17.1 | 42.8 |
| Anatomical Site | ||||||
| Lip | 92.8 | 93.1 | 90.2 | — | — | — |
| Oral cavity | ||||||
| Tongue | 58.3 | 58.4 | 57.6 | 37.0 | 34.7 | 42.6 |
| Floor of mouth | 54.8 | 54.1 | 56.2 | 40.0 | 29.3 | 62.4 |
| Gum and other oral cavity | 61.9 | 58.0 | 66.0 | 46.4 | 36.2 | 64.8 |
| Pharynx | ||||||
| Tonsil | 61.8 | 62.6 | 59.0 | 35.2 | 31.8 | 47.7 |
| Oropharynx | 40.5 | 38.8 | 44.8 | 30.4 | 32.5 | — |
| Hypopharynx | 32.7 | 33.6 | 28.4 | 16.0 | 17.3 | 11.5 |
| Nasopharynx | 54.4 | 52.3 | 57.5 | 41.0 | 47.1 | 20.6 |
| Major salivary glands | 75.0 | 69.8 | 79.4 | 74.9 | 64.9 | 85.4 |
| Other oral cavity and pharynx | 33.3 | 33.5 | 32.6 | 18.2 | 17.8 | — |
OPC: Oral and pharyngeal cancer.
Based on nine Surveillance, Epidemiology and End Results (SEER) areas.6
Dash indicates fewer than 25 cases in the time period; therefore, a statistic could not be calculated.
Although not shown in Table 3, a higher proportion of white females (42 percent) and males (35 percent) were diagnosed with localized disease than were black females (31 percent) and black males (17 percent). For black and white Americans diagnosed with OPC during the period 1995–2001, five-year relative survival also was related to both age at diagnosis—with younger patients generally having a higher relative survival than older patients—and the anatomical site of the primary cancer (with cancers of the lip and major salivary glands having the highest rates, and cancers of the hypopharynx and those in sites classified as “other oral cavity and pharynx” having the lowest rates) (Table 3).
Five-year relative survival rates for white females (63 percent) and males (61 percent) who were diagnosed during the period 1995–2001 were higher than rates for those who were diagnosed during the period 1974–1976 (when rates for white females and males were 56 percent and 55 percent, respectively); the differences in rates between these periods were statistically significant (P < .05) (Table 4 [page 210]). For blacks, five-year relative survival rates also were higher in the period 1995–2001 than in the period 1974–1976; however, the differences were not statistically significant.
TABLE 4.
| YEAR OF DIAGNOSIS | FIVE-YEAR RELATIVE SURVIVAL (PERCENTAGE OF PATIENTS) | |||||
|---|---|---|---|---|---|---|
| Whites | Blacks | |||||
| Male and Female | Male | Female | Male and Female | Male | Female | |
| 1974–1976 | 55.0 | 54.6 | 56.1 | 36.3 | 31.4 | 45.5 |
| 1977–1979 | 54.9 | 54.3 | 56.3 | 36.8 | 30.9 | 49.2 |
| 1980–1982 | 55.7 | 54.6 | 58.0 | 31.0 | 26.5 | 42.5 |
| 1983–1985 | 55.6 | 54.9 | 57.2 | 35.2 | 29.8 | 47.5 |
| 1986–1988 | 57.0 | 54.5 | 62.1 | 35.2 | 29.7 | 49.2 |
| 1989–1991 | 58.1 | 55.8 | 62.8 | 34.0 | 29.7 | 44.8 |
| 1992–1994 | 60.1 | 59.2 | 61.9 | 35.9 | 30.6 | 50.3 |
| 1995–2001 | 61.8‡ | 61.1‡ | 63.1‡ | 39.5 | 34.3 | 52.0 |
OPC: Oral and pharyngeal cancer.
Based on nine Surveillance, Epidemiology and End Results (SEER) areas.6
Rates for 1995–2001 were statistically significantly higher than the rates for 1974–1976 (P < .05).
DISCUSSION
On the basis of statistics available through the SEER Program Web site, we found that incidence, mortality and relative survival rates and trends varied substantially for U.S. blacks and whites, as well as for males and females.
As in most, but not all, geographical areas around the world, the incidence of oral cavity cancer in the United States exceeds that of pharyngeal cancer.12,13 Proportionally, however, cancers of the pharynx represented a higher fraction of the total OPC incidence among blacks than among whites in the United States, and pharyngeal cancers generally are associated with a low relative survival rate. On the other hand, lip cancer, which is associated with a high relative survival rate, was proportionally more common in whites and extremely rare in blacks. The difference in lip cancer incidence between blacks and whites has long been attributed to the higher pigmentation levels of blacks, which, in turn, protect the lips from climactic factors, including actinic radiation.14
Birth cohort effects
Most cancers of the oral cavity and pharynx are epithelial in origin, and as with many other epithelial cancers, cross-sectional incidence and mortality rates tend to increase progressively with age in the absence of other effects. For blacks in particular, however, the patterns shown in Figures 1 and 2 are in keeping with notable birth cohort effects. Birth cohort effects can arise when patterns of exposure to disease risk factors (for example, smoking) vary from one cohort to the next, resulting in different levels of disease incidence and mortality for the different cohorts. When birth cohort effects are present and age-specific rates are plotted by age (Figures 1 and 2), the resultant curves vary from the expected pattern, as exemplified by the patterns seen for black males. More extensive analyses of long-term OPC incidence and mortality data from U.S. populations also have revealed the presence of birth cohort effects,15–17 providing evidence that changing patterns in risk factor exposure, by birth cohort, have contributed to observed trends in OPC over time.
By the mid-1980s, AAIRs and AAMRs were declining for black and white males and females, and the overall percentage declines were remarkable. Although incidence and mortality rates have declined in the United States since the mid-1980s for each of the racial-sex groups, it is important to point out that disparities between black and white American males persist, particularly with regard to mortality.
In addition, it is noteworthy that the downward trend in age-adjusted OPC rates, as observed in the United States, is not ubiquitous around the globe. For example, incidence and mortality rates increased in a number of geographical areas in Europe during the 1980s through the middle to late 1990s.13,18–21 Although we do not discuss time trends in OPC incidence and mortality associated with specific anatomical sites, these statistics can be obtained from the SEER Cancer Query Systems site. Also, site-specific trends in incidence were presented in a previous analysis of SEER data from 1975 through 1998.22
Canto and Devasa22 reported that between the periods 1975–1982 and 1992–1998, OPC incidence rates decreased substantially for squamous cell cancers in each of the racial-sex groups, while the incidence of adenocarcinoma increased for each group, with the exception of black females. During the periods 1983–1990 and 1991–1998, incidence rates for OPC Kaposi’s sarcoma among black and white males were less than 0.5 per 100,000 persons per year and were negligible among females, indicating that the incidence of Kaposi’s sarcoma contributed little to the overall disparity in OPC incidence.22
Risk factors
The primary risk factors for OPC in the United States are smoking tobacco and consuming alcohol, and it is well-established that higher levels of smoking and drinking are independently associated with higher risks of developing OPC.23,24 Moreover, the joint effect of smoking and drinking has been shown to be greater than the sum of their independent effects.23,24 On the other hand, substantial reductions in OPC risk are seen in people who discontinue smoking; in fact, one large U.S. study found that people who had quit smoking at least 10 years earlier had approximately the same risk of developing OPC as those who never smoked.23,24
Notably, in various European countries, time trends in OPC incidence and mortality have been linked to changes in alcohol consumption and, to a lesser extent, tobacco use.25–29 On the other hand, cohort trends in OPC incidence and mortality in the United States have not coincided consistently with cohort trends in smoking.15,17 Nevertheless, a primary strategy to reduce the burden of OPC among blacks and whites includes the prevention and cessation of both tobacco use and alcohol abuse,30 and dentists can play an important role in these efforts.
In an analysis of data from a large U.S. population-based case-control study of OPC (excluding the lip, major salivary glands and nasopharynx) conducted in the mid-1980s, Day and colleagues24 found that most of the difference in OPC incidence rates between blacks and whites was attributable to racial differences in patterns of alcohol intake, especially among current smokers, as well as to higher OPC risks associated with alcohol intake among blacks.
Other factors, including nutrition and various sociodemographic characteristics, also appear to be related to the racial disparity in OPC rates.24,31 Although a growing body of evidence suggests that some human papillomaviruses may play an etiologic role in a small subset of OPC cases,32–34 it is not clear whether and to what extent such a relationship may have influenced the observed racial differences in incidence and mortality rates.
Relative survival
Five-year relative survival is substantially higher in whites than in blacks, and is particularly low in black males. Moreover, the disparity in relative survival is apparent across virtually all stages, ages and anatomical sites. Stage at diagnosis is an important predictor of survival, and oral cancer examinations performed by dentists and other health care professionals represent an opportunity to identify pre-cancerous lesions and early-stage cancers; however, in 1998, only 13 percent of U.S. adults (14 percent for whites, 7 percent for blacks) reported having received such an examination within the preceding 12 months.35
Evidence shows—based on SEER and other cancer registry–based data—that racial disparities may exist in the treatment received by patients with OPC, with whites more likely than blacks to receive cancer-directed surgery, even after data are stratified on the anatomical site affected and stage at diagnosis.36,37 The reasons for such treatment differences, however, are not clear.
Furthermore, although treatment can affect survival, survival analyses that include the type of treatment received and adjust for or stratify by other relevant factors, such as age, sex, measures of socioeconomic status, site and stage, do not account totally for the observed differences in survival between blacks and whites.36,38–40 It is not unlikely that additional characteristics, including lifestyle habits (for example, smoking and drinking), cultural factors and comorbid conditions also play a role in survival differences between black and white Americans with OPC.39,41,42
CONCLUSION
The SEER Web site, a readily accessible source of high-quality population-based cancer statistics, provides evidence of both racial disparities and marked changes in OPC incidence and mortality during the period spanning 1975 through 2002. Although both incidence and mortality rates for black and white males and females have declined in the United States since the mid-1980s, disparities between black and white males persist, particularly with regard to OPC mortality. Racial and sex differences in patterns of exposure to OPC risk factors, particularly tobacco and alcohol, likely are responsible for most of the observed differences in OPC rates across race and sex groups. Racial disparities also exist in five-year relative survival rates, with whites having the highest rates and black males the lowest rates. Racial differences in stage at diagnosis, age, sex, socioeconomic status and treatment explain some, but not all, of the disparity in survival between black and white Americans.
Dentists can play a primary role in further reducing OPC incidence and mortality by assisting their patients in the prevention and cessation of tobacco use and alcohol abuse, while five-year relative survival may be improved through early cancer detection.
Acknowledgments
This study was supported by the New York University Oral Cancer Research for Adolescent and Adult Health Promotion Center, National Institutes of Health/National Institute of Dental and Craniofacial Research grant U54 DE14257.
References
- 1.Jemal A, Murray T, Ward E, et al. Cancer statistics, 2005 (published erratum appears in CA Cancer J Clin 2005;55:259) CA Cancer J Clin. 2005;55:10–30. doi: 10.3322/canjclin.55.1.10. Erratum in CA Cancer J Clin 2005, 55:259. [DOI] [PubMed] [Google Scholar]
- 2.Silverman S., Jr Demographics and occurrence of oral and pharyngeal cancers: the outcomes, the trends, the challenge. JADA. 2001;132(supplement):7S–11S. doi: 10.14219/jada.archive.2001.0382. [DOI] [PubMed] [Google Scholar]
- 3.Swango PA. Cancers of the oral cavity and pharynx in the United States: an epidemiologic overview. J Public Health Dent. 1996;56:309–18. doi: 10.1111/j.1752-7325.1996.tb02458.x. [DOI] [PubMed] [Google Scholar]
- 4.National Cancer Institute, Surveillance, Epidemiology and End Results (SEER). Overview of the SEER program; 2005. Available at: “www.seer.cancer.gov/about/”. Accessed Dec. 15, 2005.
- 5.Fritz A. International classification of diseases for oncology. 3rd ed. Geneva: World Health Organization; 2000.
- 6.Ries LAG, Eisner MP, Kosary CL, et al, eds. SEER cancer statistics review, 1975–2002, National Cancer Institute. Bethesda, Md. Available at: “www.seer.cancer.gov/csr/1975_2002/”, based on November 2004 SEER data submission, posted to the SEER Web site; 2005. Accessed Dec. 15, 2005.
- 7.National Cancer Institute, National Institutes of Health. Surveillance, Epidemiology and End Results. Cancer query systems. Available at: “www.seer.cancer.gov/canques/”. Accessed Jan. 6, 2006.
- 8.Kim HJ, Fay MP, Feuer EJ, Midthune DN. Permutation tests for joinpoint regression with applications to cancer rates [published erratum appears in Stat Med 2001;20:655] Stat Med. 2000;19:335–51. doi: 10.1002/(sici)1097-0258(20000215)19:3<335::aid-sim336>3.0.co;2-z. [DOI] [PubMed] [Google Scholar]
- 9.Joinpoint Regression Program, version 3.0: Bethesda, Md.: National Cancer Institute; 2005. Available at: “www.seer.cancer.gov/seerstat/”. Accessed Jan. 6, 2006.
- 10.Ederer F, Axtell LM, Cutler SJ. The relative survival rate: a statistical methodology. Natl Cancer Inst Monogr. 1961;6:101–21. [PubMed] [Google Scholar]
- 11.Ries LAG, Hankey BF, Harras A, Devesa SS. Cancer incidence, mortality, and patient survival in the United States. In: Schottenfeld D, Fraumeni JF, eds. Cancer epidemiology and prevention. 2nd ed. New York: Oxford University Press; 1996:168–91.
- 12.Franceschi S, Bidoli E, Herrero R, Munoz N. Comparison of cancers of the oral cavity and pharynx worldwide: etiological clues. Oral Oncol. 2000;36:106–15. doi: 10.1016/s1368-8375(99)00070-6. [DOI] [PubMed] [Google Scholar]
- 13.Parkin DM. Cancer incidence in five continents. Vol. 8. Lyon, France: International Agency for Research on Cancer; 2002.
- 14.Ebenius B. Cancer of the lip: a clinical study of 778 cases with particular regard to predisposing factors and radium therapy. Acta Radiol (Stockholm) 1943;48:1–232. [Google Scholar]
- 15.Devesa SS, Blot WJ, Fraumeni JF., Jr Cohort trends in mortality from oral, esophageal, and laryngeal cancers in the United States. Epidemiology. 1990;1:116–21. doi: 10.1097/00001648-199003000-00006. [DOI] [PubMed] [Google Scholar]
- 16.Morse DE, Pendrys DG, Neely AL, Psoter WJ. Trends in the incidence of lip, oral, and pharyngeal cancer: Connecticut, 1935–94. Oral Oncol. 1999;35:1–8. doi: 10.1016/s1368-8375(98)00071-2. [DOI] [PubMed] [Google Scholar]
- 17.Roush GC. Mouth and pharynx. In: Cancer risk and incidence trends: The Connecticut perspective. Washington: Hemisphere Publishing; 1987:43–56.
- 18.La Vecchia C, Lucchini F, Negri E, Levi F. Trends in oral cancer mortality in Europe. Oral Oncol. 2004;40:433–9. doi: 10.1016/j.oraloncology.2003.09.013. [DOI] [PubMed] [Google Scholar]
- 19.Parkin DM. Cancer incidence in five continents. Vol. 6. Lyon, France: International Agency for Research on Cancer; 1992.
- 20.Parkin DM. Cancer incidence in five continents. Vol. 7. Lyon, France: International Agency for Research on Cancer; 1997.
- 21.Bray I, Brennan P, Boffetta P. Projections of alcohol- and tobacco-related cancer mortality in Central Europe. Int J Cancer. 2000;87:122–8. doi: 10.1002/1097-0215(20000701)87:1<122::aid-ijc18>3.0.co;2-w. [DOI] [PubMed] [Google Scholar]
- 22.Canto MT, Devesa SS. Oral cavity and pharynx cancer incidence rates in the United States, 1975–1998. Oral Oncol. 2002;38:610–7. doi: 10.1016/s1368-8375(01)00109-9. [DOI] [PubMed] [Google Scholar]
- 23.Blot WJ, McLaughlin JK, Winn DM, et al. Smoking and drinking in relation to oral and pharyngeal cancer. Cancer Res. 1988;48:3282–7. [PubMed] [Google Scholar]
- 24.Day GL, Blot WJ, Austin DF, et al. Racial differences in risk of oral and pharyngeal cancer: alcohol, tobacco, and other determinants. J Natl Cancer Inst. 1993;85:465–73. doi: 10.1093/jnci/85.6.465. [DOI] [PubMed] [Google Scholar]
- 25.Plesko I, Macfarlane GJ, Evstifeeva TV, Obsitnikova A, Kramarova E. Oral and pharyngeal cancer incidence in Slovakia 1968–1989. Int J Cancer. 1994;56:481–6. doi: 10.1002/ijc.2910560405. [DOI] [PubMed] [Google Scholar]
- 26.Moller H. Changing incidence of cancer of the tongue, oral cavity, and pharynx in Denmark. J Oral Pathol Med. 1989;18:224–9. doi: 10.1111/j.1600-0714.1989.tb00767.x. [DOI] [PubMed] [Google Scholar]
- 27.Hindle I, Downer MC, Moles DR, Speight PM. Is alcohol responsible for more intra-oral cancer? Oral Oncol. 2000;36:328–33. doi: 10.1016/s1368-8375(00)00020-8. [DOI] [PubMed] [Google Scholar]
- 28.Macfarlane GJ, Boyle P, Scully C. Oral cancer in Scotland: changing incidence and mortality. BMJ. 1992;305:1121–3. doi: 10.1136/bmj.305.6862.1121. [DOI] [PMC free article] [PubMed] [Google Scholar]
- 29.Macfarlane GJ, Macfarlane TV, Lowenfels AB. The influence of alcohol consumption on worldwide trends in mortality from upper aerodigestive tract cancers in men. J Epidemiol Community Health. 1996;50:636–9. doi: 10.1136/jech.50.6.636. [DOI] [PMC free article] [PubMed] [Google Scholar]
- 30.Preventing and controlling oral and pharyngeal cancer: recommendations from a National Strategic Planning Conference. MMWR Recomm Rep. 1998;47(RR14):1–12. [PubMed] [Google Scholar]
- 31.Gridley G, McLaughlin JK, Block G, et al. Diet and oral and pharyngeal cancer among blacks. Nutr Cancer. 1990;14:219–25. doi: 10.1080/01635589009514096. [DOI] [PubMed] [Google Scholar]
- 32.Ha PK, Califano JA. The role of human papillomavirus in oral carcinogenesis. Crit Rev Oral Biol Med. 2004;15:188–96. doi: 10.1177/154411130401500402. [DOI] [PubMed] [Google Scholar]
- 33.Schwartz SM, Daling JR, Doody DR, et al. Oral cancer risk in relation to sexual history and evidence of human papillomavirus infection. J Natl Cancer Inst. 1998;90:1626–36. doi: 10.1093/jnci/90.21.1626. [DOI] [PubMed] [Google Scholar]
- 34.Gillison ML, Koch WM, Capone RB, et al. Evidence for a causal association between human papillomavirus and a subset of head and neck cancers. J Natl Cancer Inst. 2000;92:709–20. doi: 10.1093/jnci/92.9.709. [DOI] [PubMed] [Google Scholar]
- 35.U.S. Department of Health and Human Services. Healthy people 2010. 21 Oral health. Washington: U.S. Department of Health and Human Services; 2000. Item 21–7. Available at: “www.healthypeople.gov/Document/HTML/Volume2/21Oral.htm”. Accessed Jan. 6, 2006.
- 36.Tomar SL, Loree M, Logan H. Racial differences in oral and pharyngeal cancer treatment and survival in Florida. Cancer Causes Control. 2004;15:601–9. doi: 10.1023/B:CACO.0000036166.21056.f9. [DOI] [PubMed] [Google Scholar]
- 37.Shavers VL, Harlan LC, Winn D, Davis WW. Racial/ethnic patterns of care for cancers of the oral cavity, pharynx, larynx, sinuses, and salivary glands. Cancer Metastasis Rev. 2003;22:25–38. doi: 10.1023/a:1022255800411. [DOI] [PubMed] [Google Scholar]
- 38.Arbes SJ, Jr, Olshan AF, Caplan DJ, Schoenbach VJ, Slade GD, Symons MJ. Factors contributing to the poorer survival of black Americans diagnosed with oral cancer (United States) Cancer Causes Control. 1999;10:513–23. doi: 10.1023/a:1008911300100. [DOI] [PubMed] [Google Scholar]
- 39.Moore RJ, Doherty DA, Do KA, Chamberlain RM, Khuri FR. Racial disparity in survival of patients with squamous cell carcinoma of the oral cavity and pharynx. Ethn Health. 2001;6:165–77. doi: 10.1080/13557850120078099. [DOI] [PubMed] [Google Scholar]
- 40.Murdock JM, Gluckman JL. African-American and white head and neck carcinoma patients in a university medical center setting: are treatments provided and are outcomes similar or disparate? Cancer. 2001;91(1 supplement):279–83. doi: 10.1002/1097-0142(20010101)91:1+<279::aid-cncr19>3.0.co;2-x. [DOI] [PubMed] [Google Scholar]
- 41.Yu GP, Ostroff JS, Zhang ZF, Tang J, Schantz SP. Smoking history and cancer patient survival: a hospital cancer registry study. Cancer Detect Prev. 1997;21:497–509. [PubMed] [Google Scholar]
- 42.Reid BC, Alberg AJ, Klassen AC, et al. Comorbidity and survival of elderly head and neck carcinoma patients. Cancer. 2001;92:2109–16. doi: 10.1002/1097-0142(20011015)92:8<2109::aid-cncr1552>3.0.co;2-m. [DOI] [PubMed] [Google Scholar]