

Abstract
An Arabidopsis mosaic death1 (mod1) mutant, which has premature cell death in multiple organs, was isolated. mod1 plants display multiple morphological phenotypes, including chlorotic and curly leaves, distorted siliques, premature senescence of primary inflorescences, reduced fertility, and semidwarfism. The phenotype of the mod1 mutant results from a single nuclear recessive mutation, and the MOD1 gene was isolated by using a map-based cloning approach. The MOD1 gene encodes an enoyl-acyl carrier protein (ACP) reductase, which is a subunit of the fatty acid synthase complex that catalyzes de novo synthesis of fatty acids. An amino acid substitution in the enoyl-ACP reductase of the mod1 mutant causes a marked decrease in its enzymatic activity, impairing fatty acid biosynthesis and decreasing the amount of total lipids in mod1 plants. These results demonstrate that a deficiency in fatty acid biosynthesis has pleiotropic effects on plant growth and development and causes premature cell death.
INTRODUCTION
Cell death has been classified into physiological cell death and nonphysiological cell death (Vaux and Korsmeyer, 1999). The former refers to a process programmed by the organism for the purpose of killing its own cells, including apoptosis, aging, terminal differentiation, and defense against pathogen infection. The latter includes cell death from injury caused by external events, such as poisons or lack of nutrients, or from intrinsic defects, such as a mutation in an essential enzyme or expression of an altered gene product that is toxic to the cells.
In plants, two types of physiological cell death have received considerable attention in recent years. One is developmentally programmed cell death (PCD), which includes the degeneration of suspensor and aleurone cells (Yeung and Meinke, 1993), the development of xylem tracheary elements (Fukuda, 1997), and the execution of senescence (Bleecker and Patterson, 1997). The other is the hypersensitive response (HR), which results in cell death at the site of infection by an avirulent pathogen. The HR produces dry lesions that are clearly delimited from the surrounding healthy tissues (Dangl et al., 1996). A large number of mutants characterized by the spontaneous lesion phenotype, which mimics the HR defense responses, have been identified in maize (Gray et al., 1997), barley (Wolter et al., 1993), rice (Marchetti et al., 1983), and Arabidopsis (Dietrich et al., 1994; Greenberg et al., 1994). Because the lesions form in the absence of pathogen infection, these mutants have been collectively called the lesion mimic mutants. In Arabidopsis, the lesion-stimulating disease mutant lsd1 has been well characterized. LSD1, a zinc finger protein, has been proposed to function as a negative regulator of plant PCD in response to signals emanating from the cells undergoing pathogen-induced HR-mediated cell death (Dietrich et al., 1997).
Blockage of metabolic processes also induces cell death in plants. For example, the maize lesion mimic mutant Les22 produces minute necrotic spots on leaves, which resemble those triggered during HR in response to pathogens (Hu et al., 1998). This phenotype reflects the accumulation of uroporphyrin, the result of an impairment in the porphyrin biosynthetic pathway. Moreover, in transgenic tobacco plants, overexpression of the transcription factor AmMYB308 inhibits phenolic acid metabolism, which leads to precocious cell death in mature leaves. Here, the cell death exhibits some characteristics of apoptosis, such as condensed nuclei, expanded chloroplasts, and DNA fragmentation (Tamagnone et al., 1998).
Compared with the porphyrin and phenolic acid biosynthetic pathways, the metabolic pathway of fatty acid biosynthesis is more complicated, playing a fundamental role in synthesis of basic cellular constituents such as phospholipids and glycerolipids (Somerville and Browse, 1991). Currently, phospholipids and glycerolipids are well recognized to function not only as essential components of the cell membranes but also as important regulators in cell proliferation, differentiation, secretion, and apoptosis (Okazaki et al., 1998). In addition, fatty acids also serve as precursors of the phytohormone jasmonic acid, which has been found in recent years to be indispensable for normal plant growth, development, and response to injury (Farmer et al., 1998). The de novo biosynthesis of fatty acids is performed by fatty acid synthase (FAS), with acetyl-coA used as the starting unit and manoyl-acyl carrier protein (ACP) as the elongator. Unlike animal FAS, which is a multifunctional protein, plant FAS is an easily dissociable multisubunit complex consisting of multiple monofunctional enzymes, including β-ketoacyl synthetase, 3-ketoacyl-ACP reductase, 3-hydroxyacyl-ACP dehydrase, and enoyl-ACP reductase (ENR) (Ohlrogge and Jaworski, 1997), the primary products of which are palmitic acid (16:0) and stearic acid (18:0). These 16:0 and 18:0 fatty acids subsequently enter multiple lipid metabolic pathways to form various glycerolipids and phospholipids, such as diacylglycerol, triacylglycerol, sphingomyelin, and ceramide; to yield very long chain fatty acids, such as cuticular waxes; or to be converted into phytohormones, such as jasmonic acid (Ohlrogge and Browse, 1995).
Many Arabidopsis mutants that are deficient in the pathway steps after the synthesis of 16:0 fatty acid (e.g., fad2 through fad8) have been isolated and characterized (Somerville and Browse, 1991; Ohlrogge and Browse, 1995). These mutants are invaluable in elucidating the complicated lipid biosynthetic pathways and investigating the roles of fatty acids in plant growth and development. However, little is known about the de novo fatty acid biosynthetic pathway from which the multiple lipid syntheses are branched. Because fatty acids are essential to all living organisms, mutations in FAS genes of the de novo biosynthetic pathway may be lethal. This would explain why no mutants deficient in fatty acid biosynthesis steps before production of the 16:0 fatty acid have been isolated in higher plants or animals (Slabas and Fawcett, 1992; Ohlrogge and Browse, 1995), although such mutants have been reported in bacteria (Egan and Russell, 1973; Turnowsky et al., 1989) and yeast (Roggenkamp et al., 1980).
In this study, we report the isolation and characterization of an Arabidopsis premature cell death mutant mod1 (for mosaic death) and the map-based cloning of the gene responsible for the phenotype. The MOD1 gene encodes an ENR, which is a component of FAS, catalyzing the final reaction in the de novo fatty acid biosynthesis cycle. A single amino acid substitution in the ENR in the plant mutant causes a marked decrease in ENR activity, which results in the impairment of de novo fatty acid biosynthesis. Phenotypic and molecular analyses of mod1 indicate that a deficiency in FAS leads to premature cell death and altered morphology in Arabidopsis plants.
RESULTS
Isolation and Genetic Analysis of the mod1 Mutant
Approximately 500,000 M2 plants derived from ethyl methanesulfonate mutagenesis were grown under continuous light at 23°C and screened for the appearance of chlorosis. One mutant with a chlorotic and curly leaf morphology was isolated and designated as mod1, based on its mosaic death pattern revealed by trypan blue staining (see below). The mutant was backcrossed to wild-type Columbia (Col-0) three times, and the homozygous mod1 line was used for in-depth analysis.
After reciprocal crosses were made between the homozygous mod1 and wild-type Col-0 plants, the phenotype of the mod1 plants was scored in the F1 and F2 generations. All 53 F1 progeny generated from reciprocal crosses grew and developed in the same way as wild-type plants. In the F2 generation, the segregation of 853 wild-type plants to 275 mutants fit the expectation for a single locus ( ;
;  ). These results indicate that mod1 carries a single recessive nuclear mutation.
Morphology of mod1 Plants
When grown under continuous light at 23°C, the typical morphology of the mod1 plants included curly leaves, chlorotic patches, early senescence of primary inflorescences, distorted siliques, reduced fertility, and semidwarfism (Figure 1). However, in seedlings with fewer than four leaves, no morphological difference was apparent between mutant and wild-type plants (Figures 1A and 1B). The initial visible abnormality of mutant plants was chlorosis in the midvein of the fifth or sixth emerging leaf and in the shoot meristems (Figures 1C and 1D). As the plants grew, most of the leaf center became chlorotic, and the lamina frequently became curly (Figures 1E, 1F, and 1K to 1N). The mutant inflorescences and flower buds were also chlorotic as they emerged, and the primary inflorescences almost always stopped growing when they were several centimeters high (Figures 1G and 1H). The premature senescence of the primary inflorescence in the mutant induced the growth of axillary buds and eventually led to the stunted semidwarf morphology. The fertility of the mutants was reduced, fewer seeds were set in the distorted siliques (Figures 1I and 1J), and the mod1 seeds had a shriveled appearance and a lower germination rate than the wild-type seeds (data not shown).
Figure 1.

The Phenotype of the mod1 Mutant.
Wild-type and mod1 plants were grown under continuous light at 23°C and photographed at the indicated number of days after imbibition.
(A) and (B) mod1 and wild-type plants at day 10.
(C) and (D) mod1 and wild-type plants at day 20.
(E) and (F) mod1 and wild-type plants at day 30.
(G) and (H) mod1 and wild-type plants at day 40.
(I) and (J) mod1 and wild-type siliques.
(K) to (M) mod1 leaves.
(N) Wild-type leaf.
 (A)
(A)  (N)
(N)  .
.
Microscopic Structure of mod1 Leaves
The phenotype of the mod1 mutants suggested that certain aspects of normal cell growth might be disrupted during plant growth and development. To investigate this possibility, we conducted a light and electron microscopic examination of wild-type and mod1 leaf structures. Compared with the smooth surface of the wild-type leaves, the epidermal cells of mod1 leaves showed a rumpled surface (Figures 2A and 2B). Moreover, unlike those of the wild type, mod1 mesophyll cells in and around the chlorotic sectors were irregular in size and shape (Figures 2C, 2D, 2G, and 2H), suggesting that the growth of mesophyll cells was abnormal in mod1 leaves. However, no irregular cell size or shape was observed in the epidermal or mesophyll cells in the healthy part of the mod1 leaves (data not shown). The mod1 mesophyll cells in chlorotic sectors had much weaker red fluorescence under UV light (Figures 2E and 2F).
Figure 2.

Light and Electron Microscopic Analysis.
(A) and (B) Scanning electron microscopy of mod1 and wild-type epidermal cells.
(C) and (D) Differential interference contrast microscopy of mod1 and wild-type mesophyll cells.
(E) and (F) A chlorotic sector (arrowhead) of a mod1 leaf (E) shows much weaker red fluorescence than a wild-type leaf (F) under UV light.
(G) and (H) mod1 mesophyll cells (G) contain fewer chloroplasts than wild-type cells (H).
(I) and (J) Transmission electron microscopy of mod1 and wild-type chloroplasts.
(K) and (L) Transmission electron microscopy of mod1 and wild-type thylakoid membranes.
 ;
;  ;
;  .
.
The latter result prompted us to scrutinize mod1 chloroplasts. Approximately eight chloroplasts were found in a mod1 mesophyll cell in the chlorotic area (Figure 2G), a marked reduction from the average of 33 chloroplasts per cell in wild-type plants (Figure 2H). Quantification of the total chlorophyll (a and b) content of the whole plants revealed a decrease from 1.18 mg per g fresh weight of tissue in the wild type to 0.84 mg per g in the mod1 mutant. Because only those cells in the chlorotic sectors showed weaker red fluorescence, the decrease in the chlorophyll content in the cells in the chlorotic sectors would be much more significant than that for the whole plant. Probably, the decrease in chloroplast number and chlorophyll content caused the chlorotic phenotype of mod1 plants. Ultrastructural studies further revealed that in and around the chlorotic sectors, mod1 grana were not well developed (Figures 2I to 2L). These morphological abnormalities and ultrastructural observations suggest that chloroplast development in mod1 abnormal leaf sectors was disturbed and that the cells in mod1 plants may undergo cell death.
Premature Cell Death in the mod1 Plants
Cell death in mod1 plants was subsequently demonstrated by staining with trypan blue, a dye that is widely used to stain dying cells during pathogen-induced PCD (Keogh et al., 1980; Dietrich et al., 1994; Botella et al., 1998; Kamoun et al., 1998; McDowell et al., 1998). When morphologically abnormal mod1 plants were subjected to trypan blue staining, we found a mosaic pattern of positive staining in leaf mesophyll cells, siliques (Figures 3A to 3D), and roots (data not shown). Under high magnification, single and clustered stained cells were found to have condensed cytoplasm (Figures 3E to 3H), which is reminiscent of animal apoptosis (Wyllie et al., 1980). Furthermore, we conducted several experiments to investigate whether nuclear DNA fragmentation had occurred in mod1 plants, because DNA fragmentation is one of the characteristics of apoptosis (Bush et al., 1989; Cohen, 1993; Kuo et al., 1996; Wang et al., 1996). DNA gel blot analysis showed an apparent DNA ladder in the total DNA isolated from mod1 plants (Figure 4, lane 1), whereas this pattern of DNA fragmentation was barely detectable in wild-type plants at an identical developmental stage (Figure 4, lane 2).
Figure 3.

Histochemical Staining with Trypan Blue.
(A) to (D) Trypan blue–stained mod1 and wild-type leaves and siliques, demonstrating a mosaic staining pattern in mod1 plants ([A] and [C]).
(E) to (H) High magnification of stained single and clustered mod1 leaf cells.
 ; b
; b ;
;  .
.
Figure 4.
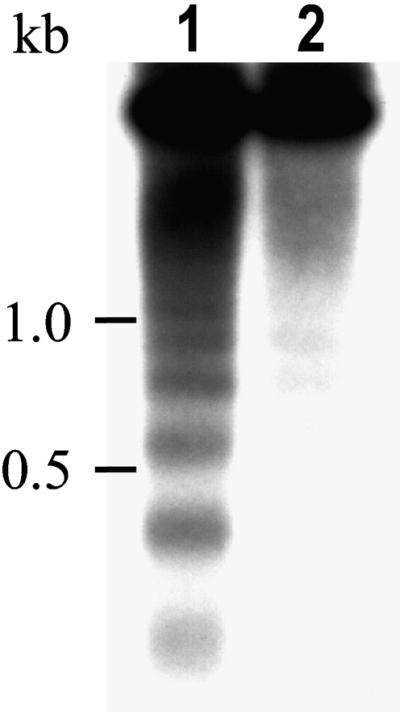
DNA Fragmentation in mod1 Plants.
The DNA ladder of mod1 plants was detected by DNA gel blot analysis with a 32P-labeled total DNA digested with Sau3AI. Equal amounts of total DNA isolated from mod1 and wild-type plants at the same developmental stage were loaded in each lane. Lane 1, DNA isolated from mod1 plants; lane 2, DNA isolated from wild-type plants. Positions of DNA standards (identified in kilobases) are indicated at left.
mod1 Mutants Are Sensitive to Temperature
To investigate the influence of physiological and environmental factors on the phenotype of mod1 mutants, we examined the plants under various growth conditions. Although plant nutrients and growth regulators, such as indole-3-acetic acid, cytokinin (kinetin), abscisic acid, and gibberellin (GA3), had no effect on the phenotype of the mod1 mutants (data not shown), temperature had a strong influence. When grown under continuous light at an above-normal temperature (26°C), mod1 plants showed mutant characteristics at the four-leaf stage by day 20 (data not shown) and developed a severe phenotype by day 40 (Figures 5A and 5B). The extreme phenotype included markedly shortened inflorescences and substantially delayed flowering time with reduced fertility. In contrast, mod1 plants grown at 23°C showed only a moderate semidwarf phenotype and slightly reduced fertility (Figure 1G). When mod1 plants were grown at an even lower temperature (20°C), the phenotype was even less affected (Figures 5C and 5D).
Figure 5.

Effect of Temperature on mod1 Plants.
(A) and (B) mod1 and wild-type plants grown under continuous light at 26°C for 40 days.
(C) and (D) mod1 and wild-type plants grown under continuous light at 20°C for 40 days.
Map-Based Cloning of the MOD1 Locus
To map the MOD1 locus, we crossed the homozygous mod1 line (Col-0 background) to the polymorphic ecotype Landsberg erecta (Ler) and self-pollinated the F1 progeny to yield an F2 mapping population. Linkage analysis of 822 F2 plants that showed the mod1 mutant phenotype placed the MOD1 locus at the top of chromosome 2, between the molecular markers IGS1 and mi421 (Figure 6A). The three yeast artificial chromosome (YAC) ends within this interval, CIC9A3R, CIC11C7L, and CIC2G5R, were isolated and tested for polymorphisms between the Col-0 and Ler genetic backgrounds. CIC9A3R was converted into a cleaved amplified polymorphic sequence (CAPS) marker, mapped, and found to be the closest marker to MOD1 on the telo-meric side of the locus (Figure 6A). To narrow the search for the MOD1 locus, we hybridized the three YAC ends (CIC9A3R, CIC11C7L, and CIC2G5R) and the restriction fragment length polymorphism marker CDs3 to a bacterial artificial chromosome (BAC) library and identified 31 BAC clones. A contig was constructed, and four new CAPS markers (TAMU6P5-4.8, TAMU18A18E1, TAMU18A18E2 and TAMU12A21E1) were further developed (Figure 6A). Recombination analysis of 2014 F2 mutants indicated that the MOD1 locus was located in the interval between TAMU6P5-4.8 and CIC9A3R. DNA gel blot analysis showed that both markers were in the same BAC clone, TAMU6P5 (Figure 6A). Therefore, we screened a λ genomic library, using these two markers as probes, and obtained two overlapping λ clones. Two new CAPS markers, T6P5-14 and T6P5-11, were further derived from these λ DNA fragments, and the MOD1 locus was further delimited within a 9-kb region (Figure 6A).
Figure 6.

Molecular Identification of the mod1 Gene.
(A) Physical mapping of the mod1 locus.
(B) The two DNA fragments used for complementation of the mod1 mutant. A, AccI; B, BamHI; E, EcoRI; X, XbaI.
(C) Structure of the ENR gene and its mutation in the mod1 plant. The start codon (ATG) and stop codon (TAG) are indicated. The GenBank accession number for ENR cDNA (Col-0) is AF207593. Filled boxes denote the coding sequence; open boxes, 5′ and 3′ untranslated regions; lines between boxes, introns.
(D) DNA polymorphism between mod1 and wild-type plants. The mutation in the mod1 genomic DNA introduces a new EcoRV site. The DNA fragments flanking the EcoRV site were amplified from the wild-type (Col-0) and mod1 plants, digested with EcoRV, and separated on an agarose gel.
We then subcloned and sequenced the 9-kb wild-type Col-0 DNA fragment and compared its sequence with the DNA and protein databases. BLAST analysis identified several DNA sequences encoding ENR in Arabidopsis ecotype Ler (GenBank accession number Y13860), oilseed rape (GenBank accession number X95462), rice (GenBank accession number AJ003025), and tobacco (GenBank accession number Y13861), in addition to the sequence of BAC clone TAMU6P5 (GenBank accession number AC005970). Annotation of the 9-kb genomic DNA region indicated that it contains a complete ENR gene and a partial open reading frame for reverse transcriptase. These results suggested that MOD1 might encode ENR.
Confirmation That MOD1 Encodes ENR by Complementation
To confirm that the MOD1 locus encodes ENR, we constructed two pBI101-derived binary plasmids, pJL635 and pJL656 (Figure 6B), and transformed mutants with these plasmids by using Agrobacterium (Bechtold et al., 1993). Plasmid pJL635 carries a 7-kb genomic DNA fragment containing the entire ENR open reading frame and 4 kb of upstream sequence, whereas plasmid pJL656 carries a 6.5-kb fragment containing a partial ENR open reading frame. As summarized in Table 1, all pJL635 T1 transformants grew and developed in the same way as wild-type plants, whereas none of the pJL656 T1 transformants showed complementation of the phenotype of the mod1 mutants. These results indicate that the mutation in ENR is responsible for the abnormal morphology of the mod1 plants. This conclusion was further supported by the segregation ratio of the T2 progeny from six self-pollinated pJL635 lines (Table 1). Lines 1 to 4 and 6 showed a 3:1 segregation, which is consistent with a single copy of the MOD1 transgene. Line 5 showed 15:1 segregation, which is consistent with the insertion of two copies of MOD1 at unlinked loci in this transgenic line.
Table 1.
Complementation of mod1 by Transformation
| Phenotype
|
||||||
|---|---|---|---|---|---|---|
| Generation | Line | Totala | Wild typeb | Mutantb | χ2 | P Value |
| T1 (pJL635) | 82 | 82 | 0 | |||
| T1 (pJL656) | 8 | 0 | 8 | |||
| T2 (pJL635) | 1 | 50 | 39 | 11 | 0.24c | 0.62 |
| 2 | 25 | 19 | 6 | 0.013c | 0.91 | |
| 3 | 8 | 6 | 2 | 0c | 1 | |
| 4 | 40 | 31 | 9 | 0.133c | 0.72 | |
| 5 | 30 | 28 | 2 | 0.009d | 0.92 | |
| 6 | 21 | 16 | 5 | 0.016c | 0.90 | |
Total number of transgenic plants analyzed.
Number of plants that showed wild-type or mutant phenotype.
χ2 values were calculated for a hypothesized 3:1 ratio of wild-type to mutant phenotype for T2 segregation.
χ2 values were calculated for a hypothesized 15:1 ratio of wild-type to mutant phenotype for T2 segregation.
To find the mutation in the mutant ENR gene, we amplified DNA fragments encompassing the gene by polymerase chain reaction from the mutant plants. DNA sequencing revealed a single base substitution of T for C in the mutant ENR gene (Figure 6C), a substitution that introduced an EcoRV restriction site into the mod1 genome. We then used this feature to develop a CAPS marker that would distinguish the mutant from the wild type genotypically (Figure 6D) when analyzing transgenic plants during complementation experiments.
Molecular Properties of the ENR Gene in Arabidopsis
DNA gel blot analysis indicates that the Arabidopsis Col-0 ecotype contains only one copy of ENR (Figure 7), consistent with the finding in Ler (Stuitje et al., 1993). Using the ENR gene as a probe, we isolated ENR cDNAs from an Arabidopsis cDNA library (Col-0). Sequence analysis indicated that the predicted Col-0 ENR protein is virtually identical to that of Ler (Stuitje et al., 1993), except for two amino acid residues. The ENR genes from both the Col-0 and Ler ecotypes contain one intron in the 5′ untranslated region and 10 introns in the coding region (Figure 6C), and they encode predicted polypeptides of 390 amino acid residues with a calculated molecular mass of 41.3 kD. Moreover, the ENR gene of Col-0 contains one abnormal GC splice junction in the seventh intron, as do the corresponding genes in Ler and rapeseed (Stuitje et al., 1993). As previously observed for other plant ENR proteins (Kater et al., 1991), the Arabidopsis protein possesses a putative plastid transit sequence, an N-terminal extension not present in the corresponding microbial proteins (Bergler et al., 1994). This is consistent with the biochemical finding that in plants, de novo fatty acid biosynthesis occurs in plastids (Ohlrogge and Jaworski, 1997).
Figure 7.
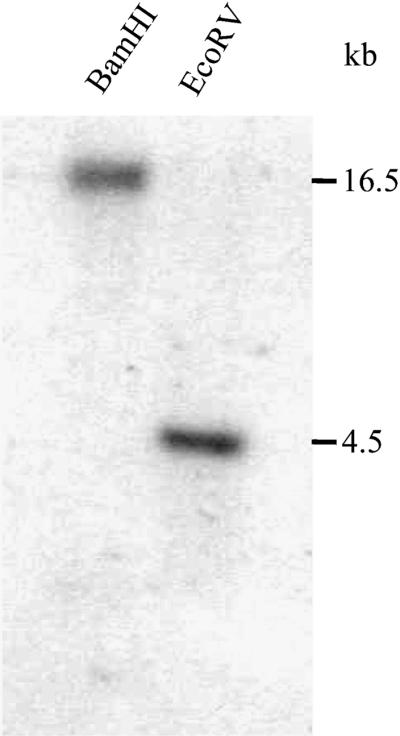
DNA Gel Blot Analysis.
Arabidopsis Col-0 DNA was digested separately with BamHI and EcoRV and transferred onto a Hybond N+ membrane. The filter was probed with an ENR gene fragment. Lengths of DNA fragments in kilobases are indicated at right.
The mod1 Mutation Causes a Marked Decrease in ENR Enzymatic Activity
To understand the effect of the mod1 mutation on ENR, we compared the amounts of mRNA and protein and the enzymatic activity between wild-type and mod1 plants. RNA gel blot analysis revealed no substantial differences between wild-type and mod1 plants (data not shown). Although protein gel blot analysis showed that the amount of ENR protein in mod1 was ∼50% less than that in wild-type plants (Figure 8A), this difference in quantity could not adequately explain the marked difference in enzymatic activity between wild-type and mod1 mutant plants (Figure 8B). Therefore, we concluded that in mod1 plants, the C-to-T missense mutation, which in turn encodes a hydrophobic Ile residue instead of a hydrophilic Thr residue, resulted in a large decrease in ENR enzymatic activity.
Figure 8.

ENR Protein Content and Its Enzymatic Activity in mod1 and Wild-Type Plants.
(A) Protein gel blot analysis. Protein samples prepared from mod1 and wild-type (WT) plants 30 days after imbibition and from siliques 15 days after flowering were analyzed by immunoblotting. The arrow indicates the nonspecific protein, which served as a loading control.
(B) ENR activity in Arabidopsis leaves and siliques. Samples were prepared from the leaves and siliques of mod1 and wild-type (WT) plants. ENR activity is shown as mean ±se ( ).
).
A Deficiency in ENR Leads to a Decrease in Total Lipid Content in mod1 Plants
In plant cells, almost all the fatty acids are found to be esterified or otherwise modified into lipid forms, such as glycerolipids, triacylglycerol, and cuticular lipids (Topfer et al., 1995). To determine whether fatty acid biosynthesis was affected in mod1 plants, we extracted total lipids from wild-type and mod1 plants grown at 20 or 26°C. The total lipid contents of the mod1 plants grown at 20 or 26°C were 9 and 12% lower, respectively, than those of the wild type (Figure 9). These results indicate that the mod1 mutation does indeed affect fatty acid biosynthesis, which in turn causes a reduction in total lipid content.
Figure 9.

Comparison of Total Lipid Contents between mod1 and Wild-Type Plants.
Total lipid content was determined in 10-g samples of fresh rosette leaves from 4-week-old plants. The total lipid contents are shown as mean ±se ( ).
).
DISCUSSION
It has long been recognized that cell death is required in plant growth and development. Recent studies have found that plant cell death often has some of the characteristics of apoptosis described for animal cells, such as condensation and shrinkage of the cytoplasm and nucleus and fragmentation of the nuclear DNA (Greenberg, 1996). Despite these similarities between cell death in plants and animals, it is unclear whether cell death is mediated by the same mechanisms in both kingdoms (Pennell and Lamb, 1997). To understand the process of cell death in plants, we took a genetic approach in screening for cell death mutants in Arabidopsis and isolated a novel premature cell death mutant, mod1. We have systematically characterized this mutant and cloned the gene responsible for the mutant phenotype. The MOD1 gene encodes an ENR that catalyzes the last reduction step in the de novo fatty acid biosynthesis cycle. A single amino acid substitution in mod1 ENR causes a marked decrease in ENR activity, which leads to a reduction of ∼10% in total lipid content in mod1 plants and severe morphological phenotypes.
The de novo fatty acid biosynthesis pathway is one of the most important primary metabolic pathways in all cellular organisms, generating the palmitic and stearic acids that serve as the precursors for other fatty acids of different lengths and saturation levels. In plant cells, most fatty acids are found in lipid forms, such as diacylglycerol, sphingomyelin, and ceramide, which function either as essential components of cell membranes or as important regulators of cell growth and differentiation (Ohlrogge and Browse, 1995; Topfer et al., 1995; Okazaki et al., 1998). Therefore, a null mutation that completely blocks de novo fatty acid biosynthesis would almost certainly be lethal. Even though ENR activity in mod1 plants is barely detectable, the mutant still accumulates ∼90% of the total lipid content of wild-type plants. This suggests that the in vivo activity of ENR is in excess in wild-type plants to the extent that its residual activity in mod1 is able to support the minimal biosynthesis of fatty acids required for mod1 growth.
The reduction in total lipid content in mod1 plants is consistent with data for the bacterial temperature-sensitive mutant envM, which is also deficient in ENR activity (Bergler et al., 1994). When envM mutant plants were shifted to a nonpermissive high temperature, fatty acid and phospholipid biosynthesis were profoundly inhibited (Bergler et al., 1992; Kater et al., 1994). Like the bacterial envM mutant, the Arabidopsis mod1 mutant is also sensitive to temperature. The morphological abnormalities of mod1 plants are much more severe at 26 than at 20°C (Figure 5). Because no differences in ENR activities were detected between the high and low temperatures (data not shown), the temperature sensitivity of mod1 plants may not originate from the temperature sensitivity of ENR itself but rather from abnormal cell membranes, the result of deficiencies in fatty acids.
Impairment of fatty acid biosynthesis interferes with the integration of cell membranes. When bacterial cells in early logarithmic phase were treated with diazaborine, an inhibitor of fatty acid synthesis that targets ENR, the majority of the rod-shaped cells showed zones of enhanced transparency at the poles, the result of retraction of the inner membrane (Turnowsky et al., 1989). A similar morphological alteration was observed when envM mutant bacteria were cultured under nonpermissive conditions (Turnowsky et al., 1989). In both cases, the shrunken cell phenotypes resulted from insufficient fatty acid synthesis by way of inhibition of the ENR activities. In mod1, which also bears a defective ENR, the chloroplast thylakoid membrane in the chlorotic sectors was severely disorganized, suggesting that the cell membrane system may also be affected to some degree. This might explain why mesophyll cells in mod1 chlorotic sectors are irregular in size and shape (Figure 2). Furthermore, the different sizes and shapes of mod1 cells are indicative of uneven cell growth and expansion, which we believe progressively causes the curling of leaves and siliques.
Lipids are major building blocks of cell membrane. Cells in young tissues need a sufficient supply of these basic building materials for vigorous growth or division. The high expression of ENR seen in young leaves and shoot and root meristems (Ohlrogge and Jaworski, 1997) may explain why the chlorotic phenotype always appears in young tissues in mod1, such as newly emerging leaves, inflorescences, and siliques. However, the chlorotic phenotype does not appear in mod1 seedlings; at this stage, fatty acid synthesis must still be sufficient to support slow growth.
Interruption of a vital metabolic process inevitably leads to cell death (Vaux and Korsmeyer, 1999). In human cancer cells, fatty acid synthetic metabolism is abnormally increased. Inhibition of FAS in tumor cells induces apoptosis by producing rapid and profound inhibition of DNA replication and S phase progression (Pizer et al., 1998). In mod1 plants, impairment of fatty acid biosynthesis resulting from deficiency of ENR will also induce cell death; however, only a few cells actually die. The mosaic death pattern might be explained as follows. In mod1 plants, the deficiency in ENR leads to reduction in fatty acid biosynthesis, which in turn affects the integration of cell membranes. As a result, some cells become more vulnerable and start the death process, which might then release some signals to induce their surrounding cells to undergo cell death and form the morphologically defective clusters (Figures 3E to 3H).
Although condensed cytoplasm and a DNA ladder were observed, we are not certain whether cell death in mod1 plants is an active apoptotic process. In cellular organisms, fatty acids function in constructing the cell membrane and regulating cell proliferation, differentiation, and apoptosis (Okazaki et al., 1998). According to our current understanding and classification, cell death originating from the lack of an essential compound is thought to be nonphysiological (Vaux and Korsmeyer, 1999). However, physiological cell death (apoptosis) induced or inhibited by lipids such as sphingomyelin, ceramide, and diacylglycerol has been well established in animal cells (Jarvis et al., 1994; Dawson et al., 1998). Therefore, the cell death observed in mod1 plants may result from the lack of essential compounds, the alteration of signaling molecules, or both. Further investigation is needed to address this important question.
Plant cell death resulting from the impairment of metabolic pathways has been described in tobacco and maize. Overexpression of the transcription factor AmMYB308 in transgenic tobacco inhibits the metabolism of phenolic acid, leading to a deficiency in antioxidants of phenolic acid esters and a subsequent increase in the concentration of reactive oxygen species that trigger cell death (Tamagnone et al., 1998). In the maize mutant Les22, impairment of the porphyrin biosynthesis pathway results in accumulation of uroporphyrin, which induces the production of cell-damaging oxygen free radicals (Hu et al., 1998). In both cases, cell death is actually caused by the toxic compounds generated by the altered metabolic pathways.
The Arabidopsis mod1 mutant represents a new class of cell death mutants that are deficient in fatty acid synthesis. Investigation of mod1 plants will allow us to gain insight into the signal transduction of cell death resulting from the impairment of a primary metabolic pathway (Vaux and Korsmeyer, 1999). The temperature sensitivity of the mod1 mutant is also useful in identifying genes whose expression is regulated when the stress of high temperature is applied. In addition, the mod1 mutant can be used in elucidating regulatory mechanisms of the de novo fatty acid biosynthetic pathway in plants.
METHODS
Plant Growth
Plants (Arabidopsis thaliana) were grown basically on vermiculite saturated with 0.3 × B5 medium under continuous illumination (80 to 120 μE m−2 sec−1) at 23°C, as described previously (Li et al., 1993), or under the conditions specified in the text. For treatment with high temperature (26°C), plants were geminated and grown at normal temperature (23°C) for 10 days after imbibition and then transferred into a high-temperature growth room. For assessing the effects of plant hormones or nutrients, plants were grown on PNS medium (Haughn and Somerville, 1986) containing the tested supplement as indicated.
Mutant Screening
The mod1 mutant was identified by growing M2 seeds on vermiculite under continuous light at 23°C. M2 seeds in the Columbia (Col-0) genetic background were obtained by mutagenesis with ethyl methanesulfonate, as described by Barczak et al. (1995). Putative programmed cell death (PCD) mutants were identified by examining for chlorotic morphology after 4 weeks of growth and then allowed to self-pollinate. The phenotype of M3, F1, or F2 seeds was confirmed under the growth conditions described above.
Histochemistry and Microscopy
Four-week-old leaves were fixed in formalin–glacial acetic acid–70% ethanol (1:1:18) for 48 hr and transferred into 70% ethanol. Samples were rinsed in 50% ethanol and then distilled water and were directly mounted for the observation of mesophyll cells under a differential interference contrast microscope (model BH-2; Olympus, Tokyo, Japan). For chloroplast observations, samples were stained with 0.1% safranin O for 10 min, rinsed with distilled water, and hydrolyzed with 0.1 M HCl in a 50°C water bath for 20 min. The hydrolyzed samples were then mounted and observed under a light microscope (model BH-2; Olympus). Trypan blue staining was performed as previously described (Keogh et al., 1980; Bowling et al., 1997; Peterhänsel et al., 1997). Samples were covered with an alcoholic lactophenol trypan blue mixture (30 mL of ethanol, 10 g of phenol, 10 mL of water, 10 mL of glycerol, 10 mL of lactic acid, and 10 mg of trypan blue), placed in a boiling water bath for 2 to 3 min, and then left at room temperature for 1 hr. The samples were transferred into a chloral hydrate solution (2.5 g mL−1) and boiled for 20 min to destain. After multiple exchanges of chloral hydrate solution to reduce the background, samples were equilibrated with 50% glycerol, mounted, and observed with a stereomicroscope (model SZX-12; Olympus).
Chlorophyll Fluorescence and Chlorophyll Quantification
To observe UV-induced chlorophyll fluorescence, we peeled away the epidermis of fresh leaves and observed the mesophyll under long-wavelength (365 nm) UV light with a fluorescence microscope (model BX-60; Olympus). Chlorophyll concentrations were calculated from the absorbance at 646 and 663 nm in an 80% (v/v) acetone extract, as described by Lichtenthaler (1987).
Electron Microscopy
Samples were prepared as described by Dörmann et al. (1995) and Itoh et al. (1998), with some modifications. Briefly, rosette leaves of 3- to 4-week-old plants were fixed with 4% (v/v) glutaraldehyde in 0.1 M sodium phosphate buffer, pH 7.2, and incubated at 4°C overnight. After being rinsed with 0.1 M sodium phosphate buffer, pH 7.2, they were postfixed in 1% (w/v) osmium tetroxide for 2 hr at 4°C and rinsed with the same buffer. Samples were then dehydrated in a graded series of ethanol. For scanning electron microscopy, 100% ethanol was replaced with 3-methylbutyl acetate. Samples were critical-point dried, sputter-coated with platinum, and observed under a scanning electron microscope (model S-570; Hitachi, Tokyo, Japan). For transmission electron microscopy, samples were embedded in Spurr's epoxy resin. Ultrathin sections (70 nm) were stained with uranyl acetate and viewed in a transmission electron microscope (model EM-200; Hitachi).
DNA Gel Blot Analysis
Total Arabidopsis DNA isolated from 4-week-old plants was prepared as previously described (Li et al., 1995). For gel blot analysis of DNA fragmentation, equal amounts of DNA from mod1 or wild-type plants were separated by 2% agarose gel electrophoresis immediately after isolation. The DNA was then transferred onto a Hybond N+ membrane (Amersham) and hybridized with a 32P-labeled Sau3AI-digested genomic DNA probe. For analysis of the ENR gene copy number in Arabidopsis, genomic DNA was completely digested with BamHI and EcoRV and then separated in a 0.8% agarose gel. DNA was transferred onto a Hybond N+ filter. Blots were prehybridized at 65°C in prehybridization solution (6 × SSC [1 × SSC is 0.15 M NaCl and 0.015 M sodium citrate], 0.5% SDS, 100 μg mL−1 denatured salmon sperm DNA, and 5 × Denhardt's solution [1 × Denhardt's solution is 0.02% Ficoll, 0.02% polyvinylpyrrolidone, and 0.02% BSA]) for 3 hr and hybridized at 65°C in prehybridization solution containing 32P-labeled ENR fragment DNA probes. Blots were then washed under low-stringency conditions (5 min in 2 × SSC and 0.1% SDS at room temperature and 10 min in 1 × SSC and 0.1% SDS at room temperature).
Genetic Analysis and Primary Mapping of the mod1 Locus
Homozygous mosaic death mod1 plants generated from three rounds of backcrosses with wild-type Col-0 were used in standard genetic analysis and mapping, as previously described (Li and Last, 1996). The phenotype of the mod1 mutant was scored after 3 to 4 weeks of growth under continuous light at 23°C. An F2 mapping population was generated from crosses between mod1 (in the Col-0 background) and the polymorphic Landsberg erecta (Ler) ecotype. The F1 progeny were allowed to self-pollinate, and the F2 plants were scored for chlorosis and curled leaves. DNA was prepared from the parental, F1, and 822 F2 mutant progeny. The genetic linkage between mod1 and molecular markers was determined by using codominant polymerase chain reaction–based cleaved amplified polymorphic sequences (CAPS) markers (Konieczny and Ausubel, 1993) or microsatellite markers (Bell and Ecker, 1994), and analyzed with Mapmaker (Lander et al., 1987). The restriction fragment length polymorphism marker mi421 was converted into a CAPS marker by sequencing the clone and designing primers based on its sequence. After determining that mod1 lay between IGS1 and mi421, we used these two CAPS markers to identify recombinants from 2014 F2 mapping plants, obtaining 54 and 14 recombinants, respectively.
Fine Mapping of the mod1 Locus
Yeast artificial chromosome (YAC) clones covering the interval between IGS1 and mi412 (Zachgo et al., 1996) were used to isolate their ends (CIC9A3R, CIC11C7L, and CIC2G5R) through inverse polymerase chain reaction or plasmid rescue, as described previously (Gibson and Somerville, 1992). The three YAC ends and a restriction fragment length polymorphism marker CDs3 were sequenced to test polymorphisms between Col-0 and Ler. Only CIC9A3R was converted into a CAPS marker. Linkage analysis placed the mod1 locus between CIC9A3R and mi421. We then screened the TAMU bacterial artificial chromosome (BAC) library (Choi et al., 1995), using CIC9A3R, CIC11C7L, CIC2G5R, and CDs3 as probes, and identified 31 BAC clones. A contig consisting of TAMU6P5, TAMU7M23, TAMU12A21, and TAMU18A18 was constructed (Mou et al., 2000). Four new CAPS markers (TAMU6P5-4.8, TAMU18A18E1, TAMU18A18E2, and TAMU12A21E1) were developed, and the mod1 locus was narrowed down to the interval between TAMU6P5-4.8 and CIC9A3R. Both markers were used to isolate genomic clones from a phage library (Col-0). The DNA fragments of CAPS markers were amplified under the following conditions: denaturation at 94°C for 3 min, 45 cycles (94°C for 1 min, 56°C for 1 min, and 72°C for 2 min), and final extension at 72°C for 10 min. The detailed information of all the newly developed CAPS markers has been deposited in the Arabidopsis public database.
Complementation of mod1
A T-DNA binary vector was derived from pBI101 (Clontech, Palo Alto, CA) as follows. The pBI101 vector was digested with SmaI and EcoRI, blunted with the Klenow fragment of DNA polymerase I, and self-ligated to form a new binary vector, pJL482. A 7.0-kb BamHI genomic DNA fragment (Figure 6C) was ligated to pJL482, forming pJL635, which contains the entire ENR gene and sufficient cis elements. Meanwhile, a 6.5-kb genomic DNA containing a partial ENR gene and 5′ upstream sequence was inserted into pJL482, generating pJL656. Both pJL635 and pJL656 were introduced into the Agrobacterium strain GV3101(pMP90) by electroporation and were used to transform mod1 plants by means of vacuum infiltration (Bechtold et al., 1993). The phenotype of the mod1 mutant was scored in T1 transformants and T2 progeny.
Protein Gel Blot Analysis
The MfeI (blunt-ended)-EcoRI fragment of the full-length ENR cDNA (pJL659) was cloned into the SmaI-EcoRI–digested Escherichia coli expression vector pGEX2T (Pharmacia) and then introduced into E. coli by electroporation. The expression and purification of the fusion protein, antibody preparation, and immunological detection were conducted as previously described (Liu et al., 1999). Protein was extracted from Arabidopsis leaves and siliques as described by Fawcett et al. (1994), aliquoted into 50-μL lots, and stored at −80°C.
ENR Activity Assay and Total Lipid Determination
ENR activity was measured by monitoring the decrease in absorbance at 340 nm, as described by Slabas et al. (1986). Protein content was measured with the Bio-Rad protein assay kit, and 50 μg of protein was used for each ENR activity assay. Total lipid content was determined by using the Soxhlet extraction method (Zhong, 1985). Briefly, 10 g of fresh rosette leaves of 4-week-old plants was dried at 80°C for 4 hr and ground into powder with a mortar. The powder was completely extracted with ether in a Soxhlet apparatus in a 70 to 80°C waterbath for 8 to 10 hr.
Acknowledgments
We thank David Stern, Xinnian Dong, and Daowen Wang for comments on the manuscript, Jian Ouyang for technical assistance in computer-generated graphics, and Guangjun Dong for assistance with electron microscopy. Gifts of Arabidopsis M2 seeds from Robert L. Last (Cereon Genomics LLP, Cambridge, MA), CDs3 DNA clone from Georges Picard (University of Blaise Pascal, Aubière, France), and GV3101(pMP90) from Stanton B. Gelvin (Purdue University, West Lafayette, IN) are much appreciated. The TAMU BAC library filters and the clones (BAC, YAC, and mi421 plasmid) were provided by the Arabidopsis Biological Resource Center (Ohio State University, Columbus). This research was supported by grants from the National Natural Science Foundation of China and the High Technology Program and a National Distinguished Young Scholar Award to J.L.
References
- Barczak, A.J., Zhao, J., Pruitt, K.D., and Last, R.L. (1995). 5-Fluoroindole resistance identifies tryptophan synthase beta subunit mutants in Arabidopsis thaliana. Genetics 140, 303–313. [DOI] [PMC free article] [PubMed] [Google Scholar]
- Bechtold, N., Ellis, J., and Pelletier, G. (1993). In planta Agrobacterium–mediated gene transfer by infiltration of adult Arabidopsis thaliana plants. C.R. Acad. Sci. Ser. III Sci. Vie 316 1194–1199. [Google Scholar]
- Bell, C.J., and Ecker, J.R. (1994). Assignment of 30 microsatellite loci to the linkage map of Arabidopsis. Genomics 19 137–144. [DOI] [PubMed] [Google Scholar]
- Bergler, H., Hogenauer, G., and Turnowsky, F. (1992). Sequences of the envM gene and of two mutated alleles in Escherichia coli. J. Gen. Microbiol. 138 2093–2100. [DOI] [PubMed] [Google Scholar]
- Bergler, H., Wallner, P., Ebeling, A., Leitinger, B., Fuchsbichler, S., Aschauer, H., Kollenz, G., Hogenauer, G., and Turnowsky, F. (1994). Protein EnvM is the NADH-dependent enoyl-ACP reductase (FabI) of Escherichia coli. J. Biol. Chem. 269 5493–5496. [PubMed] [Google Scholar]
- Bleecker, A.B., and Patterson, S.E. (1997). Last exit: Senescence, abscission, and meristem arrest in Arabidopsis. Plant Cell 9 1169–1179. [DOI] [PMC free article] [PubMed] [Google Scholar]
- Botella, M.A., Parker, J.E., Frost, L.N., Bittner-Eddy, P.D., Beynon, J.L., Daniels, M.J., Holub, E.B., and Jones, J.D. (1998). Three genes of the Arabidopsis RPP1 complex resistance locus recognize distinct Peronospora parasitica avirulence determinants. Plant Cell 10 1847–1860. [DOI] [PMC free article] [PubMed] [Google Scholar]
- Bowling, S.A., Clarke, J.D., Liu, Y., Klessig, D.F., and Dong, X. (1997). The cpr5 mutant of Arabidopsis expresses both NPR1-dependent and NPR1-independent resistance. Plant Cell 9 1573–1584. [DOI] [PMC free article] [PubMed] [Google Scholar]
- Bush, D.S., Biswas, A.K., and Jones, R.L. (1989). Gibberellic acid–stimulated Ca2+ accumulation in endoplasmic reticulum of barley aleurone: Ca2+ transport and steady-state levels. Planta 178 411–420. [DOI] [PubMed] [Google Scholar]
- Choi, S., Creelman, R.A., Mullet, J.E., and Wing, R.E. (1995). Construction and characterization of a bacterial artificial chromosome library of Arabidopsis thaliana. Plant Mol. Biol. Rep. 13 124–128. [Google Scholar]
- Cohen, J.J. (1993). Apoptosis. Immunol. Today 14 126–130. [DOI] [PubMed] [Google Scholar]
- Dangl, J.L., Dietrich, R.A., and Richberg, M.H. (1996). Death don't have no mercy: Cell death programs in plant–microbe interactions. Plant Cell 8 1793–1807. [DOI] [PMC free article] [PubMed] [Google Scholar]
- Dawson, G., Goswami, R., Kilkus, J., Wiesner, D., and Dawson, S. (1998). The formation of ceramide from sphingomyelin is associated with cellular apoptosis. Acta Biochim. Pol. 45 287–297. [PubMed] [Google Scholar]
- Dietrich, R.A., Delaney, T.P., Uknes, S.J., Ward, E.R., Ryals, J.A., and Dangl, J.L. (1994). Arabidopsis mutants simulating disease resistance response. Cell 77 565–577. [DOI] [PubMed] [Google Scholar]
- Dietrich, R.A., Richberg, M.H., Schmidt, R., Dean, C., and Dangl, J.L. (1997). A novel zinc finger protein is encoded by the Arabidopsis LSD1 gene and functions as a negative regulator of plant cell death. Cell 88 685–694. [DOI] [PubMed] [Google Scholar]
- Dörmann, P., Hoffmann-Benning, S., Balbo, I., and Benning, C. (1995). Isolation and characterization of an Arabidopsis mutant deficient in the thylakoid lipid digalactosyl diacylglycerol. Plant Cell 7 1801–1810. [DOI] [PMC free article] [PubMed] [Google Scholar]
- Egan, A.F., and Russell, R.R.B. (1973). Conditional mutations affecting the cell envelope of Escherichia coli K-12. Genet. Res. 21 139–152. [DOI] [PubMed] [Google Scholar]
- Farmer, E.D., Weber, H., and Vollenweider, S. (1998). Fatty acid signaling in Arabidopsis. Planta 206 167–174. [DOI] [PubMed] [Google Scholar]
- Fawcett, T., Simon, W.J., Swinhoe, R., Shanklin, J., Nishida, I., Christie, W.W., and Slabas, A.R. (1994). Expression of mRNA and steady-state levels of protein isoforms of enoyl-ACP reductase from Brassica napus. Plant Mol. Biol. 26 155–163. [DOI] [PubMed] [Google Scholar]
- Fukuda, H. (1997). Tracheary element differentiation. Plant Cell 9 1147–1156. [DOI] [PMC free article] [PubMed] [Google Scholar]
- Gibson, S.I., and Somerville, C.R. (1992). Chromosome walking in Arabidopsis thaliana using yeast artificial chromosomes. In Methods in Arabidopsis Research, C. Koncz, N.-H. Chua, and J. Schell, eds (Singapore: World Scientific), pp. 119–143.
- Gray, J., Close, P.S., Briggs, S.P., and Johal, G.S. (1997). A novel suppressor of cell death in plants encoded by the Lls1 gene of maize. Cell 89 25–31. [DOI] [PubMed] [Google Scholar]
- Greenberg, J.T. (1996). Programmed cell death: A way of life for plants. Proc. Natl. Acad. Sci. USA 93 12094–12097. [DOI] [PMC free article] [PubMed] [Google Scholar]
- Greenberg, J.T., Guo, A., Klessig, D.F., and Ausubel, F.M. (1994). Programmed cell death in plants: A pathogen-triggered response activated coordinately with multiple defense functions. Cell 77 551–563. [DOI] [PubMed] [Google Scholar]
- Haughn, G.W., and Somerville, C. (1986). Sulfonylurea-resistant mutants of Arabidopsis thaliana. Mol. Gen. Genet. 204 430–434. [Google Scholar]
- Hu, G., Yalpani, N., Briggs, S.P., and Johal, G.S. (1998). A porphyrin pathway impairment is responsible for the phenotype of a dominant disease lesion mimic mutant of maize. Plant Cell 10 1095–1105. [DOI] [PMC free article] [PubMed] [Google Scholar]
- Itoh, J.I., Hasegawa, A., Kitano, H., and Nagato, Y. (1998). A recessive heterochronic mutation, plastochron1, shortens the plastochron and elongates the vegetative phase in rice. Plant Cell 10 1511–1522. [DOI] [PMC free article] [PubMed] [Google Scholar]
- Jarvis, W.D., Kolesnick, R.N., Fornari, F.A., Traylor, R.S., Gewirtz, D.A., and Grant, S. (1994). Induction of apoptotic DNA damage and cell death by activation of the sphingomyelin pathway. Proc. Natl. Acad. Sci. USA 91 73–77. [DOI] [PMC free article] [PubMed] [Google Scholar]
- Kamoun, S., van West, P., Vleeshouwers, V.G., de Groot, K.E., and Govers, F. (1998). Resistance of Nicotiana benthamiana to Phytophthora infestans is mediated by the recognition of the elicitor protein INF1. Plant Cell 10 1413–1426. [DOI] [PMC free article] [PubMed] [Google Scholar]
- Kater, M.M., Koningstein, G.M., Nijkamp, H.J., and Stuitje, A.R. (1991). cDNA cloning and expression of Brassica napus enoyl-acyl carrier protein reductase in Escherichia coli. Plant Mol. Biol. 17 895–909. [DOI] [PubMed] [Google Scholar]
- Kater, M.M., Koningstein, G.M., Nijkamp, H.J., and Stuitje, A.R. (1994). The use of a hybrid genetic system to study the functional relationship between prokaryotic and plant multi-enzyme fatty acid synthetase complexes. Plant Mol. Biol. 25 771–790. [DOI] [PubMed] [Google Scholar]
- Keogh, R.C., Deberall, B.J., and McLeod, S. (1980). Comparison of histological and physiological responses to Phakospora pachyrhizi in resistant and susceptible soybean. Trans. Br. Mycol. Soc. 74 329–333. [Google Scholar]
- Konieczny, A., and Ausubel, F.M. (1993). A procedure for mapping Arabidopsis mutations using co-dominant ecotype-specific PCR-based markers. Plant J. 4 403–410. [DOI] [PubMed] [Google Scholar]
- Kuo, A., Cappelluti, S., Cervantes-Cervantes, M., Rodriguez, M., and Bush, D.S. (1996). Okadaic acid, a protein phosphatase inhibitor, blocks calcium changes, gene expression, and cell death induced by gibberellin in wheat aleurone cells. Plant Cell 8 259–269. [DOI] [PMC free article] [PubMed] [Google Scholar]
- Lander, E.S., Green, P., Abrahamson, J., Barlow, A., Daly, M.J., Lincoln, S.E., and Newberg, L. (1987). Mapmaker: An interactive computer package for constructing primary genetic linkage maps of experimental and natural populations. Genomics 1 174–181. [DOI] [PubMed] [Google Scholar]
- Li, J., and Last, R.L. (1996). The Arabidopsis thaliana trp5 mutant has a feedback-resistant anthranilate synthase and elevated soluble tryptophan. Plant Physiol. 110 51–59. [DOI] [PMC free article] [PubMed] [Google Scholar]
- Li, J., Ou-Lee, T.-M., Raba, R., Amundson, R.G., and Last, R.L. (1993). Arabidopsis flavonoid mutants are hypersensitive to UV-B irradiation. Plant Cell 5 171–179. [DOI] [PMC free article] [PubMed] [Google Scholar]
- Li, J., Zhao, J., Rose, A.B., Schmidt, R., and Last, R.L. (1995). Arabidopsis phosphoribosyl-anthranilate isomerase: Molecular genetic analysis of triplicate tryptophan pathway genes. Plant Cell 7 447–461. [DOI] [PMC free article] [PubMed] [Google Scholar]
- Lichtenthaler, H.K. (1987). Chlorophylls and carotenoids: Pigments of photosynthetic biomembranes. Methods Enzymol. 148 350–382. [Google Scholar]
- Liu, X., Ouyang, J., He, Y., and Li, J. (1999). Immunological analysis of Arabidopsis indole-3-glycerol phosphate synthase. Acta Bot. Sin. 41 751–756. [Google Scholar]
- Marchetti, M.A., Bollich, C.N., and Uecker, F.A. (1983). Spontaneous occurrence of the Sekiguchi lesion in two American rice lines: Its induction, inheritance, and utilization. Phytopathology 73 603–606. [Google Scholar]
- McDowell, J.M., Dhandaydham, M., Long, T.A., Aarts, M.G., Goff, S., Holub, E.B., and Dangl, J.L. (1998). Intragenic recombination and diversifying selection contribute to the evolution of downy mildew resistance at the RPP8 locus of Arabidopsis. Plant Cell 10 1861–1874. [DOI] [PMC free article] [PubMed] [Google Scholar]
- Mou, Z., Dai, Y., and Li, J. (2000). Fine-mapping of an Arabidopsis cell death mutation locus. Sci. China 43 138–145. [DOI] [PubMed] [Google Scholar]
- Ohlrogge, J., and Browse, J. (1995). Lipid biosynthesis. Plant Cell 7 957–970. [DOI] [PMC free article] [PubMed] [Google Scholar]
- Ohlrogge, J.B., and Jaworski, J.G. (1997). Regulation of fatty acid synthesis. Annu. Rev. Plant Physiol. Plant Mol. Biol. 48 109–136. [DOI] [PubMed] [Google Scholar]
- Okazaki, T., Kondo, T., Kitano, T., and Tashima, M. (1998). Diversity and complexity of ceramide signaling in apoptosis. Cell Signal 10 685–692. [DOI] [PubMed] [Google Scholar]
- Pennell, R.I., and Lamb, C. (1997). Programmed cell death in plants. Plant Cell 9 1157–1168. [DOI] [PMC free article] [PubMed] [Google Scholar]
- Peterhänsel, C., Freialdenhoven, A., Kurth, J., Kolsch, R., and Schulze-Lefert, P. (1997). Interaction analyses of genes required for resistance responses to powdery mildew in barley reveal distinct pathways leading to leaf cell death. Plant Cell 9 1397–1409. [DOI] [PMC free article] [PubMed] [Google Scholar]
- Pizer, E.S., Chrest, F.J., DiGiuseppe, J.A., and Han, W.F. (1998). Pharmacological inhibitors of mammalian fatty acid synthase suppress DNA replication and induce apoptosis in tumor cell lines. Cancer Res. 58 4611–4615. [PubMed] [Google Scholar]
- Roggenkamp, R., Numa, S., and Schweizer, E. (1980). Fatty acid–requiring mutant of Saccharomyces cerevisiae defective in acetyl-CoA carboxylase. Proc. Natl. Acad. Sci. USA 77 1814–1817. [DOI] [PMC free article] [PubMed] [Google Scholar]
- Slabas, A.R., and Fawcett, T. (1992). The biochemistry and molecular biology of plant lipid biosynthesis. Plant Mol. Biol. 19 169–191. [DOI] [PubMed] [Google Scholar]
- Slabas, A.R., Sidebottom, C.M., Hellyer, A., Kessell, R.M.J., and Tombs, M.P. (1986). Induction, purification and characterization of NADH-specific enoyl acyl carrier protein reductase from developing seeds of oil seed rape (Brassica napus). Biochim. Biophys. Acta 877 271–280. [Google Scholar]
- Somerville, C., and Browse, J. (1991). Plant lipids: Metabolism, mutants, and membranes. Science 252 80–87. [DOI] [PubMed] [Google Scholar]
- Stuitje, A., Kater, M.M., Verwoert, I.I.G.S., Fawcett, T., Slabas, A.R., and Nijkamp, H.J.J. (1993). Molecular genetic studies of plant enoyl-ACP reductase and bacterial malonyl CoA-ACP transacylase genes. In Biochemistry and Molecular Biology of Membrane and Storage Lipids of Plants, N. Murata and C. Somerville, eds (Rockville, MD: American Society of Plant Physiologists), pp. 121–132.
- Tamagnone, L., Merida, A., Stacey, N., Plaskitt, K., Parr, A., Chang, C.F., Lynn, D., Dow, J.M., Roberts, K., and Martin, C. (1998). Inhibition of phenolic acid metabolism results in precocious cell death and altered cell morphology in leaves of transgenic tobacco plants. Plant Cell 10 1801–1816. [DOI] [PMC free article] [PubMed] [Google Scholar]
- Topfer, R., Martini, N., and Schell, J. (1995). Modification of plant lipid synthesis. Science 268 681–686. [DOI] [PubMed] [Google Scholar]
- Turnowsky, F., Fuchs, K., Jeschek, C., and Hogenauer, G. (1989). envM genes of Salmonella typhimurium and Escherichia coli. J. Bacteriol. 171 6555–6565. [DOI] [PMC free article] [PubMed] [Google Scholar]
- Vaux, D.L., and Korsmeyer, S.J. (1999). Cell death in development. Cell 96 245–254. [DOI] [PubMed] [Google Scholar]
- Wang, M., Oppedijk, B.J., Lu, X., Van Duijn, B., and Schilperoort, R.A. (1996). Apoptosis in barley aleurone during germination and its inhibition by abscisic acid. Plant Mol. Biol. 32 1125–1134. [DOI] [PubMed] [Google Scholar]
- Wolter, M., Hollricher, K., Salamini, F., and Schulze-Lefert, P. (1993). The mlo resistance alleles to powdery mildew infection in barley trigger a developmentally controlled defence mimic phenotype. Mol. Gen. Genet. 239 122–128. [DOI] [PubMed] [Google Scholar]
- Wyllie, A.H., Kerr, J.F.R., and Currie, A.R. (1980). Cell death: The significance of apoptosis. Int. Rev. Cytol. 68 251–306. [DOI] [PubMed] [Google Scholar]
- Yeung, E.C., and Meinke, D.W. (1993). Embryogenesis in angiosperms: Development of the suspensor. Plant Cell 5 1371–1381. [DOI] [PMC free article] [PubMed] [Google Scholar]
- Zachgo, E.A., Wang, M.L., Dewdney, J., Bouchez, D., Camilleri, C., Belmonte, S., Huang, L., Dolan, M., and Goodman, H.M. (1996). A physical map of chromosome 2 of Arabidopsis thaliana. Genome Res. 6 19–25. [DOI] [PubMed] [Google Scholar]
- Zhong, W. (1985). Determination of the total lipids in plants. In Laboratory Manual of Plant Physiology, Y. Xue and Z. Xia, eds (Shanghai, China: Shanghai Science and Technology Press), pp. 198–201.