

Abstract
The peripheral anionic site on acetylcholinesterase (AChE), located at the active center gorge entry, encompasses overlapping binding sites for allosteric activators and inhibitors; yet, the molecular mechanisms coupling this site to the active center at the gorge base to modulate catalysis remain unclear. The peripheral site has also been proposed to be involved in heterologous protein associations occurring during synaptogenesis or upon neurodegeneration. A novel crystal form of mouse AChE, combined with spectrophotometric analyses of the crystals, enabled us to solve unique structures of AChE with a free peripheral site, and as three complexes with peripheral site inhibitors: the phenylphenanthridinium ligands, decidium and propidium, and the pyrogallol ligand, gallamine, at 2.20–2.35 Å resolution. Comparison with structures of AChE complexes with the peptide fasciculin or with organic bifunctional inhibitors unveils new structural determinants contributing to ligand interactions at the peripheral site, and permits a detailed topographic delineation of this site. Hence, these structures provide templates for designing compounds directed to the enzyme surface that modulate specific surface interactions controlling catalytic activity and non-catalytic heterologous protein associations.
Keywords: acetylcholinesterase structure/allosteric inhibitor/peripheral anionic site/phenanthridinium inhibitors/surface interaction
Introduction
The fundamental role of acetylcholinesterase (AChE) at cholinergic synapses is to terminate neurotransmission by rapid hydrolysis of the substrate, acetylcholine (see Massoulié et al., 1993; Taylor and Radić, 1994). The AChE active center, which consists of the catalytic triad Ser203–Glu334–His447 in mammals (Rachinsky et al., 1990), is located nearly centrosymmetric to the subunit and at the bottom of a deep and narrow gorge (Sussman et al., 1991). Several early studies provided evidence that some inhibitors of AChE bind at the catalytic site (competitive inhibitors) while others can influence steady- state parameters by associating with an allosteric site remote from the active center (Changeux, 1966; Roufogalis and Quist, 1972; Robaire and Kato, 1974). A direct means for measuring binding to this site was found with the inhibitor propidium, which exhibits an enhanced fluorescence when bound to the enzyme and forms ternary complexes with AChE and competitive inhibitors (Taylor and Lappi, 1975). In subsequent years, the specificity of this site for organic and inorganic cations with a range of affinities and its distance from the active center have been characterized through fluorescence resonance energy transfer and ligand competition studies (Epstein et al., 1979; Berman et al., 1980, 1987; Radić et al., 1991). This site is now referred to as the peripheral anionic site (PAS) and is known to be located at the rim of the active-center gorge.
PAS inhibitors have been shown to inhibit catalysis through a combination of steric blockade of ligands entering and leaving the gorge and by allosteric alteration of the catalytic triad conformation and efficiency (Changeux et al., 1966; Taylor and Lappi, 1975; Epstein et al., 1979; Berman et al., 1981; Szegletes et al., 1998). Following resolution of the first crystal structure of Torpedo AChE (TcAChE; Sussman et al., 1991), several attempts have been made to understand the precise structure and functional role of the PAS. However, currently available crystallographic analyses of AChE reveal structures in which the entrance of the active-site gorge is occluded by a crystalline symmetry-related molecule (Sussman et al., 1991; and other TcAChE structures based on the same crystal form; Bourne et al., 1999) or partly occupied by the distal nitrogen of a bisquaternary inhibitor (Harel et al., 1993; Bartolucci et al., 1999; Bourne et al., 1999; Kryger et al., 1999; Felder et al., 2002), thereby precluding a detailed structural analysis of a PAS region in its free state or associated with small inhibitors selective for this site. Only structures of AChE associated with the peptide fasciculin have provided templates for a specifically liganded PAS; however, the large surface area covered by the bound fasciculin at the gorge entrance encompasses overlapping binding loci for the diverse small PAS ligands, and the unique size of fasciculin highlights the steric blockade contribution to inhibition at the expense of revealing discrete mechanisms for allosteric modulation of the active site conformation (Bourne et al., 1995; Harel et al., 1995; Kryger et al., 2000).
Recent evidence for non-catalytic functions of AChE have suggested that the PAS, besides its role in allosteric regulation of AChE-catalyzed hydrolysis of released acetylcholine, also mediates heterologous protein associations that contribute to cell recognition and adhesion processes during synaptogenesis, and to the nucleation of amyloid peptides during the onset of Alzheimer’s disease in humans and mammalian model systems; indeed, only those AChE inhibitors that bind the PAS, such as propidium or fasciculin, are able to affect these functions, as shown by competition studies (Inestrosa et al., 1996; Johnson and Moore, 1999; Soreq and Seidman, 2001). Therefore, comparative structures of AChE with an unliganded PAS region and associated with a small PAS-specific ligand are essential to define not only the surface determinants and molecular mechanisms coupling the PAS to the buried active center to modulate catalysis allosterically, but also the surface interactions involved in non-catalytic AChE functions of heterologous recognition.
Herein, we report the spectroscopic characterization and crystal structures of mouse AChE (mAChE) in its apo-form and as complexes with three PAS ligands known to be allosteric inhibitors of the enzyme: decidium (DI) and propidium (PI), two bisquaternary analogs of the fluorescent phenanthridinium ligand, ethidium (Taylor and Lappi, 1975; Berman and Decker, 1986; Berman et al., 1987), and gallamine (GAL), a neuromuscular blocking agent with three quaternary moieties (Changeux, 1966) (Figure 1). These four structures, refined in the 2.35–2.2 Å resolution range, unveil the precise architecture of the PAS of a eukaryotic AChE and delineate the molecular determinants involved in regulation of AChE catalysis by PAS ligands. Hence, these structures may help identify those candidate residues that form heterologous contacts with other molecules and elucidate the nature of the interactions that participate in nucleation of Alzheimer’s fibrils and other non-catalytic AChE functions.

Fig. 1. PAS ligands (AChE inhibitors) used in this study. Schematic drawings (from top to bottom) of the phenylphenanthridinium ligands propidium (PI; 3,8-diamino-5[3′-(diethylmethylammonio) propyl]-6-phenyl phenanthridinium) and decidium (DI; 3,8-diamino-5[10′- (trimethyl-ammonio) decyl]-6-phenyl phenanthridinium), and of the pyrogallol ligand gallamine (GAL; 2,2′,2′′-[1,2,3-benzene-triyltris(oxy)]tris[N,N,N-triethylethanamonium]). PI and DI were diiodide salts and GAL was a triiodide.
Results and discussion
Purification and crystallization procedures necessary to retain bound PAS ligands
Currently available structures of AChE show enzyme molecules in which the entrance of the active-site gorge is: (i) occluded from outside by a symmetry-related molecule (Sussman et al., 1991; and subsequent TcAChE structures derived from crystal soaking; Bourne et al., 1999); (ii) sealed by the large peptidic inhibitor fasciculin 2 (Fas2) (Bourne et al., 1995; Harel et al., 1995; Kryger et al., 2000); and (iii) partially occupied from within the gorge by a bifunctional inhibitor molecule spanning the full length of the gorge, from the buried catalytic site to the surface PAS (Harel et al., 1993; Bourne et al., 1999; Felder et al., 2002). These features, that led us to propose this surface to be particularly interactive (Bourne et al., 1999), also precluded structural analyses of the PAS in a free state or associated with selective, small organic inhibitors. Our several attempts to observe either an unliganded or a specifically liganded PAS using a previous mAChE crystal form, that shows a tetrameric assembly of subunits (Bourne et al., 1999), were hampered by a combination of: (i) crystal packing interactions leading to occupied (from outside) PAS regions in two of the tetramer subunits; (ii) partial occupancy (from inside the gorge) of the PAS region by a decamethonium (DECA) molecule retained from the purification procedure (see Materials and methods) and present in the gorges of the other two subunits; and (iii) low fractional ligand occupation arising from the high salt concentrations required for crystal growth and the dependency on low ionic strength for ligand binding at the PAS (Changeux, 1966; Robaire and Kato, 1974; Taylor and Lappi, 1975). Promising red co-crystals of mAChE and DI or PI were obtained, but the chromophoric ligand was only trapped within solvent channels of the crystal or distributed among non-specific, surface-binding sites.
Spectrophotometric analysis of the crystals
The polycyclic structure of DI and PI (Figure 1) confers absorbance and fluorescence spectra on these PAS ligands that lie outside the protein envelope and differ in the free and bound states (Taylor and Lappi, 1975; Berman et al., 1987). This feature enabled us not only to analyze the DI– and PI–mAChE complexes in solution to optimize PAS occupancy during complexation, but also to select, prior to data collection, those crystalline complexes that displayed the highest occupancies (Figure 2).

Fig. 2. Spectrophotometric analysis of the mAChE PAS occupancy by the DI phenanthridinium moiety. (A) Difference spectra between (as the sample) the concentrated DI–mAChE complex solution that yielded the structure reported herein and (as successive references, from top to bottom) increasing DI concentrations in the crystallization buffer; only the spectrum of highest amplitude (dashed line) is recorded against buffer that of lowest amplitude (plain line) corresponds to the highest DI concentration used in the reference. Subtracting the unbound contribution to the spectra unveils the bound component, which is the dominant spectral contributor for the DI–mAChE complex (but not for the PI–mAChE complex where the bound and free components are comparable). (B) Spectrophotometry on crystals of the DI–mAChE complex. Two crystals that respectively yielded the structure reported (solid line) and a structure with low PAS occupancy (dashed line) were analyzed comparatively with a solution of concentrated DI in 70% (w/v) PEG (twice the concentration used for crystallization) in buffer (dotted-dashed line); the differences in the absorbance maxima match the PAS occupancy revealed by the structures.
Increases in absorbance of the DI– and PI–mAChE complex solutions paralleled the progressive increases in the ligand molar ratio used to optimize complexation; yet, only limited shifts in the absorbance maxima towards longer wavelengths were observed (data not shown). In contrast, the DI difference spectra revealed a distinct shift from an unbound to a bound wavelength maximum, indicating that the majority of the DI present in the complex solution was bound to mAChE (Figure 2A). The PI difference spectra showed both unbound and bound peaks with distinct wavelengths, suggesting that a significant proportion of the PI present in the complex solution remained unbound (data not shown); attempts to increase the PI concentration further did not significantly improve the spectra but prevented crystallization or led to ill-diffracting crystals. The absorbance maxima observed in the crystals paralleled those in the complex solutions (Figure 2B). Hence, the maximum ligand concentration that could be used for complex formation and efficient crystallization was ∼320 µM for DI (15 600 × Ki; DI:mAChE molar ratio of 3) and ∼500 µM for PI (250 × Ki; PI:mAChE ratio of 5). This difference in fractional complexation for DI and PI is consistent with the near three orders of magnitude difference in their affinities for TcAChE. This resulted in full occupancy by DI but incomplete occupancy by PI for the PAS in the crystal, as also shown in the electron densities for the respective complexes (see below).
The presence of polyethyleneglycol (PEG) was also found to shift the absorbance maxima of DI or PI toward longer wavelengths (Figure 2B). This bathochromic shift of the bound phenanthridinium ring reveals its affinity for surfaces of lower apparent dielectric constant, and may explain the difficulties inherent in generating crystals of a PAS ligand–mAChE complex even in low ionic strength conditions. Indeed, the affinity of the PAS ligand for the PEG used to promote crystallization lowers the effective ligand concentration available for complexation to mAChE, while association of PEG with the indole ring of Trp286, as seen in the apo-mAChE structure (see below), competes with ligand association at the PAS. These two phenomena, which are more critical for PI than DI because of its lower affinity for mAChE, contribute to reducing actual PAS occupancies in the crystal.
Quality of the structures
The crystal structures of apo-mAChE and mAChE–PAS inhibitor complexes were refined in the 2.35–2.2 Å resolution range with good stereochemistry (Table I). All four structures contain two mAChE molecules assembled as the same canonical dimer as seen in previous structures of mAChE (Bourne et al., 1995, 1999), TcAChE (Sussman et al., 1991; Harel et al., 1995) and human AChE (HuAChE; Kryger et al., 2000) (Figure 3A). Two to four partial PEG molecules, two carbonate (in the apo-mAChE and DI– and GAL–mAChE complexes, and arising from the purification buffer) or acetate molecules (in the PI–mAChE complex, and arising from the crystallization liquor), and three to four GlcNAc and Fuc moieties were clearly identified in all four structures. Compared with the 2.9 Å resolution mAChE structure (Bourne et al., 1999), these structures provide significantly improved accuracy in positioning the main and side chains and solvent molecules. Most importantly, they provide the first opportunity to compare unliganded and specifically bound PAS regions using a single crystal form devoid of packing distortion at this site. Despite the high PAS ligand to mAChE molar ratios used for co-crystallization, secondary ligand-binding sites for these compounds were not detected; should discrete sites exist at the enzyme surface, they are either non-saturable or below the detection level in the electron density maps.
Table I. Data collection and refinement statistics.
| Apo-mAChE |
mAChE–PAS inhibitor complexes |
|||
|---|---|---|---|---|
| DI | PI | GAL | ||
| Data collectiona | ||||
| Beamline (ESRF) | ID14-EH4 | ID14-EH2 | ID14-EH2 | ID14-EH4 |
| Wavelength (Å) | 0.946 | 0.933 | 0.933 | 0.946 |
| Resolution range (Å) | 20–2.35 | 20–2.35 | 30–2.25 | 20–2.2 |
| Total observations | 903 557 | 359 483 | 549 001 | 650 504 |
| Unique reflections | 83 956 | 79 355 | 95 908 | 100 596 |
| Multiplicity | 5.3 | 3.0 | 3.4 | 3.9 |
| Completeness (%) | 99.2 (99.6) | 93.5 (58.2) | 99.5 (98.9) | 99.3 (99) |
| I/σ (I) | 9.5 (2.0) | 9.6 (2.8) | 13.5 (1.9) | 12.2 (2.1) |
| Rsymb | 5.8 (37) | 4.5 (24.7) | 4.1 (38.6) | 4.2 (34) |
| Refinement | ||||
| R-factorc/Rfree (%) | 20.9/23.2 | 19.8/22.6 | 20.5/22.6 | 19.7/21.2 |
| R.m.s.d.d | ||||
| Bonds (Å)/angles (°) | 0.013/1.7 | 0.011/1.8 | 0.011/1.8 | 0.013/1.7 |
| Dihedrals (°)/improper (°) | 24.2/1.2 | 23.7/1.1 | 24.1/1.1 | 24.1/1.1 |
| Average B-factor (Å) | ||||
| Main/side chainse | 45 (50)/47 (52) | 48 (52)/49 (54) | 46 (50)/48 (52) | 43 (45)/46 (48) |
| Solvent/carbohydrate | 48/87 | 51/94 | 49/91 | 49/89 |
| PEG/acetate or carbonate/ions/ligand | 76/56/–/– | 67/67/–/88 | 70/60/–/86 | 66/70/59/78 |
aValues in parentheses are those for the last shell.
bRsym = |I – <I>|/ΣI, where I is an individual reflection measurement and <I> is the mean intensity for symmetry-related reflections.
cR-factor = Σ||Fo| – |Fc||/Σ|Fo| where Fo and Fc are observed and calculated structure factors, respectively. Rfree is calculated for 2% of randomly selected reflections excluded from refinement.
dRoot-mean-square deviation from ideal values.
eNumbers are those for chain A; those in parentheses are for chain B.

Fig. 3. Structures of the DI–mAChE and PI–mAChE complexes. (A) Ribbon diagram of the mAChE dimer (cyan, with the four-helix bundle in magenta) bound to DI (orange bonds, blue nitrogen and red oxygen atoms). The carbohydrate moieties linked to residues Asn350 and Asn464 in both subunits are displayed as gray bonds and colored spheres. The side chains of the catalytic triad residues, Ser203, Glu334 and His447, are shown as white bonds in the two dimer subunits. The PEG molecule bound at the center of the four-helix bundle and the carbonate molecule bound to Ser203 are shown as green and yellow bonds, respectively. (B) Close-up stereo view of the DI molecule (colored as in A) bound to the PAS, with the 2.35 Å resolution omit Fo – Fc electron density map contoured at 3.5σ (cyan) and 7.5σ (blue); the coordinates of this region were omitted and the protein coordinates were refined by simulated annealing before the phase calculation. The interacting side chains of mAChE residues His287 and Leu289, located in the loop region connecting helices α36,7 and α46,7, and of residues Trp286 and Tyr341 at the gorge entrance, are displayed as green bonds; those of mAChE residues Tyr72 and Glu292, whose respective mutations as methionine and lysine in BgAChE abolish PI binding (see Figure 6), are highlighted in orange. The chloride ions and solvent molecules are shown as pink and red spheres, respectively. The catalytic triad residues, Ser203, Glu334 and His447, and the carbonate molecule (bottom) are shown as white and orange bonds, respectively. Hydrogen bonds between mAChE and the DI molecule are shown as white dotted lines. (C) Close-up stereo view of the PI molecule (colored as for DI) bound to the PAS, with the 2.35 Å resolution omit Fo – Fc electron density map contoured at 3.5σ (cyan). The PI phenyl and diethylmethylammonio moieties, which show alternative positions in the structure, are displayed as red and orange bonds. The mAChE side chains interacting with the PI molecule are displayed as green and orange bonds as in (B). The mAChE molecular surfaces buried at the DI–mAChE (B) and PI–mAChE (C) complex interfaces are displayed in transparency. mAChE numbering and secondary-structure elements are specified according to Rachinsky et al. (1990) and Cygler et al. (1993), respectively.
Analysis of the apo-mAChE structure
The apo-mAChE molecule, with its 12-stranded central-mixed β-sheet surrounded by 14 α-helices, has the same overall conformation as found in the lower resolution structures of mAChE (Bourne et al., 1995, 1999). The largest deviation between the apo-mAChE structure and the crystalline mAChE tetramer (a dimer of dimers; Bourne et al., 1999) occurs within a surface loop at Ala496; however, several significant differences in interesting areas are observed. First, instead of a tetramer of mAChE subunits, we observe a dimer (see Figure 3A). Compared with both dimers of the mAChE tetramer, one subunit in the apo-mAChE dimer is tilted by 8° in a direction perpendicular to the plane of the four-helix bundle made up of helices α37,8 and α10 at the dimer interface. This flexibility in the interface is likely to be related to the distinct crystal packing environments. It may also be related to the presence of two well-ordered PEG molecules in this region: one PEG molecule is tightly bound at the center of the four-helix bundle where it establishes extensive contacts with His381, Phe531 and Phe535 from each subunit, while the second PEG molecule is located closer to the molecular surface where it interacts with Gln527 from one subunit and Tyr382 and Asp384 from the second subunit. This suggests that the four-helix bundle can accommodate small, linear molecules with pronounced hydrophobic character (Figure 3A). Secondly, the two PAS ligands in this dimer are devoid of crystal packing constraints and are freely accessible to the solvent. Moreover, by using the PAS ligand PI in place of an active-center ligand for elution from the affinity resin during purification, the active-site gorge is devoid of any electron density arising from a trapped residual inhibitor at the active center. Hence, this structure and the parental crystal form meet the criteria for studying bound PAS inhibitors: (i) low ionic strength conditions for crystallization; (ii) free PAS regions; and (iii) active site gorges empty of residual inhibitor. Only a PEG molecule, arising from the crystallization liquor, is partially visible near the gorge entrance where it interacts with the Trp286 side chain, a feature also found in the active-site gorge of the TcAChE– galanthamine complex structure (Greenblatt et al., 1999); this PEG molecule is replaced by the bound ligand in the complexes (see below). Thirdly, as a consequence of the unoccupied PAS, the tips of the long Ω loop Cys69–Cys96 and of the short Val340–Gly342 loop adopt positions slightly different from those in other AChE structures, with shifts of ∼1.4 Å in the positions of residues Leu76 and Tyr341, located on each side of the gorge entrance, affecting the size of the gorge opening. Fourthly, a planar carbonate molecule is clearly seen as tightly bound to the catalytic Ser203, with the carbon atom located 2.4 Å away from the serine hydroxyl group. One carbonyl oxygen is hydrogen bonded to the backbone nitrogen of Gly121 and points towards the oxyanion hole; a second carbonyl oxygen is hydrogen bonded to the backbone nitrogen atom of Ala204; and the third carbonyl oxygen points towards the Phe297 and Phe338 side chains. An identical carbonate is also seen in the DI– and GAL–mAChE complexes (see below), while an acetate is seen in the PI–mAChE complex where it adopts the same position and orientation as the carbonate. These molecules, which mimic the normal reaction product acetate, provide structural insights into the reactivity of the catalytic serine residue and the positioning of the substrate acetylcholine during the acylation step.
Structure of the decidium–mAChE complex
The structure of mAChE in complex with the phenylphenanthridinium ligand DI (Figure 1) shows well-ordered DI molecules in the electron density maps (Figure 3B). The two DI molecules are bound at the same position and with the same orientation at the two gorge entrances of the mAChE dimer, a uniformity supporting consistency of our structural data with the DI binding mode in solution. The major interaction of the DI molecule with the mAChE PAS region resides in the near-parallel stacking of the slightly bent phenanthridinium ring of DI with the Trp286 indole through a π–π interaction where 3.7 Å separates the two unsaturated ring carbons. One solvent molecule and one chloride ion are located 3.7 Å above the centroids of the phenanthridinium two distal rings, on the side opposite to Trp286. Their positioning could explain, in part, why high ionic-strength conditions impede binding of PAS ligands; in the absence of bound DI, chloride ions would be positioned similarly above the indole ring of Trp286. Moreover, a clear delocalization of electrons between Trp286 and the phenanthridium is observed in the electron density maps; this suggests that the spacing is appropriate for a charge-transfer complex between the phenanthridium as the electron-deficient ring and the Trp286 indole as the electron-rich ring. A direct hydrogen bond is observed uniquely between the aromatic amine group in DI distal to the gorge entrance and the His287 side chain. A second chloride ion, hydrogen bonded to the 3′ aromatic group located at the gorge entrance, promotes water-mediated hydrogen bonds with the surrounding Tyr124 side chain and Phe295 backbone nitrogen atoms. The extended trimethylammoniodecyl moiety, clearly defined in the maps, lines the mAChE molecular surface where it perfectly fits the shape of the loop region Pro290– Phe299 that connects helix α36,7 to helix α46,7 (Figure 6). The alkyl chain establishes numerous van der Waals contacts with the Leu289 and Glu292 side chains, indicating a significant contribution of this loop region to DI binding. The DI phenyl ring, sandwiched between the DI alkyl chain and the His287 side chain, is tilted by ∼80° from the mean plane of the phenanthridinium ring, as previously found in energy-minimized models of phenylphenanthridium ligands in solution (Barak et al., 1994; Z.Radić, unpublished). So few direct contacts are unexpected for an AChE inhibitor with affinity in the nanomolar range; yet a similar feature is observed in structures of TcAChE bound with huperzine A (Raves et al., 1997) and galanthamine (Greenblatt et al., 1999), where the two inhibitors make few direct hydrogen bonds with residues at the bottom of the enzyme gorge while solvent molecules are maintained to mediate additional hydrophilic contacts.

Fig. 6. mAChE residues in the PAS, as defined from the mAChE–PAS ligand complex structures. Alignment of the mAChE sequence segments and residues that define the PAS topography with the corresponding sequences in HuAChE, EeAChE, TcAChE, BgAChE and human butyrylcholinesterase (HuBChE). The mAChE numbering and secondary structure motifs are displayed below the alignment. Triangles above the mAChE sequence indicate the residues that bury 10% or more of their side chain surface area at the interfaces of the DI–mAChE (black triangles, tip down) and PI–mAChE complexes (black and open triangles, tip up: first and second conformation, respectively). Open circles below the alignment indicate the residues that bury 10% or more of their side chain surface area at the interface of the GAL–mAChE complex; black bars indicate the two mAChE surface loops that are disordered in the GAL–mAChE complex; orange and green circles indicate the residues involved in the two iodide- binding sites, located at the gorge entrance and within the gorge, respectively, in this complex. Black circles below the alignment indicate the mAChE residues whose side chains are buried at the Fas2–mAChE complex interface. BgAChE residues Met70 and Lys285, whose substitution by TcAChE residues tyrosine and aspartic acid restores sensitivity to PI, are highlighted in blue.
Previous studies showing competition between the small active-center ligand edrophonium and DI, but not PI, have suggested that DI association occurs with the phenanthridinium moiety directed toward the PAS and the trimethylammonio moiety bound at the active center (Berman and Decker, 1986; Berman et al., 1987); thus the 10 carbon alkyl chain in DI would mimic the position of the DECA molecule in the TcAChE gorge (Harel et al., 1993). However, in view of the tight stacking of the phenanthridinium ring at the mAChE surface (Figure 3B), the long alkyltrimethylammonium moiety entering into the active-site gorge would impose a severe structural constraint and unfavorable bond angles of the chain. Kinetic data on DI inhibition are available for TcAChE only, a limitation that leaves open questions of species difference in binding orientation. Yet, the DI–mAChE structure shows interacting mAChE residues that are invariant or conserved not only between mAChE and TcAChE but also amongst the mammalian AChEs (Figure 6).
Structure of the propidium–mAChE complex
The structure of mAChE associated with PI, a phenylphenanthridinium congener with a shorter alkyl chain and a bulkier quaternary ammonium group (Figure 1), shows a bound PI whose position and bent conformation are similar to those of the bound DI molecule (Figure 3C). Despite the slight stoichiometric deficiency determined by crystal spectrophotometry, unbiased electron density maps were obtained for the PI phenanthridinium moieties, which superimpose with the phenanthridinium moieties in the DI–mAChE complex. The simulated annealing omit maps clearly reveal the presence of two alternative conformations for the PI phenyl ring and alkyldiethylmethylammonium moiety, indicating that the phenylphenanthridinium can accommodate the PAS region with two distinct conformations related by a 180° flip around the phenanthridinium symmetry axis. In one conformer, the PI alkyl chain is lined along the mAChE surface and the diethylmethylammonio group interacts with the imidazole of His287, whereas the PI phenyl ring is oriented to establish van der Waals contacts with the side chains of Gly342 and Glu292, which shape a surface hydrophobic pocket. In the other conformer, the diethylmethylammonio group is sandwiched between the PI phenyl ring and the backbone atoms of surface loop His287–Ser293, a conformation similar to that adopted by the initial segments of the DI alkyl chain in the DI complex. The diethylmethylammonio alkyl moiety, by adopting a range of intermediate positions dictated between the two orientations of the phenanthridium ring, could account for disorder in the crystals.
Based on the DI– and PI–mAChE structures (Figure 3), differences in the length of the alkyl chains and/or the position of the quaternary ammonium groups should account for the 100-fold difference in the TcAChE affinities for DI (Ki ∼2.1 × 10⁻⁸ M) and PI (Ki ∼3.7 × 10⁻⁶ M) (Berman et al., 1987). Indeed, the high structural homology of mAChE and TcAChE in the DI- and PI-binding regions, along with comparable affinities of PI for mAChE and TcAChE (Ki ∼2.2 × 10⁻⁶ M for mAChE; Radić et al., 1993), would be consistent with the phenanthridinium rings adopting similar positions in the vicinity of the Trp286 (Trp279 in TcAChE) indole.
Structure of the gallamine–mAChE complex
The structure of mAChE in complex with the trisquaternary pyrogallol ligand GAL (Figure 1) establishes a clear position for the pyrogallol ring (Figure 4A). Compared with the DI and PI phenanthridinium moieties, the smaller GAL aromatic ring occupies a central position deeper into the gorge entry. It is stacked equidistant between the indole ring of Trp286 on one side of the entrance and the phenol ring of Tyr341 on the other side, two residues providing van der Waals contacts. Additional contacts are established with the Tyr72 and Tyr124 side chains. Of the three GAL alkyl chains, two, a flanking and the central chain, are disordered, whereas the second flanking chain is partly visible and points towards His287 in the PAS. Our structural data are in accord with recent fluorescence in solution studies using an acrylodan-modified enzyme, showing that the Tyr124 side chain is excluded from solvent upon GAL binding (Shi et al., 2002). At the gorge entrance, the ether oxygens unique to GAL contribute to forming a binding site for an iodide ion; this iodide is bound to one ether oxygen atom of GAL and to the backbone nitrogen atom of Phe295, where it replaces a solvent molecule conserved in other mAChE and TcAChE structures (Koellner et al., 2000). There are no other direct hydrogen bonds between the GAL and mAChE molecules, a feature similar to that found in the PI– and DI–mAChE structures. High level positive peaks of electron density at the bottom of the gorge were previously observed in the apo-TcAChE structure (Raves et al., 1997), although the nature of these ions remains to be elucidated. Electrostatic calculations suggested that a small cation might be present in the AChE active site for correct enzyme functioning (Wlodek et al., 1995). Our data, taken together with the above two studies, point to a structural and/or functional role for small ions in the AChE active-site gorge.

Fig. 4. Structure of the GAL–mAChE complex. (A) Close-up stereo view of the GAL molecule (colored as for DI and PI; see Figure 3) bound to the PAS, with the 2.2 Å resolution omit Fo – Fc electron density map contoured at 3.5σ (cyan) and 15σ (pink). The mAChE backbone regions Asp74–Pro78 and Val340–Gly342 that are disordered at the gorge entrance are highlighted in red; the side chains of PAS residues Leu76 and Tyr341, also disordered in the density maps, are shown as red bonds. The iodide ion is shown as a yellow sphere. (B) Stereo view of the PAS region in the GAL–mAChE complex, showing the two iodide ions (yellow spheres) bound in the region of the gorge entrance. The backbone regions and the side chains of Tyr72, Tyr337 and Tyr341, which move significantly in the GAL–mAChE complex compared with their positions in any of the other three structures, are shown in red. The side chains of the same tyrosine residues as seen in each of the three other structures (apo-mAChE and DI– and PI–mAChE complexes) are superimposed and displayed as white bonds with red hydroxyls. The mAChE molecular surface buried at the GAL–mAChE complex interface is shown in transparency.
The five loci where iodides are bound in each subunit of the GAL–mAChE complex correspond to cavities or depressions shaped by mixed hydrophobic and hydrophilic environments, as found in most structures of proteins complexed to halide ions (Dauter and Dauter, 2001). In addition to the iodide ion that is directly liganded to the GAL molecule (see above), a second iodide is located at the gorge entrance where it is hydrogen bonded with the Gln291, Ser293 and Gln369 side chains (Figures 4 and 6). A solvent molecule and the side chains of three residues, Leu289, Pro290 and Arg296, complete the binding site by creating a hydrophobic environment. The three mAChE residues that are bound to the second iodide-binding site are invariant in mammalian AChEs. Since these iodides could be replaced by bromide or chloride ions, depending on the purification conditions or the nature of the PAS ligand salt used, halide ions or other anions may help stabilize the conformation of loop Ser293–Phe297 at the gorge entrance.
The binding of GAL to mAChE dramatically affects the backbone stability at the tips of two loops, loops Val340–Gly342 and Asp74–Pro78, located at the gorge entrance. Indeed, compared with the other three structures, the GAL–mAChE structure displays a large increase, up to 15 Å2, in the mean B-factor values for residues in these loops. Moreover, the electron density maps are particularly weak for the Leu76 and Tyr341 side chains and reveal discrete disorder in the backbone region (Figure 4A). These features are unique to the GAL– mAChE complex and are not shared by the DI– and PI–mAChE complexes (Figure 3) and the apo-mAChE-I structure (see Materials and methods); hence, disorder of the loop tips might be correlated with large movements of the disordered GAL alkyl chains, which seem to be oriented so as to emerge from the gorge entrance. Most importantly, these features also suggest that in solution, both the backbone and the side chains in these two mAChE surface loops have the capacity to adopt multiple conformations and confer a flexibility likely to enlarge the gorge entrance slightly and facilitate ligand access to the active site.
Comparison of the four structures
The positions seen in our structures for the DI and PI phenanthridinium rings, alkyl chains and quaternary ammonium groups (Figure 3), and for the GAL pyrogallol ring (Figure 4) are consistent with mutagenesis data on mAChE and HuAChE (Shafferman et al., 1992; Radić et al., 1993; Barak et al., 1994; Ordentlich et al., 1995; Mallender et al., 2000) and on Bungarus ACLE (BgAChE), of which the low sensitivity to PI and GAL is restored upon tyrosine and aspartic acid respective substitutions to residues Met70 and Lys285 (Tyr70 and Asp285 in TcAChE; Tyr72 and Glu292 in mAChE) (Cousin et al., 1996), and with insensitivity to PI and GAL of chicken AChE, with its glycine residue in place of Trp286 (Eichler et al., 1994) (Figure 6).
Comparative analysis of the four structures, one apo-mAChE and three PAS ligand–mAChE complexes, reveals distinctive features of the crystalline enzyme PAS and active-site gorge which may reflect conformational states of mAChE associated with PAS ligands in solution. Although the overall structures are virtually identical (see r.m.s.d. values, Materials and methods), superimposition reveals significant mobility for the side chains of residues Tyr72, Leu76, Tyr337 and Tyr341, i.e. four key residues that delineate the shape of the gorge entry and lining. In particular, the phenol ring of Tyr337, located midway in the gorge, swings in and out with large deviations of its hydroxyl group of up to 2 Å (Figure 4B). This motion by itself is sufficient to enlarge the gorge to enhance ligand access to the active-center serine, and consistent with the reported mobility of the homologous residue Phe330 in TcAChE (Kryger et al., 1999). Additional deviations up to 0.75 Å occur for the Cα atoms of Leu76 and Gly79 and lead to a narrower gorge entrance in the presence of the bound GAL. Therefore, concerted movements of the tips of the large Ω loop Cys69–Cys96 and of loop Val340–Gly342, which bears Tyr341, may significantly enlarge the gorge mouth to facilitate ligand access to the catalytic site, through rapid conformational conversions between open and closed states. Alterations in flexibility of the large Ω loop are consistent with fluorescence measurements of side chain exposure to solvent (Shi et al., 2001).
It has been suggested that binding of a PAS ligand induces a conformational transition within either the anionic site or the acylation site of the active center (Radić et al., 1991, 1995; Barak et al., 1995; Eastman et al., 1995; Grubič et al., 1995). Prior investigations had shown that PAS ligands alter the fluorescence properties of fluorescent phosphonates conjugated to the active-center serine (Epstein et al., 1979). In turn, active-center ligands affect the quantum yields of bound thioflavin, a newly discovered alternative to propidium (De Ferrari et al., 2001). Our data suggest that ligands can be accommodated in the mAChE PAS region without a drastic change in the conformation of the active center at the base of the gorge; however, conformational changes affecting catalysis or fluorescence properties in solution may be subtle and not readily revealed in the crystal structures.
Comparison with other AChE structures
Several prominent features emerge upon comparison of the DI–mAChE and Fas2–mAChE complexes (Figure 5A). In the Fas2–mAChE complex, the Fas2 Pro-Pro-Lys-Met sequence motif, at the tip of Fas2 loop II, is central to the interface and establishes many van der Waals and polar interactions with several mAChE PAS residues (Bourne et al., 1995). The Pro30–cysPro31 doublet dictates the shape of loop II (Le Du et al., 1992) and its functionality, since deletion or mutation in this doublet (Fas2 mutants ΔPro30 and Pro31Arg) dramatically affects affinity for mAChE (Marchot et al., 1997). Superimposition of the structures reveals striking similarities between the bound DI molecule and Fas2 loop II, which overlap at the gorge entrance. One of the DI phenanthridinium rings and its phenyl ring are positioned similarly to the side chains of Fas2 residues Met33 and Arg27, respectively. Also, the first three methylenes of the DI alkyl chain overlap with Fas2 residue Pro31; as a consequence, the third, fourth and fifth methylenes of the DI alkyl chain establish the same van der Waals contacts with the side chain of mAChE Glu292 as does Fas2 Pro30. Finally, the phenanthridinium ring of DI that is distal to the gorge entrance coincides in position with the side chain of Fas2 Leu35, suggesting similar hydrophobic interactions. A similar comparison of the PI–mAChE and Fas2–mAChE complexes shows that the diethylmethylammonio group of PI, when positioned as in the first bound PI conformation, mimics Fas2 residue Pro30. Hence, the interacting residues of the large peptidic Fas2 molecule encompass all of the structural determinants of the PAS, as delineated from the individual interfaces selective for the diverse PAS ligands; this observation is consistent with data in solution showing competition between fasciculin and either PAS or bifunctional ligands (Karlsson et al., 1984; Marchot et al., 1993; Eastman et al., 1995; Radić and Taylor, 2001).
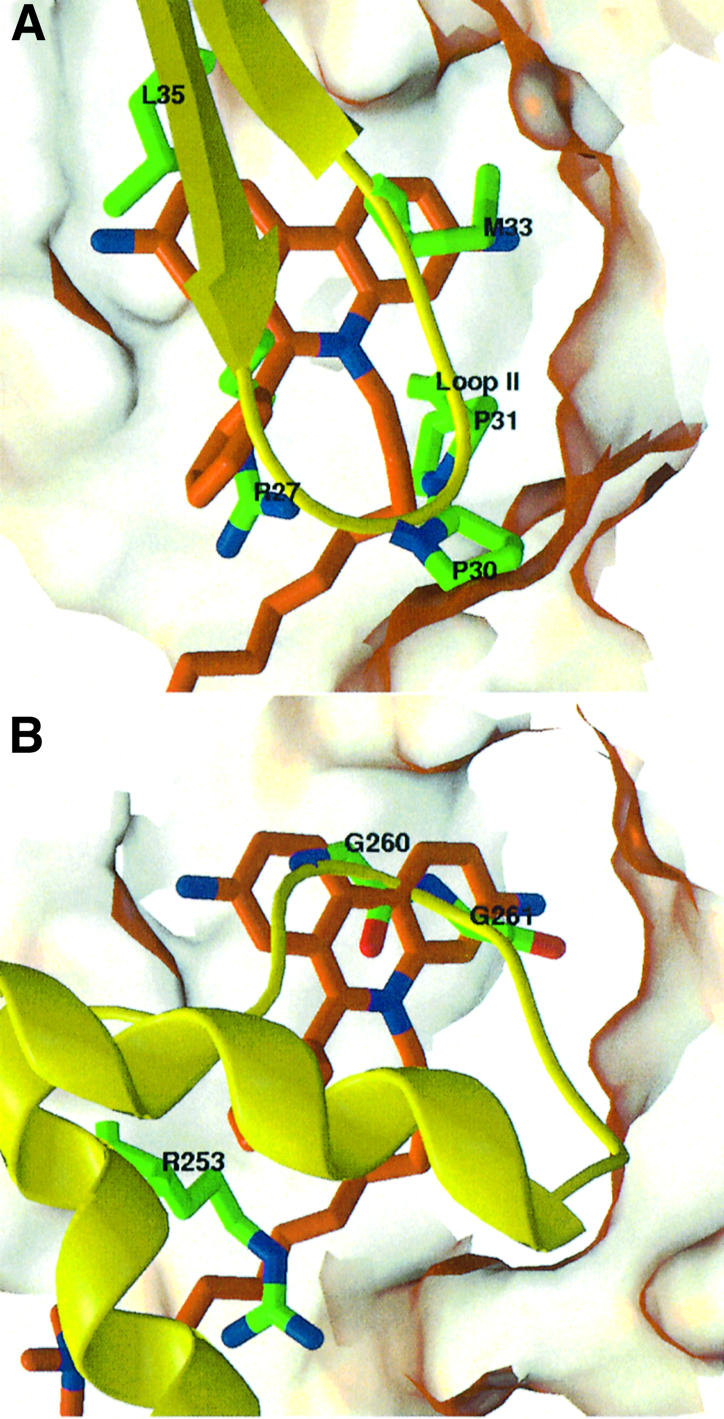
Fig. 5. Structural comparisons of the DI–mAChE complex with the Fas2–mAChE complex and the crystalline mAChE tetramer. (A) Close-up view of a superimposition of the DI molecule (orange bonds, blue nitrogen and red oxygen atoms) in the DI–mAChE complex with the interacting central loop (loop II) of Fas2 (yellow) bound to mAChE in the Fas2–mAChE complex (1KU6), according to all Cα atoms of mAChE in the two structures. The Fas2 side chains that match the structural determinants of the DI molecule are displayed as green bonds. (B) Superimposition of the DI molecule (colored as in A) in the DI–mAChE complex with the PAS-occluding short Ω loop (yellow) of subunit A in the mAChE tetrameric assembly (1MAA), according to all Cα atoms of mAChE in the DI–mAChE complex and in the tetramer subunit C. Those of the mAChE short Ω loop side chains that match the structural determinants of the DI molecule are displayed as orange bonds. The mAChE molecular surfaces buried at the Fas2–mAChE complex interface (A) and at the Ω loop–PAS interface (B) are shown in transparency.
Additional interesting features arise upon structural comparison of the DI– or PI–mAChE complexes with the crystalline mAChE tetramer (Figure 5B). In the tetramer (a dimer of dimers AB and CD) the short Ω loop Cys257–Cys272 and flanking helices α16,7 and α26,7, at the surface of subunit A, associate with the PAS of the facing subunit C and sterically occlude the entrance of the active site gorge; the inverse interaction occurs within the second pair of subunits with subunit D as the loop donor and subunit C as the loop acceptor (Bourne et al., 1999). Superimposition of the DI–mAChE complex with the tetramer subunits A and C reveals similarities between the DI molecule and the short Ω loop, bound at the mAChE gorge entrance. The phenanthridinium rings in DI (or PI) overlap with the Gly260–Gly261 doublet in the Ω loop, achieving the same stacking interactions with the side chain of Trp286 in the PAS. Moreover, a segment of the DI alkyl chain mimics the side chain of Arg253, in helix α16,7 N-terminal to the Ω loop, to establish the same van der Waals interaction with residue Glu292 in the PAS. Hence, the similarities in the positions and interaction loci of the DI (or PI) molecule, the tip of Fas2 loop II and the mAChE short Ω loop motif support the argument that PAS serves as a general site for association of interactive peptidic or organic motifs (Bourne et al., 1999).
Finally, structural comparisons of the DI–mAChE complex with complexes between TcAChE and the bifunctional inhibitors DECA, E2020, MF268 or BW284C51, which span the full length of the gorge from the buried catalytic site to the surface PAS, essentially highlight: (i) the crucial stacking capacities of the Trp286 indole ring mainly through π–π interactions; (ii) significant differences in the position of two structural determinants, loop Tyr341–Val343 and the tip of the Ω loop, which delineate the gorge entrance; and (iii) the identification, based on the contacts that the DI alkyltrimethylammonium establishes at the gorge entrance, of as yet unsuspected PAS determinants such as loop His287–Glu292, inserted between helices α36,7 and α46,7 at the gorge entrance.
Biological implications of the structures
Using distinctive purification and crystallization conditions, we have solved four novel structures of mAChE, one apo-mAChE and three PAS ligand–mAChE complexes, with resolution in the 2.20–2.35 Å range. These structures unveil new structural determinants contributing to ligand interactions at the AChE PAS and permit a detailed topographic delineation of its locus. The PAS propensity for binding ligands, peptides and symmetry-related molecules in solution and in the crystal makes it a likely candidate region for protein–protein interactions in situ. Hence, mapping potential interaction sites with PAS-selective ligands may offer insight into the sites where heterologous interactions of AChE with its as yet unidentified partner(s) in synaptogenesis or with constituent proteins in the Alzheimer’s plaques occur (Soreq and Seidman, 2001). Actually, the phenanthridinium ligands share no structural or functional resemblance with the anticholinesterase drugs that are approved or under advanced clinical trial for Alzheimer’s disease therapy, some of which inhibit both AChE and butyrylcholinesterase. Our structures, when considered with respect to the distinct topographies and binding capacities of the PAS region of AChE over butyrylcholinesterase (Figure 6), provide valuable templates for ligand docking studies and the design of new compounds based on the PAS template, and having the potential to inhibit AChE with a wide range of affinities (Lewis et al., 2002). Moreover, the unique mAChE crystal form developed in this study offers further opportunities for a structural approach to examining the molecular bases of those PAS ligand–AChE interactions that are involved in regulation of catalysis by substrate in excess or in the assembly of amyloid β-peptides into Alzheimer’s fibrils.
Materials and methods
Purification, crystallization and data collection
Decidium diiodide, synthesized and purified as previously described (Berman et al., 1987), was a gift from Dr Harvey A.Berman (Department of Biochemical Pharmacology, State University of New York at Buffalo, Buffalo, NY). Propidium diiodide, gallamine triiodide, sodium iodide and PEG-600 were purchased from Sigma.
Soluble mAChE was expressed in HEK-293 cells and purified by affinity chromatography on an m-aminophenyltrimethylammonium-conjugated resin as previously described (Marchot et al., 1996; Bourne et al., 1999), except that elution was achieved by either 1 mM DI or 5 mM PI instead of 100 mM DECA. The DI- and PI-eluted enzymes were dialyzed against 1 mM MES pH 6.5, 50 mM NaCl, 0.01% (w/v) NaN3 (crystallization buffer), a procedure that permitted total buffer exchange but not total release of the bound ligand, as monitored spectrophotometrically (see below); the dialyzed enzymes were concentrated to ∼5 mg/ml by ultrafiltration on Centricon units (Amicon). The free enzyme (apo-mAChE) was prepared from PI-eluted mAChE by extensive additional dialysis against 1 mM MES pH 6.5, 1 M NaCl, 40 mM MgCl2, 0.01% (w/v) NaN3, then desalting by gel filtration FPLC on Superdex-200 (Amersham Pharmacia Biotech.) in the crystallization buffer; total removal of the bound PI was checked spectrophotometrically. The DI– and PI–mAChE complexes used for crystallization were prepared by re-addition to the dialyzed DI- and PI-eluted enzymes, respectively, of a 10-fold molar excess of the inhibitor followed by equilibration under gentle shaking at 4°C. The GAL–mAChE complex was prepared using apo-mAChE and a 30-fold molar excess of the inhibitor over the enzyme [2.2 mM, i.e. 150 × Ki (15 µM) for TcAChE and 60 × Ki (37 µM) for HuAChE; Eichler et al., 1994; Szegletes et al., 1998] (overnight equilibration, 4°C). The apo-mAChE and mAChE–PAS inhibitor complexes were concentrated to 10–12 mg/ml by ultrafiltration without rinsing, and stored on ice.
Crystallization was achieved at 4°C by vapor diffusion using hanging drops (2 µl) and a protein to well solution ratio of 1:1, with 25–32% (v/v) PEG-600 in 20–100 mM of either HEPES or sodium acetate pH 6.5–8.0 as the well solution. For the PI– and GAL–mAChE complexes, the well solutions also contained 2–5 mM PI and 90 mM GAL, respectively. Single crystals grew within 1–2 weeks to an average size of 0.4 × 0.1 × 0.1 mm. While crystals of apo-mAChE were uncolored, those of the DI– and PI–mAChE complexes were colored dark pink and dark red, respectively, supporting the presence of high DI and PI concentrations in the crystals; crystals of the GAL–mAChE complex were colored yellow, suggesting that the iodide brought along with the GAL triiodide salt had concentrated in the crystal. The I-mAChE crystals were prepared by soaking apo-mAChE crystals in 20 µl of reservoir solution complemented with 250 mM NaI until the crystals turn yellow. Owing to the cryoprotectant property of the low molecular weight PEG used for crystallization, all crystals were directly flash-cooled in the nitrogen gas stream (100 K), a procedure preventing dissociation of the bound ligand; they were stored in liquid nitrogen. The crystals displaying the highest PAS ligand occupancies were selected spectrophotometrically prior to data collection (see below). Oscillation images were integrated with DENZO (Otwinowski and Minor, 1997) and scaled and merged with SCALA (CCP4, 1994) (Table I). Amplitude factors were generated with TRUNCATE (CCP4, 1994). All four crystals belonged to the orthorhombic space group P212121 with unit cell dimensions a = 79.5 Å, b = 112.3 Å and c = 226.9 Å, yielding a Vm value of 4.2 Å3/Da (∼70% solvent) for two mAChE molecules in the asymmetric unit.
Spectrophotometric analyses
Spectrophotometric analyses of the DI and PI stock solutions and of the concentrated DI– and PI–mAChE complex solutions used for crystallization were carried out with a Unicam 8700 spectrophotometer (Cambridge, UK). To minimize dilution-initiated dissociation of the bound ligands, analysis of the complexes used microcuvettes of 2 mm path length and 100 µl volume.
Analyses of the crystals used a microspectrophotometer consisting of a xenon arc lamp (Oriel Instruments) connected by a quartz fiber optic light guide to focusing mirrors (Coherent) and a high-sensitivity spectrophotometer (Ocean Optics, Dunedin, USA). Spectra were recorded between 300 and 700 nm using unpolarized light, and special care was taken to ensure linearity in optical densities and to calibrate the wavelengths using a 632.8 nm laser. The baseline was corrected using the crystallization solution as a reference. All crystals and solutions were kept frozen in a nitrogenous gas stream (100 K) during spectra recording. Data were processed using the SpectraWin (Ocean Optics) software. Crystals of apo-mAChE and of the GAL–mAChE complex showed no absorbance in the wavelength range employed apart from a tailing at 300 nm due to the concentrated protein and GAL.
Structure determination and refinement
Initial phases for the apo-mAChE data were obtained by molecular replacement using one subunit of the crystalline mAChE tetramer (accession code 1MAA; Bourne et al., 1999) as a search model with the AMoRe program package (Navaza, 1994), giving a correlation coefficient of 70% and an R-factor value of 32% in the 15–4 Å resolution range. Two mAChE subunits were positioned within the asymmetric unit. Rigid-body refinement, performed on each of the two subunits with program CNS (Brünger et al., 1998) using data between 20 and 3 Å, gave an R-factor of 24%. For 2% of the reflections against which the model was not refined, Rfree was 23%. The model was refined to 2.35 Å resolution using CNS, including non-crystallographic restraints, bulk solvent and anisotropic B-factor corrections; the resulting 2Fo – Fc and Fo – Fc electron density maps were used to correct the model with the graphics program TURBO-FRODO (Roussel and Cambillau, 1989). Solvent molecules automatically added using CNS were examined carefully on the graphics display and their positions were compared with those in the 1.8 Å resolution refined structure of TcAChE (1EA5). Four partial PEG molecules and two carbonates were also added in the latest stages of the refinement.
The apo-mAChE structure without solvent was used as a starting model to refine the DI–, PI– and GAL–mAChE complex structures using procedures similar to those used for the apo-mAChE structure determination. The PI and DI molecules were built using the Insight II software package (Accelerys, San Diego, CA) and appropriately constrained. In the case of DI, initial Fourier difference maps clearly revealed the location of the bound DI molecule in one subunit of the dimer, suggesting complete occupancy, whereas partial occupancy was seen in the second subunit. Successive refinement cycles, including non-crystallographic symmetry restraints, significantly improved the quality of the electron density maps in the PAS region of the second subunit. In the case of PI, initial Fourier difference maps clearly showed the PI phenanthridinium ring position, while the phenyl ring and the alkyl chain appeared weakly. In the course of refinement, it appeared that these two moieties adopt alternative conformations, as verified with simulated annealing omit maps. In the case of GAL, the GAL ring was visible from the initial difference maps, while the three alkyl chains were not visible. During the course of GAL–mAChE complex refinement, high level positive peaks in the difference maps were found to match the positions of 10 solvent molecules in the structure. Based on the inspection of the anomalous Fourier maps showing 10 peaks ranging from 18 to 7.7σ, these peaks were identified as iodide ions of moderate occupancy. At the wavelength used for data collection, the f′′ anomalous scattering contribution of iodide is still ∼4 electrons for the I absorption K-edge. Among the 10 sites, only two have no local symmetry counterparts and establish contacts between symmetry-related molecules. The other eight sites are arranged as four pairs of analogous sites in the dimer subunits. For one of these pairs, the iodide ions are located near the gorge entrance and are hydrogen bonded to an oxygen atom of GAL and the amide nitrogen atom of mAChE Phe295. With the exception of this pair, the same iodide-binding sites with similar occupancies were observed in an apo-mAChE-I structure obtained from crystal soaking; this finding underscores the potential contribution of an iodide anomalous signal for phase determination when molecular replacement fails to solve AChE structures.
The final apo-mAChE model comprises residues Glu1–Ala542 and Glu4–Thr543, respectively, for the two molecules in the asymmetric unit. The N-terminal segment Glu1–Glu4 and surface loop Asp491–Pro498, which were ill defined in structure 1MAA, could be modeled, but high temperature factors and weak electron densities remain associated with residues Cys257, Pro258 and Asp265 in the short Ω loop Cys257–Cys272, and with the loop region Asp491–Pro498. For the GAL–mAChE complex, weak electron density is associated with region Asp74–Pro78 of the large Ω loop Cys69–Cys96, and with region Val340–Gly342 at the gorge entrance. The average r.m.s.d. between the two apo-mAChE subunits is 0.2 Å for 533 Cα atoms with the largest deviation (2 Å) for residue Ala495: between one apo-mAChE subunit and the corresponding subunit in structure 1MAA, it is 0.48 Å for 533 Cα atoms; between the apo form and each of the DI and PI complexes, it is 0.11 Å for 535 Cα atoms; and between the apo form and the GAL complex, it is 0.17 Å for 533 Cα atoms. Stereochemistries of the four models were analyzed with PROCHECK (Laskowski et al., 1993); with the exception of the catalytic Ser203, no residues were found in the disallowed regions of the Ramachandran plot. Data collection and refinement statistics are summarized in Table I. The atomic coordinates and structure factors of the apo-mAChE and DI–, PI– and GAL–mAChE structures have been deposited with the Protein Data Bank, accession codes 1J06, 1J07, 1N5R and 1N5M. Figures 3–5 were generated with SPOCK (Christopher, 1998) and Raster3D (Merritt and Bacon, 1997).
Comparison with other AChE structures
Comparison of the DI– and PI–mAChE complex structures with AChE structures where the PAS region is occluded from outside by fasciculin Fas2 or a symmetry-related AChE molecule included the Fas2–mAChE complex (1KU6; Bourne et al., 1995), the mAChE tetrameric assembly with its PAS-occluding short Ω loop (1MAA; Bourne et al., 1999) and the apo-TcAChE structure (2ACE; Raves et al., 1997). Comparison with structures where the PAS region is partly occupied from inside by a bifunctional inhibitor molecule included the TcAChE complexes with DECA (1ACL; Harel et al., 1993), E2020 (1EVE; Kryger et al., 1999), MF268 (1OCE; Bartolucci et al., 1999) and BW284C51 (1E3Q; Felder et al., 2002).
Acknowledgments
Acknowledgements
We thank H.A.Berman (SUNYB) for the gift of decidium diiodide and fruitful discussions, J.Kanter, L.Wong, I.Niesman and M.Zhang (UCSD) for preparation of the enzyme, M.Juin (CNRS UMR 6560) for assistance in crystallogenesis, K.Brown and G.Sulzenbacher (CNRS UMR 6098) for assistance in crystal spectrophotometry and data collection, respectively, and P.E.Bougis (CNRS UMR 6560) for discussion. Expert assistance from E.Mitchell, R.Ravelli, and S.McSweenney of the ESRF staff is much appreciated. This work was supported by USPHS grant R37-GM18360 and DAMD grant 17-1-8014 (to P.T.), the NSF-CNRS collaborative project 3906 (to P.M. and P.T.), and the AFM (to P.M. and P.E.B.).
References
- Barak D., Kronman,C., Ordentlich,A., Ariel,N., Bromberg,A., Marcus,D., Lazar,A., Velan,B. and Shafferman,A. (1994) Acetyl cholinesterase peripheral anionic site degeneracy conferred by amino acid arrays sharing a common core. J. Biol. Chem., 269, 6296–6305. [PubMed] [Google Scholar]
- Barak D., Ordentlich,A., Bromberg,A., Kronman,C., Marcus,D., Lazar,A., Ariel,N., Velan,B. and Shafferman,A. (1995) Allosteric modulation of acetylcholinesterase activity by peripheral ligands involves a conformational transition of the anionic subsite. Biochemistry, 34, 15444–15452. [DOI] [PubMed] [Google Scholar]
- Bartolucci C., Perola,E., Cellai,L., Brufani,M. and Lamba,D. (1999) ‘Back door’ opening implied by the crystal structure of a carbamoylated acetylcholinesterase. Biochemistry, 38, 5714–5719. [DOI] [PubMed] [Google Scholar]
- Berman H.A. and Decker,M.M. (1986) Kinetic, equilibrium and spectroscopic studies on cation association at the active center of acetylcholinesterase: topographic distinction between trimethyl and trimethylammonium sites. Biochim. Biophys. Acta, 872, 125–133. [DOI] [PubMed] [Google Scholar]
- Berman H.A., Yguerabide,J. and Taylor,P. (1980) Fluorescence energy transfer on acetylcholinesterase: spatial relationship between peripheral site and active center. Biochemistry, 19, 2226–2235. [DOI] [PubMed] [Google Scholar]
- Berman H.A., Becktel,W. and Taylor,P. (1981) Spectroscopic studies on acetylcholinesterase: influence of peripheral site occupation on active-center conformation. Biochemistry, 20, 4803–4810. [DOI] [PubMed] [Google Scholar]
- Berman H.A., Decker,M.M., Nowak,M.W., Leonard,K.J., McCauley,M., Baker,W.M. and Taylor,P. (1987) Site selectivity of fluorescent bisquaternary phenanthridinium ligands for acetylcholinesterase. Mol. Pharmacol., 31, 610–616. [PubMed] [Google Scholar]
- Bourne Y., Taylor,P. and Marchot,P. (1995) Acetylcholinesterase inhibition by fasciculin: crystal structure of the complex. Cell, 83, 503–512. [DOI] [PubMed] [Google Scholar]
- Bourne Y., Taylor,P., Bougis,P.E. and Marchot,P. (1999) Crystal structure of mouse acetylcholinesterase: a peripheral site-occluding loop in a tetrameric assembly. J. Biol. Chem., 274, 2963–2970. [DOI] [PubMed] [Google Scholar]
- Brünger A.T. et al. (1998) Crystallography and NMR system: a new software suite for macromolecular structure determination. Acta Crystallogr. D, 54, 905–921. [DOI] [PubMed] [Google Scholar]
- CCP4 (1994) The CCP4 suite: programs for protein crystallography. Acta Crystallogr. D, 50, 760–763. [DOI] [PubMed] [Google Scholar]
- Changeux J.P. (1966) Responses of acetylcholinesterase from Torpedo marmorata to salts and curarizing agents. Mol. Pharmacol., 2, 369–392. [PubMed] [Google Scholar]
- Christopher J.A. (1998) SPOCK: The Structural Properties Observation and Calculation Kit Program Manual. The Center for Macromolecular Design, Texas A&M University, College Station, TX.
- Cousin X., Bon,S., Duval,N., Massoulie,J. and Bon,C. (1996) Cloning and expression of acetylcholinesterase from Bungarus fasciatus venom. A new type of COOH-terminal domain; involvement of a positively charged residue in the peripheral site. J. Biol. Chem., 271, 15099–15108. [DOI] [PubMed] [Google Scholar]
- Cygler M., Schrag,J., Sussman,J.L., Harel,M., Silman,I., Gentry,M.K. and Doctor,B.P. (1993) Relationship between sequence conservation and three-dimensional structure in a large family of esterases, lipases, and related proteins. Protein Sci., 2, 366–382. [DOI] [PMC free article] [PubMed] [Google Scholar]
- Dauter Z. and Dauter,M. (2001) Entering a new phase: using solvent halide ions in protein structure determination. Structure, 9, R21–R26. [DOI] [PubMed] [Google Scholar]
- DeFerrari G.V., Mallender,W.D., Inestrosa,N.C. and Rosenberry,T.L. (2001) Thioflavin T is a fluorescent probe of the acetylcholinesterase peripheral site that reveals conformational interactions between the peripheral and acylation sites. J. Biol. Chem., 276, 23282–23287. [DOI] [PubMed] [Google Scholar]
- Eastman J., Wilson,E.J., Cerveñansky,C. and Rosenberry,T.L. (1995) Fasciculin 2 binds to the peripheral site on acetylcholinesterase and inhibits substrate hydrolysis by slowing a step involving proton transfer during enzyme acylation. J. Biol. Chem., 270, 19694–19701. [DOI] [PubMed] [Google Scholar]
- Eichler J., Anselmet,A., Sussman,J.L., Massoulie,J. and Silman,I. (1994) Differential effects of ‘peripheral’ site ligands on Torpedo and chicken acetylcholinesterase. Mol. Pharmacol., 45, 335–340. [PubMed] [Google Scholar]
- Epstein D.J., Berman,H.A. and Taylor,P. (1979) Ligand induced conformational changes in acetylcholinesterase investigated with fluorescent phosphonates. Biochemistry, 18, 4749–4754. [DOI] [PubMed] [Google Scholar]
- Felder C.E., Harel,M., Silman,I. and Sussman,J.L. (2002) Structure of a complex of the potent and specific inhibitor BW284C51 with Torpedo californica acetylcholinesterase. Acta Crystallogr. D, 58, 1765–1771. [DOI] [PubMed] [Google Scholar]
- Greenblatt H.M., Kryger,G., Lewis,T., Silman,I. and Sussman,J.L. (1999) Structure of acetylcholinesterase complexed with (–)-galanthamine at 2.3 Å resolution. FEBS Lett., 463, 321–326. [DOI] [PubMed] [Google Scholar]
- Grubič Z., Stalc,A., Sentjurc,M., Pecar,S., Gentry,M.K. and Doctor,B.P. (1995) Different effects of two peripheral anionic site-binding ligands on acetylcholinesterase active-site gorge topography revealed by electron paramagnetic resonance. Biochim. Biophys. Acta, 1249, 155–160. [DOI] [PubMed] [Google Scholar]
- Harel M., Schalk,I., Ehret-Sabatier,L., Bouet,F., Goeldner,M., Hirth,C., Axelsen,P.H., Silman,I. and Sussman,J.L. (1993) Quaternary ligand binding to aromatic residues in the active-site gorge of acetylcholinesterase. Proc. Natl Acad. Sci. USA, 90, 9031–9035. [DOI] [PMC free article] [PubMed] [Google Scholar]
- Harel M., Kleywegt,G.J., Ravelli,R.B.G., Silman,I. and Sussman,J.L. (1995) Crystal structure of an acetylcholinesterase–fasciculin complex: interaction of a three-fingered toxin from snake venom with its target. Structure, 3, 1355–1366. [DOI] [PubMed] [Google Scholar]
- Inestrosa N.C., Alvarez,A., Perez,C.A., Moreno,R.D., Vicente,M., Linker,C., Casanueva,O.I., Soto,C. and Garrido,J. (1996) Acetylcholinesterase accelerates assembly of amyloid-β-peptides into Alzheimer’s fibrils: possible role of the peripheral site of the enzyme. Neuron, 16, 881–891. [DOI] [PubMed] [Google Scholar]
- Johnson G. and Moore,S.W. (1999) The adhesion function on acetylcholinesterase is located at the peripheral anionic site. Biochem. Biophys. Res. Commun., 258, 758–762. [DOI] [PubMed] [Google Scholar]
- Karlsson E., Mbugua,P.M. and Rodriguez-Ithurralde,D. (1984) Fasciculins, anticholinesterase toxins from the venom of the green mamba Dendroaspis angusticeps. J. Physiol., 79, 232–240. [PubMed] [Google Scholar]
- Koellner G., Kryger,G., Millard,C.B., Silman,I., Sussman,J.L. and Steiner,T. (2000) Active-site gorge and buried water molecules in crystal structures of acetylcholinesterase from Torpedo californica. J. Mol. Biol., 296, 713–735. [DOI] [PubMed] [Google Scholar]
- Kryger G., Silman,I. and Sussman,J.L. (1999) Structure of acetylcholinesterase complexed with E2020 (Aricept): implications for the design of new anti-Alzheimer drugs. Structure Fold. Design, 7, 297–307. [DOI] [PubMed] [Google Scholar]
- Kryger G. et al. (2000) Structures of recombinant native and E202Q mutant human acetylcholinesterase complexed with the snake-venom toxin fasciculin-II. Acta Crystallogr. D, 56, 1385–1394. [DOI] [PubMed] [Google Scholar]
- Laskowski R.A., MacArthur,M.W., Moss,D.S. and Thornton,J.M. (1993) PROCHECK: a program to check the stereochemical quality of protein structures. J. Appl. Crystallogr., 26, 283–291. [Google Scholar]
- LeDu M.H., Marchot,P., Bougis,P.E. and Fontecilla-Camps,J.C. (1992) 1.9-Å resolution structure of fasciculin 1, an anti-acetylcholinesterase toxin from green mamba snake venom. J. Biol. Chem., 267, 22122–22130. [DOI] [PubMed] [Google Scholar]
- Lewis W.G., Green,L.G., Grynszpan,F., Radić,Z., Carlier,P.R., Taylor,P., Finn,M.G. and Sharpless,K.B. (2002) Click chemistry in situ: acetylcholinesterase as a reaction vessel for the selective assembly of a femtomolar inhibitor from an array of building blocks. Angew. Chem. Int. Ed., 41, 1053–1057. [DOI] [PubMed] [Google Scholar]
- Mallender W.D., Szegletes,T. and Rosenberry,T.L. (2000) Acetylcholine binds to Asp74 at the peripheral site of human acetylcholinesterase as the first step in the catalytic pathway. Biochemistry, 39, 7753–7763. [DOI] [PubMed] [Google Scholar]
- Marchot P., Khélif,A., Ji,Y.-H., Mansuelle,P. and Bougis,P.E. (1993) Binding of 125I-fasciculin to rat brain acetylcholinesterase: the complex still binds diisopropyl fluorophosphate. J. Biol. Chem., 268, 12458–12467. [PubMed] [Google Scholar]
- Marchot P., Ravelli,R.B.G., Raves,M.L., Bourne,Y., Vellom,D.C., Kanter,J., Camp,S., Sussman,J.L. and Taylor,P. (1996) Soluble monomeric acetylcholinesterase from mouse: expression, purification, and crystallization in complex with fasciculin. Protein Sci., 5, 672–679. [DOI] [PMC free article] [PubMed] [Google Scholar]
- Marchot P., Prowse,C.N., Kanter,J., Camp,S., Ackermann,E.J., Radić,Z., Bougis,P.E. and Taylor,P. (1997) Expression and inhibitory activity of mutants of fasciculin, a peptidic acetylcholinesterase inhibitor from mamba venom. J. Biol. Chem., 272, 3502–3510. [DOI] [PubMed] [Google Scholar]
- Massoulié J., Pezzementi,L., Bon,S., Krejci,E. and Valette,F.M. (1993) Molecular and cellular biology of the cholinesterases. Prog. Neurobiol., 41, 31–39. [DOI] [PubMed] [Google Scholar]
- Merritt E.A. and Bacon,D.J. (1997) Raster3D: photorealistic molecular graphics. Methods Enzymol., 277, 505–524. [DOI] [PubMed] [Google Scholar]
- Navaza J. (1994) AMoRe: an automated package for molecular replacement. Acta Crystallogr. A, 50, 157–163. [Google Scholar]
- Ordentlich A., Barak,D., Kronman,C., Ariel,N., Segall,Y., Velan,B. and Shafferman.A, (1995) Contribution of aromatic moieties of tyrosine 133 and of the anionic subsite tryptophan 86 to catalytic efficiency and allosteric modulation of acetylcholinesterase. J. Biol. Chem., 270, 2082–2091. [DOI] [PubMed] [Google Scholar]
- Otwinowski Z. and Minor,W. (1997) Processing of X-ray diffraction data collected in oscillation mode. Methods Enzymol., 276, 307–326. [DOI] [PubMed] [Google Scholar]
- Rachinsky T.L., Camp,S., Li,Y., Ekström,J., Newton,M. and Taylor,P. (1990) Molecular cloning of mouse acetylcholinesterase: tissue distribution of alternatively spliced mRNA species. Neuron, 5, 317–327. [DOI] [PubMed] [Google Scholar]
- Radić Z. and Taylor,P. (2001) Peripheral site ligands accelerate inhibition of acetylcholinesterase by neutral organophosphates. J. Appl. Toxicol., 21, S13–S14. [DOI] [PubMed] [Google Scholar]
- Radić Z., Reiner,E.and Taylor,P. (1991) Role of the peripheral anionic site in acetylcholinesterase: inhibition by substrates and coumarin derivatives. Mol. Pharmacol., 39, 98–104. [PubMed] [Google Scholar]
- Radić Z., Pickering,N.A., Vellom,D.C., Camp,S. and Taylor,P. (1993) Three distinct domains in the cholinesterase molecule confer selectivity for acetyl- and butyrylcholinesterase inhibitors. Biochemistry, 32, 12074–12084. [DOI] [PubMed] [Google Scholar]
- Radić Z., Quinn,D.M., Vellom,D.C., Camp,S. and Taylor,P. (1995) Allosteric control of acetylcholinesterase catalysis by fasciculin. J. Biol. Chem., 270, 20391–20399 [erratum in J. Biol. Chem. (1995) 270, 31414]. [DOI] [PubMed] [Google Scholar]
- Raves M.L., Harel,M., Pang,Y.P., Silman,I., Kozikowski,A.P. and Sussman,J.L. (1997) Structure of acetylcholinesterase complexed with the nootropic alkaloid, (–)-huperzine A. Nat. Struct. Biol., 4, 57–63. [DOI] [PubMed] [Google Scholar]
- Robaire B. and Kato,G. (1974) Effects of Mg2+ and Ca2+ on soluble and membrane-bound acetylcholinesterase from Electrophorus electricus. Biochem. Pharmacol., 23, 2476–2480. [DOI] [PubMed] [Google Scholar]
- Roufogalis B.D. and Quist,E.E. (1972) Relative binding sites of pharmacologically active ligands on bovine acetylcholinesterase. Mol. Pharmacol., 8, 41–49. [PubMed] [Google Scholar]
- Roussel A. and Cambillau,C. (1989) TURBO-FRODO. In Silicon Graphics Committee (eds), Silicon Graphics Geometry Partners Directory. Silicon Graphics, Mountain View, CA, pp. 77–78.
- Shafferman A. et al. (1992) Substrate inhibition of acetylcholinesterase: residues affecting signal transduction from the surface to the catalytic center. EMBO J., 11, 3561–3568. [DOI] [PMC free article] [PubMed] [Google Scholar]
- Shi J., Boyd,A.E., Radić,Z. and Taylor,P. (2001) Reversibly bound and covalently attached ligands induce conformational changes in the Ω loop, Cys69–Cys96, of mouse acetylcholinesterase. J. Biol. Chem., 276, 42196–42204. [DOI] [PubMed] [Google Scholar]
- Shi J., Radić,Z. and Taylor,P. (2002) Inhibitors of different structure induce distinguishing conformations in the Ω loop, Cys 69–Cys96, of mouse acetylcholinesterase. J. Biol. Chem., 277, 43301–43308. [DOI] [PubMed] [Google Scholar]
- Soreq H. and Seidman,S. (2001) Acetylcholinesterase: new roles for an old actor. Nat. Rev. Neurosci., 2, 294–302. [DOI] [PubMed] [Google Scholar]
- Sussman J.L., Harel,M., Frolow,F., Oefner,C., Goldman,A., Toker,L. and Silman,I. (1991) Atomic structure of acetylcholinesterase from Torpedo californica: a prototypic acetylcholine-binding protein. Science, 253, 872–879. [DOI] [PubMed] [Google Scholar]
- Szegletes T., Mallender,W.D. and Rosenberry,T.L. (1998) Nonequilibrium analysis alters the mechanistic interpretation of inhibition of acetylcholinesterase by peripheral site ligands. Biochemistry, 37, 4206–4216. [DOI] [PubMed] [Google Scholar]
- Taylor P. and Lappi,S. (1975) Interaction of fluorescence probes with acetylcholinesterase. The site and specificity of propidium binding. Biochemistry, 14, 1989–1997. [DOI] [PubMed] [Google Scholar]
- Taylor P. and Radić,Z. (1994) The cholinesterases: from genes to proteins. Annu. Rev. Pharmacol. Toxicol., 34, 281–320. [DOI] [PubMed] [Google Scholar]
- Wlodek S.T., Antosiewicz,J., Gilson,M.K., McCammon,J.A., Clark,T.W. and Scott,L.R. (1995) Computer modeling of acetyl cholinesterase and acetylcholinesterase–ligand complexes. In Quinn,D.M., Balasubramanian,A.S., Doctor,B.P. and Taylor.P. (eds), Enzymes of the Cholinesterase Family. Plenum Publishing Corp., NY, pp. 97–104.