

Abstract
Educational attainment is an important factor in the interpretation of cognitive test scores but years of education are not necessarily synonymous with educational quality among racial/ethnic minority populations. This study investigated the comparability of educational attainment with reading level and examined whether discrepancies in education and reading level accounted for differences in neuropsychological test performance between HIV+ racial/ethnic minority and nonminority participants. Study participants (N = 200) were derived from the Manhattan HIV Brain Bank (MHBB) where 50% of the cohort had ≤8th grade reading level but only 5% had ≤8 years of education. Significantly lower reading ability and education was found among African Americans and Hispanics, and these participants were more likely to have discrepant reading and education levels compared to non-Hispanic Whites. Discrepancy in reading and education level was associated with worse neuropsychological performance while racial/ethnic minority status was not. As years of schooling overestimated racial/ethnic minority participants’ educational quality, standard norms based on education may inflate impairment rates among racial/ethnic minorities. Identifying appropriate normative standards is and will continue to be important in the detection of cognitive impairment in racial/ethnic minorities with HIV.
Keywords: Literacy, Education, Ethnicity, HIV, Neuropsychology, Premorbid IQ
INTRODUCTION
Racial/ethnic differences in neuropsychological test performance are widely observed (Miller et al., 1993; Jacobs et al., 1997 Tang et al., 2001) and without appropriate normative corrections, the potential to misclassify racial/ethnic minorities as having cognitive dysfunction exists (Adams et al., 1982; Manly et al., 1998b; Heaton et al., 2001). Racial/ethnic minorities tend to have lower education levels and lower socioeconomic status than non-Hispanic Whites, but even when groups are matched for education and socioeconomic status African Americans tend to have lower scores on verbal and nonverbal tests (Stern et al., 1992; Welsh et al., 1995; Manly et al., 1998a, 1998b, 2002). Recent research has revealed that matching racial/ethnic groups for years of education is ineffective because it falsely assumes equivalent educational quality among different ethnic/racial groups. For instance, among African American elders, years of schooling are an inadequate measure of educational quality because their reading skills tend to be below their educational level (Baker et al., 1996; Albert & Teresi, 1999; Manly et al., 2002).
Accurate interpretation of ethnic/racial minorities’ test performance is an extremely important issue in contemporary neuropsychology because of the historical neglect of these groups and our increasingly diverse multicultural society. The appreciation of our cultural diversity has facilitated investigating the utility of ethnically diverse normative samples. It has also led to studying variables that are proxies for ethnicity but are more precisely related to culture, education, and access. Comparing the performance of racial/ethnic minorities to demographically similar groups has led to decreases in misclassification rates (Lucas et al., 1998; Norman et al., 2000; Heaton et al., 2001; Patton et al., 2003), which is a primary benefit of norms that account for ethnicity (Manly, 2005).
Recently, the utility of ethnic/racial categories as an explanatory construct in behavioral science research has been questioned because these categories lack consensual scientific meaning in psychology (Helms et al., 2005). Replacing racial categories with conceptual constructs has been recommended. This recommendation parallels investigations of educational quality and access, factors that can differ by race/ethnicity but are due to sociopolitical forces and not endemic to race. For example, reading ability is associated with academic achievement (Wilkinson, 1993) as well as educational resources (i.e., teacher training, school district spending on students, and student/teacher ratio) (Hedges et al., 1994). Reading ability has been shown to be a proxy for educational quality that attenuates racial/ethnic differences in neuropsychological test performance in an elderly cohort (Manly et al., 2002). Thus, reading ability may be a more meaningful variable than years of education in the assessment of racial/ethnic minorities and interpretation of their performance.
Identifying superior assessment methods is especially important in neurodegenerative research where the primary objective is the detection of disease-related cognitive deficits and thus, diagnostic accuracy is paramount. The HIV epidemic disproportionately affects African Americans and Hispanics (CDC, 2003). There have been a few studies reporting that HIV+ African Americans tend to have lower neuropsychological scores than HIV+ non-Hispanic Whites (Miller et al., 1997; Manly et al., 1998a) and Hispanics (Richardson et al., 2002). However, HIV+ and HIV− African Americans’ scores do not differ from each other until an AIDS diagnosis (Mason et al., 1998). Understanding how best to measure neurocognitive abilities in racial/ethnic minorities will help elucidate the prevalence of HIV-related neuropsychological impairment in these groups and minimize potential confounds in the interpretation of impaired scores due to measurement error. While HIV infection can occur throughout the lifespan, the majority of infected individuals are ages 35–44 (CDC, 2003). Previous work assessing the contribution of reading to neuropsychological performance in racial/ethnic minorities has been conducted with elderly cohorts (Manly et al., 2002, 2003), thus, whether these results generalize to younger cohorts is unknown.
Using a cross-sectional design, the present study examined the utility of reading ability as a proxy for education in a middle-aged cohort. We investigated the magnitude of discrepancies in years of education versus reading grade level among a predominantly racial/ethnic minority cohort with advanced HIV disease. Using published norms we compared rates of neuropsychological impairment based on education-corrected and reading-grade-adjusted normative data. For education-corrected normative data, participants’ reported education levels were used. For reading-grade-adjusted normative data, we substituted participants’reading-grade levels for their education. We tested the hypothesis that a discrepancy in reading level versus years of education and not ethnicity/race would account for differences in neuropsychological test performance among a diverse cohort.
METHODS
Research Participants
Two hundred study participants were derived from the Manhattan HIV Brain Bank (MHBB), a longitudinal observational study that includes biannual neurologic, neuropsychologic, and psychiatric examinations. The MHBB participants were HIV-positive and gave consent for postmortem organ donation for research purposes. All participants were English-speaking. Participants were excluded from this study analysis if they had dyslexia or another condition (i.e., blindness) that confounded or prevented their reading. The present analyses utilized baseline data.
Further MHBB participation eligibility criteria include: (1) presence of a condition indicative of advanced HIV without effective therapy, or (2) a CD4 count ≤ 50 cells/mm3 for at least a 3-month period of time or (3) substantive risk for imminent mortality in the judgment of the participant’s primary physician. Indicator conditions for criterion 1 are progressive multifocal leukoencephalopathy, systemic or CNS lymphoma, disseminated mycobacterium avium-intracellulare, wasting (>30% lean body mass), AIDS Dementia Complex, CMV end organ disease, visceral Kaposi’s sarcoma, congestive heart failure, hemoglobin less than 10 mg/dl, or serum albumin <3.2 g/dl.
Procedure
Reading level
The Reading Recognition subtest of the Wide Range Achievement Test–Version 3 (WRAT-3, Wilkinson, 1993) was administered to assess reading level. Participants were asked to pronounce words and if they were unable to correctly pronounce ten consecutive words, to name letters. Words are listed in order of decreasing familiarity and increasing phonological complexity. Grade equivalent scores were derived by age-based normative values from the WRAT-3 manual. The WRAT-3 reading grades were quantified from prekindergarten through 8th grade. Beyond an 8th grade reading level, participants were assigned either “high school” or “post high school” reading levels. These qualitative descriptors were used because test development revealed little variance within the high school or within the post high school reading levels (G. Wilkinson, personal communication, November, 2003). Thus, we assigned any participant with a “high school” reading ability a 12th grade reading level and participants with a “post high school” reading level were arbitrarily assigned 13 years.
We classified participants into two groups by comparing their education level and reading grade. In the first group, reading grade and education were either equivalent or within 1 year. This Reading/Education Equivalent Group included participants whose reading and education were equivalent by grade level. For instance, it included participants with a 9th grade education and 12th grade reading level, as these are both at the high school grade level. Similarly, participants with 16 years education and a college reading level who were arbitrarily assigned 13 years were classified in this group. The second group was comprised of participants whose reading grade score was at least two years less than their education level (Reading/Education Discrepant). This group included participants who had a college education but a high school reading level.
Given that a ≥ 2 year discrepancy in education level versus reading grade would lead to a participant’s stated years of education potentially overestimating the quality of education he or she received, the Reading/Education Discrepant group was the primary interest of our study and as such we subjected this group to further analyses. We obtained a sample of alphabet writing and measured reported histories of learning problems in a subset of this group.
Neuropsychological battery
Participants were administered a battery of neuropsychological tests that assessed a broad range of cognitive abilities sensitive to HIV impairment (Woods et al., 2004). Specific tests included the Trail Making Test–Parts A and B (TMT-A andTMT-B, respectively), Grooved PegboardTest–Dominant and Nondominant Hands (GPDH and GPNDH, respectively); Hopkins Verbal Learning Test (HVLT), Brief Visuospatial Memory Test–Revised (BVMT-R), WAIS-III Digit Symbol, WAIS-III Symbol Search, WAIS-III Letter Number Sequencing, Controlled Oral Word Association Test (COWA-FAS), Paced Auditory Serial Addition Test (PASAT), Wisconsin Card Sorting Test-64 card version (WCST-64), and the Reading subtest of theWide RangeAchievementTest-3 (WRAT-3). To investigate prevalence of impairment across domains, we assigned t scores using the following published norms: Heaton et al. (1991) for GPDH, GPNDH, TMT-A, and TMT-B; Gladsjo et al. (1999) for FAS; Benedict et al. (1998) for HVLT; Benedict (1997) for BVMT-R; Tulsky & Price (2003) for the WAIS-III subtests; Diehr et al. (2003) for PASAT; and Kongs et al. (2000) for the WCST-64. The WAIS-III tests correct for African American, Hispanic, and non-Hispanic White ethnicity (Tulsky & Price, 2003). The PASAT and FAS provide racial/ethnicity corrections for non-HispanicWhites andAfrican Americans (Diehr et al., 2003; Gladsjo et al., 1999). All of the tests except the BVMT-R corrected for education. We defined impairment as t scores with values 1.5 SDs below the mean.
The individual tests were also grouped according to the following domains (Woods et al., 2004) as indicated in Appendix I. To investigate prevalence of impairment across domains, we assigned t scores using the aforementioned published norms with the exception of the WAIS-III tests, which used norms from Wechsler (1997). Domain scores were derived from the mean t scores of the individual tests in that particular domain, and the global domain score is the mean of all of the individual neuropsychological test t scores.
Reading-grade-adjusted norms for low reading levels
The absence of norms for low education levels required that when participants had a reading-grade level lower than the lowest educational level in the published norms, we used the norms for the lowest educational level even if it was higher than the individuals’ reading-grade level.
RESULTS
Research Participants
Two hundred participants (73% male) were studied. Of these, 51% of the participants were African American, 24% Hispanic, and 25% non-Hispanic White. Mean age was 44.4 years (SD = 7.5). Median CD4 count was 122 cells/mm3 and median log plasma HIV RNA was 3.9736 copies/mL. As a group, African American and Hispanic participants had significantly lower CD4 counts than non-Hispanic Whites (209.36 vs. 314.59 cells/mm3) [t (166) = 2.01, p = .04]. Plasma HIV RNA was not significantly different between racial/ethnic minority and nonminority participants.
Race/Ethnicity, Education Level, and Reading Grade
Fifty percent of the MHBB cohort had an eighth grade reading level or less. Table 1 summarizes the results of reading level (WRAT-3, Reading subtest score) and education comparisons based on race/ethnicity. Significantly lower reading ability and education was found among the African American [t (150) = 5.34, p < .001]; [t (150) = 5.94, p < .001] and Hispanic participants [t (96) = 3.21, p < .001]; [t (94) = 4.26, p < .001], compared to non-Hispanic White participants (see Table 1). Even after covarying for education, significant differences in reading level persisted across the three race/ethnicity groups [F(2,196) = 8.56, p < .001].
Table 1.
Education level and reading-grade level
| African Americans (N = 102)
|
Hispanics (N = 55)
|
Non-Hispanic Whites (N = 50)
|
||||||
|---|---|---|---|---|---|---|---|---|
| M | SD | M | SD | M | SD | F | p | |
| Education | 11.7 | 2.3 | 11.9 | 2.6 | 14.3 | 3.1 | 18.8 | <.001* |
| Reading-grade level | 7.7 | 3.9 | 8.8 | 3.9 | 11.0 | 2.9 | 13.8 | <.001* |
Non-Hispanic Whites >African Americans and Hispanics.
Across the sample there was a significant correlation between the WRAT-3 reading score and education level (r = .67, p < .001), however, the correlation was attenuated in the African American (r = .53, p < .001) and Hispanic participants (r = .58, p < .001) compared with the non-Hispanic White participants (r = 0.74, p < .001). For 71% of the sample, data on median income for the participant’s zip code was available. Partialing out income only slightly lowered the relationship between WRAT-3 scores and education: African American participants (rWE = .55, p < .001 vs. rWE.I = .53, p < .001), non-Hispanic Whites (rWE = .69, p < .01 vs. rWE.I = .66, p < .01). Income acted as a slight suppressor variable with Hispanic participants (rWE = .60, p < .01 vs. rWE.I = .62, p < .01).
Reading Groups
Table 2 illustrates the demographic composition, education, and reading-grade levels within the two groups. There was an association between race/ethnicity and reading group such that significantly more African Americans than non-Hispanic Whites (χ2 = 12.1, df = 1, p < .01) were in the Reading/Education Discrepant group and less in the Reading/Education Equivalent group than expected. The Reading/Education Equivalent group had a significantly higher mean education level than the Reading/Education Discrepant group [t(161) = 2.90, p < .01] and these participants were more likely to finish high school (χ2 = 9.71, df = 1, p < .01). In the Reading/Education Discrepant group, the African Americans had a significantly greater discrepancy in reading versus education than non-Hispanic Whites (5.9 vs. 4.3 years) [t(30) = −2.78, p < .01]. Hispanics also had a significantly greater discrepancy in reading versus education level than non-Hispanic Whites (5.9 vs. 4.3 years) [t(39) = −2.39, p < .05]. Mean WRAT-3 reading grade was significantly lower for the Reading/Education Discrepant group than the Reading/Education Equivalent group [t(198) = 14.56, p < .001]. Although we did not routinely assess participant’s knowledge of the alphabet, we had data for 37% of the Reading/Education Discrepant group. For the 41 participants in the Reading/Education Discrepant group for whom we had available data, 44% could not correctly write the entire alphabet. They tended to make errors in the last third of the alphabet. We also had information regarding academic problems for 40% of the Reading/Education Discrepant group. In the Reading/Education Discrepant group at least 8% reported learning problems, 10% repeated a grade, and 19% reported behavioral problems. However, it is likely that these values are an underestimate of the actual school-related problems. Finally, the Reading/Education Discrepant group had a significantly lower median income than the Reading/Education Equivalent group [t(140) = 4.03, p < .001].
Table 2.
Demographics for reading groups
| Variable | Reading/Education Equivalent | Reading/Education Discrepant |
|---|---|---|
| N | 88 | 112 |
| Mean age | 44.0 | 44.7 |
| African American (%) | 33 (38%) | 69 (62%)1** |
| Hispanic (%) | 24 (27%) | 24 (21%) |
| Non-Hispanic White (%) | 31 (35%) | 19 (17%) |
| Mean years of education | 13.0 | 11.9** |
| Mean reading-grade level | HS | 6th grade** |
| Median income per zip code (mean) | $38,343 | $27,269** |
Reading/Education Discrepant > Reading/Education Equivalent compared to non-Hispanic Whites.
p < .01.
Figure 1 shows the percentage of impairment (1.5 SDs below mean) in the Reading/Education Discrepant group for neuropsychogical tests normed using education versus reading-grade level. While no participants had education levels lower than the education breakdowns for the published norms we used, 51 participants had reading levels lower than the lower educational level for GP and TMT. We used the lowest educational level, 6–8 years, for these 51 individuals even though they all had reading grade levels <6th grade. Tests for learning and memory, the HVLT and BVMT-R, are not included here because the HVLT has very wide normative education categories (i.e., 8–18 years for ages 17–30, 10–20 for ages 31–54, 6–20 for ages 55–69, and 5–20 for ages 70–88) and the BVMT-R does not use education in its normative calculations.
Fig. 1.
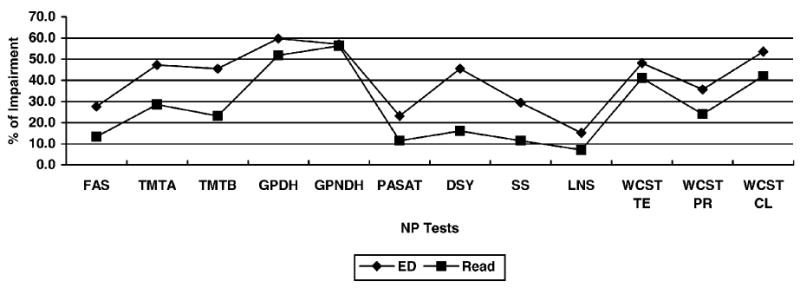
Percentage of impairment in Reading/Education Discrepant Group: Education versus reading-based norms.
Using the two norming methods (education based vs. reading grade) resulted in only a slight difference (1%) in the percentage of impairment in GPNDH. For all other tests, using reading grade level resulted in less impairment for the Reading/Education Discrepant group. Digit Symbol showed the greatest reduction in percentage of impaired participants (Education: 45.5% vs. Reading: 16.1%) followed by TMT-B, TMT-A, Symbol Search, FAS, PASAT, WCST Perseverative Responses, WCST Conceptual Level Responses, Letter Number Sequencing, GPDH, and WCST Total Errors. Differences in impairment rates using education- versus reading-based norms were all significant (all p’s < .001).
Figures 2 and 3 show the percentage of impairment by ethnicity/race in the Reading/Education Discrepant group after applying the two norming procedures. All but one score (WCST Total Errors for non-Hispanic Whites) decreased after norming the battery based on reading grade. For all ethnicities, the largest reduction was in Digit Symbol, which decreased by 41.7% for Hispanics, 27.5% for African Americans, and 21.1% for non-Hispanic Whites after applying norms based on reading grade. Aside from Digit Symbol, African American participants exhibited the greatest decreases in impairment for TMT-B, TMT-A, and Symbol Search, respectively. Hispanic participants had the next greatest reductions in Symbol Search followed by FAS, TMT-B, and PASAT, which all changed by the same percentage (25%). Hispanic participants also had 0% impairment on Letter Number Sequencing using reading-grade norming. For non-Hispanic White participants, the next largest reduction (after Digit Symbol) was in TMT-A, Symbol Search, and WCST Perseverative Errors, which were all equally decreased. African Americans’ and non-Hispanic Whites’ GPNDH score did not exhibit any change after applying norms based on reading level. Letter Number Sequencing was also unchanged for non-Hispanic Whites.
Fig. 2.
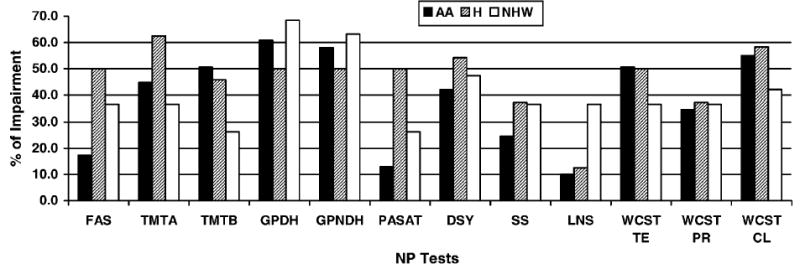
Impairment rates by race/ethnicity in Reading/Education Discrepant Group based on education-based norms.
Fig. 3.
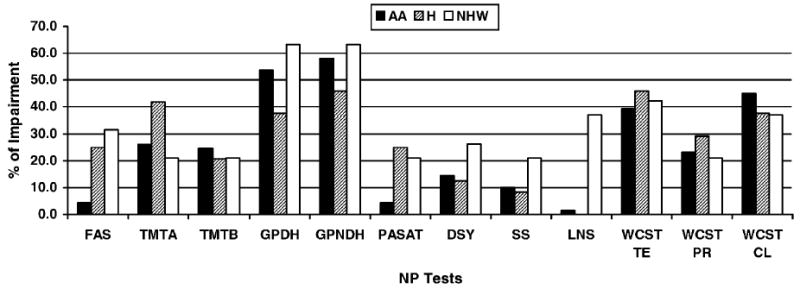
Impairment rates by race/ethnicity in Reading/Education Discrepant Group based on reading-based norms.
Reading Group, Race/Ethnicity, and Neuropsychological Test Performance
To determine the effect of discrepancies in reading and education, and also racial/ethnic status on the neuropsychological domain scores, we compared the test scores among the groups. Given that both African American and Hispanic participants had significantly less education and lower reading levels than non-Hispanic White participants (but not from each other), we combined these groups. A multivariate analysis of variance (MANOVA), testing the effects of reading group and minority status on the neuropsychological domain scores revealed a significant main effect for reading group [F(1,181) = 3.99, p < .001] but not for racial/ethnic minority status or their interaction. As shown in Table 3, the follow-up univariate analyses revealed that all of the domain scores were significantly lower in the Reading/Education Discrepant Group. There was a medium effect size of Reading/Education Group for global neuropsychological functioning, processing speed, working memory, learning, and fluency. The effect size of minority status was small across all the domains.
Table 3.
Effect of reading group on neuropsychological domain score
| Reading/Education Equivalent (N = 85)
|
Reading/Education Discrepant (N = 100)
|
Effect of Reading Group StatusTest
|
Effect Size of Reading/Education Group
|
Effect Size of Minority Status
|
||||
|---|---|---|---|---|---|---|---|---|
| M | SD | M | SD | F | P | ω2 | ω2 | |
| Global | 39.8 | 8.0 | 34.6 | 6.7 | 20.4 | <.001 | .093 | .0003 |
| Motor | 35.1 | 13.0 | 32.6 | 10.2 | 4.6 | .034 | .019 | .01 |
| Processing speed | 41.8 | 8.7 | 36.9 | 7.6 | 16.7 | <.001 | .076 | .01 |
| Working memory | 44.6 | 9.2 | 39.8 | 7.8 | 14.3 | <.001 | .066 | .001 |
| Learning | 35.3 | 11.1 | 29.2 | 9.1 | 14.5 | <.001 | .066 | .01 |
| Memory | 35.7 | 11.9 | 29.5 | 9.3 | 10.6 | <.001 | .048 | .002 |
| Fluency | 48.7 | 11.1 | 42.0 | 10.2 | 14.8 | <.001 | .069 | .001 |
| Abstract/executive functioning | 40.8 | 9.5 | 36.6 | 8.4 | 7.2 | .008 | .031 | .01 |
DISCUSSION
The present study investigated neuropsychological test performance, reading ability, and education levels across racial/ethnic groups in an advanced-HIV cohort and found that not only did African American and Hispanic participants tend to have lower reading scores, but their reading levels were discordant with their years of education. Reading/education discrepancies accounted for lower performance in all of the neuropsychological domains, whereas racial/ethnic minority status did not. Reading/education discrepancies had a stronger relationship with neuropsychological functioning than race/ethnicity, indicating the importance of educational quality in understanding racial/ethnic minorities’ test performance.
This study is the first to investigate the roles of low literacy and race/ethnicity in neuropsychological test performance among an advanced-HIV+ cohort. Given that the epidemic has transited to a greater racial/ethnic minority population, it is essential to identify whether or not differences in neuropsychological test performance are due to HIV or other factors unrelated to the disease process, so as to avoid inappropriate classifications of neuropsychological impairment and resulting erroneous interpretations of an HIV effect. There have been a few reports documenting that HIV+ African Americans obtain lower scores on neuropsychological tests (Manly et al., 1998a; Miller et al., 1997; Richardson et al., 2002). Accounting for acculturation and applying norms developed for African Americans reduced racial/ethnic discrepancies in scores among HIV+ African Americans (Miller et al., 1997; Manly et al., 1998a). Our findings add to these studies by suggesting that educational quality, which can differ by race/ethnicity, may also be a worthwhile explanatory construct in understanding neuropsychological performance among African American and Hispanic HIV+ individuals.
Literacy is an important factor in the assessment and interpretation of cognitive functioning among racial/ethnic minority groups. There is a growing body of literature documenting that African Americans have reading levels below their completed years of education (Baker et al., 1996; Manly et al., 1998a; Albert & Teresi, 1999) and that racial/ethnic differences in cognitive testing are diminished after adjusting for literacy (Manly et al., 2002; Mehta et al., 2004). Results from the National Adult Literacy Survey (NALS) indicate that 21% of adults perform at the lowest level of literacy and that racial/ethnic minorities are over-represented at the lowest literacy levels due to differences in average education level and socioeconomic status (Kirsch et al., 2002). NALS findings reveal that even after controlling for education, differences in literacy among ethnic groups persist. Our results also demonstrate that after accounting for education, significant differences in reading level persisted across the three racial/ethnicity groups. In our study, socioeconomic status (SES), as measured by median income per zip code, did not appreciably account for the relationship between education and reading across different racial/ethnic groups. The weaker relationship between reading and education in African American (r = .53) and Hispanic (r = .58) as opposed to non-Hispanic White (r = .67) participants adds further evidence that these two variables may function differently in African Americans (Manly et al., 2002) and Hispanics. Whether quality of education among African Americans and Hispanics can be better accounted for by measuring psychosocial and cultural factors such as acculturation, parental involvement in school, parental level of education, parental assistance with homework, availability of textbooks and school supplies, involvement in after school activities, and so forth, is a topic for further investigation (Byrd et al., in press).
Fifty percent of the African Americans and Hispanics in the MHBB cohort had reading levels that were less than their years of education. Notably, this proportion is higher than in Manly et al.’s (2002) sample where one-third of African Americans had reading levels lower than their years of education. The MHBB rates of reading/education discrepancy are even more striking when one considers that reading/education discrepancies were defined as within a two-year difference, whereas Manley et al. used the more lenient criterion of a one-year difference. It is also important to note that MHBB participants were much younger (mean age of African American participants was 44.8 years) than a previously examined sample (mean age of African American participants was 73.9 years; Manly et al., 2002). While prior investigators attributed the vast educational discrepancies to the segregated southern school systems in which African American elders were educated, our replication and expansion of this pattern in a younger cohort highlights the continued disparity in the quality of education for racial/ethnic minorities.
The present study is an exploratory investigation of the differential level of impairment using norms based on years of schooling versus reading grade level. Using reading grade as a proxy for years of education significantly lowered the rates of impairment; the percentage of impairment decreased from 0.8% to 29.4% across all tests. While rates of impairment decreased using reading-grade level, it remains uncertain what the actual rate of impairment is or whether using reading-grade level in place of education is a valid method of norming tests. A limitation of this study is the absence of additional indicators of impairment with which to compare our education and reading-grade norms. Similarly, the lack of published norms for individuals with low education levels is also a limitation. While no participants had education levels lower then the lowest education level available in the norms used in this study, 51 participants in the Reading/Education Discrepant group had reading levels lower than the lowest education level available in the norms. Using published norms above these individuals’reading levels may have overestimated impairment in this group and is a limitation of the current study. An additional limitation is the multiple comparisons without correction that we undertook given the exploratory nature of this study.
Further research to investigate the optimal norming procedure to use with racial/ethnic minorities is needed. Our data revealed a differential effect of using reading-based norms across the racial/ethnic groups. For instance, half of Hispanics in the Reading/Education Discrepant group were impaired on FAS using education norms, whereas with reading-grade norms, one quarter were impaired. African Americans had a similar reduction in impairment rate for TMT-B after applying reading-based norms. The recent availability of demographically corrected norms that adjust for race/ethnicity has improved the historic lack of racial/ethnic minority representation in normative studies and is likely to improve the diagnostic accuracy of neuropsychological evaluations. For example, applying norms developed for African Americans reduced the percentage of impairment in HIV+ African American men from 71% to 44%, which was closer to the 38% impairment rate of the study’s non-Hispanic White males (Miller et al., 1997). Whether the best approach is to use racial/ethnic group norms that adjust for education, to use reading-grade-level based norms, to account for acculturation (Ardilia et al., 1989; Helms, 1997; Manly et al., 1998a, 2002; Kennepohl et al., 2004), some combination of these factors, or even some additional variable is uncertain. However, a recent study found that among elder African Americans, educational quality (as measured by reading level) was a more influential predictor of neuropsychological performance than acculturation (Manly et al., 2004).
In our analyses of individual tests using norms based on participant’s reading-grade level, half of the tests we administered, FAS, PASAT, and the WAIS-III subtests (Digit Symbol, Letter Number Sequencing, and Symbol Search) used racial/ethnic corrections. Yet significant differences in impairment levels remained when norms were based on education versus reading-grade level both for these tests as well as those that did not have ethnicity corrections (TMT-A, TMT-B, GPDH, GPNH, and WCST). The range of neuropsychological impairment using education-based norms was lower for non-race/ethnicity adjusted than the race/ethnicity adjusted tests (35.7%–59.8% vs. 15.2%–45.5%). Whereas for tests normed using reading-grade level, the non-race/ethnicity adjusted tests had a range of impairment (23.2%–56.3%) that was higher than for the tests adjusted for race/ethnicity (8.1%–29.4%). This likely reflects the fact that two of the non-ethnicity corrected tests, GP and TMT, did not have educational norms appropriate for our lowest literacy participants.
Among participants with reading levels less than their education (Reading/Education Discrepant group), the magnitude of difference in impairment rates between education versus reading norms was the greatest for Digit Symbol (44.5% vs. 16.1%), which is intuitive given that reading also requires associative learning skills. TMT-B also showed a large difference in impairment rates using the two norming methods (45.54% vs. 23.2%), which suggests that the speeded alphanumeric shifting in TMT-B may be more difficult for individuals with poorer reading skills. Although 37% of Group 3 participants made errors in alphabet writing, their errors tended to be in the last third of the alphabet. Thus, writing the letters “A through J” and knowing the consecutive order as required by TMT-B did not appear to contribute to the differences in TMT-B impairment rates using the two norming methods. However, for these participants, knowledge of the alphabet is likely less automatic and over-learned than in participants who could write the alphabet flawlessly. Future investigation of the relationship between alphabet writing and TMT-B performance is warranted, as is comparing TMT-B performance and the Color Trails Test (D’Elia & Satz, 1996) in individuals with difficulty correctly writing the alphabet and/or low reading scores.
Low education level is a risk factor for neuropsychological impairment in HIV (Satz et al., 1993; Stern et al., 1996; Da Ronchi et al., 2002). Recently, among HIV+ gay and bisexual men IQ has been found to be a superior marker of cognitive reserve compared to education (Farinpour et al., 2003), suggesting that IQ is a better indicator of native cognitive ability. Among racial/ethnic minority elders, literacy (not education) was the most sensitive predictor of memory decline (Manly et al., 2003). Whether literacy is a robust predictor of cognitive reserve in HIV+ racial/ethnic minorities remains to be seen. In our sample with 56% of participants having reading levels lower than their education, it is likely that literacy is a better measure of native ability and a more sensitive marker of cognitive reserve. Longitudinal studies of HIV-related neurocognitive impairment in low literacy individuals would also help increase understanding of the utility of literacy as a marker of cognitive reserve. Also, functional neuroimaging studies of high and low literate HIV+ participants would help determine whether there is differential recruitment of brain networks during cognitive processing, and thus provide in vivo information about literacy’s contribution to cognitive reserve.
Historic inequalities in education for racial/ethnic minorities do not appear to be abating. The National Assessment of Educational Progress reported that by the end of high school, African American and Latino students have math and reading skills that are virtually the same as those of eighth grade White students (U.S. Dept. of Education, 2000). Although the racial/ethnic achievement gap has largely been declining over time, the current gap among high school students is slightly larger than it was in the late 1980s (Grissmer et al., 1998, Hedges & Nowell, 1998; Humphreys 1988). While current policies promote educational access for all, disparate funding continues to foster educational inequality in poor areas including the inner city. School districts educating the highest number of racial/ethnic minority students receive substantially less state and local money per student and 35 out of 48 states studied had a funding gap for racial/ethnic minority students, with the nationwide funding gap equaling $1,099 per pupil (Carey, 2004). A recent study prepared for the National Commission on Teaching and America’s Future (NCTAF), “Fifty Years after Brown v. Board of Education: A Two-Tiered Education System” reported that schools serving predominantly low income and minority students were more likely to have unprepared teachers and insufficient classroom supplies (Carroll et al., 2004). In California, almost half of the teachers (48%) in high-risk schools report that ≥ 20% of their colleagues are not fully credentialed, whereas only 18% of the teachers in low-risk schools report ≥ 20% of their colleagues have incomplete credentials. In New York, 63% of New York City teachers reported classroom computers did not have internet access compared to 36% of teachers in New York City suburbs. Given inequities in the allocation of funding, classroom supplies, and teacher certification, racial/ethnic minorities may continue to receive a poorer quality of education. Recent analyses from the Early Childhood Longitudinal Study Kindergarten Class of 1998–99 (ECLS-K) found much smaller gaps in the Black–White test scores suggesting that African Americans have made real gains relative to non-Hispanic Whites in the past few decades (Fryer & Levitt, 2004). Nevertheless, presumptions about the expected level of neuropsychological performance for a given education level among urban educated African Americans and Hispanics may be erroneous. Our data suggest that when working with racial/ethnic minority individuals who have less than a high school education, it would be prudent to assess their reading level, as educational quality may affect their neuropsychological test performance.
Refining neuropsychological assessment techniques are especially important in HIV/AIDS, a disease that disproportionately affects African Americans and Hispanics; African Americans comprise 42% of persons living with AIDS and Hispanics comprise 20% (CDC, 2003). Diagnosis of HIV-related cognitive impairment will require an unprecedented understanding of the interplay of sociocultural factors and brain pathology. Our findings raise concerns about diagnostic specificity among HIV+ individuals with low literacy and indicate the need to examine educational quality and its contribution to risk and resilience of HIV-related cognitive impairment in racial/ethnic minorities.
Acknowledgments
The authors thank the participants and staff of the Manhattan HIV Brain Bank (MHBB). This research is supported by federal grants R24MH59724 (to SM) and the Clinical Research Center of the Mount Sinai School of Medicine (M01-RR-00071).
APPENDIX
Neuropsychological Domains
| Domain | Tests | Norms |
|---|---|---|
| Global | Mean t score of all tests | As indicated below |
| Motor | GPDH, GPNDH | Heaton et al., 1991 |
| Processing speed | TMT-A | Heaton et al., 1991 |
| WAIS-III Digit Symbol | Wechsler, 1997 | |
| WAIS-III Symbol Search | ||
| Working memory | WAIS-III Letter Number Sequencing | Wechsler, 1997 |
| PASAT | Diehr et al., 2003 | |
| Learning | BVMT Total Recall | Benedict et al., 1997, 1998 |
| HVLT Total Recall | ||
| Memory | BVMT Delayed Recall | Benedict et al., 1997, 1998 |
| HVLT Delayed Recall | ||
| Fluency | FAS | Gladsjo et al., 1999 |
| Abstract/executive functioning | TMT-B | Heaton et al., 1991 |
| WCST Perseverative Responses | Kongs et al., 2000 |
References
- Adams RL, Boake C, Crain C. Bias in a neuropsychological test classification related to age, education and ethnicity. Journal of Consulting and Clinical Psychology. 1982;50:143–145. doi: 10.1037//0022-006x.50.1.143. [DOI] [PubMed] [Google Scholar]
- Albert S, Teresi J. Reading ability, education, and cognitive status assessment among older adults in Harlem, New York City. American Journal of Public Health. 1999;89:95–97. doi: 10.2105/ajph.89.1.95. [DOI] [PMC free article] [PubMed] [Google Scholar]
- Ardilia A, Rosselli M, Rosas P. Neuropsychological assessment in illiterates: Visuospatial and memory abilities. Brain Cognition. 1989;11:147–166. doi: 10.1016/0278-2626(89)90015-8. [DOI] [PubMed] [Google Scholar]
- Baker FM, Johnson JT, Velli SA, Wiley C. Congruence between education and reading levels of older persons. Psychiatric Services. 1996;47:194–196. doi: 10.1176/ps.47.2.194. [DOI] [PubMed] [Google Scholar]
- Benedict, R.H. (1997). Brief Visuospatial Memory Test–Revised. Odessa, FL: Psychological Assessment Resources.
- Benedict RH, Schretlen D, Groninger L, Brandt J. Hopkins Verbal Learning Test–Revised: Normative data and analysis of inter-form and test-retest reliability. The Clinical Neuropsychologist. 1998;12:43–55. [Google Scholar]
- Byrd, D., Miller, S., Reilly, J., Weber, S., Wall, T., & Heaton, R. (in press). Early environmental factors, ethnicity, and adult cognitive test performance. The Clinical Neuropsychologist. [DOI] [PubMed]
- Carey K. The Funding Gap 2004: Many states still short-change low-income and minority students. The Education Trust. 2004;2004:1–17. [Google Scholar]
- Carroll, T., Fulton, K., Abercrombie, K., & Yoon, I. (2004). Fifty years after Brown v. Board of Education: A two-tiered education system. The National Commission on Teaching and America’s Future. Washington, DC (202-429-2570). The report is available online at www.nctaf.org/documents/nctaf/Brown%5fFull%5fReport%5fFinal.pdf
- Centers for Disease Control and Prevention. HIV/AIDS Surveillance Report, 2003 (Vol. 15). Atlanta, GA: U.S. Department of Health and Human Services, Centers for Disease Control and Prevention, 2004, 1–46.
- Da Ronchi D, Faranca I, Berardi D, Scudellari P, Borderi M, Manfredi R, Fratiglioni L. Risk factors for cognitive impairment in HIV-1-infected persons with different risk behaviors. Archives of Neurology. 2002;59:812–818. doi: 10.1001/archneur.59.5.812. [DOI] [PubMed] [Google Scholar]
- D’Elia, L. & Satz, P. (1996). Color Trails Test. Odessa, FL: Psychological Assessment Resources.
- Diehr MC, Cherner M, Wolfson TJ, Miller SW, Grant I, Heaton RK the HIV Neurobehavioral Research Center Group. The 50- and 100-item short forms of Paced Auditory Serial Addition Task (PASAT): Demographically corrected norms and comparisons with the full PASAT in normal and clinical samples. Journal of Clinical Experimental Neuropsychology. 2003;25:571–585. doi: 10.1076/jcen.25.4.571.13876. [DOI] [PubMed] [Google Scholar]
- Farinpour R, Miller EN, Satz P, Selnes OA, Cohen BA, Becker JT, Skolasky RL, Visscher BR. Psychosocial risk factors of HIV morbidity and mortality: Findings from the MACS. Journal of Clinical Experimental Neuropsychology. 2003;25:654–670. doi: 10.1076/jcen.25.5.654.14577. [DOI] [PubMed] [Google Scholar]
- Fryer RG, Levitt SD. Understanding the Black-White test score gap in the first two years of school. Review of Economics and Statistics. 2004;86:447–467. [Google Scholar]
- Gladsjo JA, Schuman CC, Evans JD, Peavy GM, Miller SW, Heaton RK. Norms for letter and category fluency: Demographic corrections for age, education, and ethnicity. Assessment. 1999;6:147–178. doi: 10.1177/107319119900600204. [DOI] [PubMed] [Google Scholar]
- Grissmer, D., Flanagan, A., & Williamson, S. (1998). Why did the Black-White score gap narrow in the 1970’s and 1980’s? In C. Jencks & M. Phillips (Eds.), The Black-White test score gap (pp. 182–228). Washington, DC: The Brookings Institute.
- Heaton, R.K., Taylor, M., & Manly, J. (2001). Demographic effects and demographically corrected norms with the WAIS-III and WMS-III. In D. Tulsky, R.K. Heaton, G.J. Chelune, I. Ivnik, R.A. Bornstein, A. Prifitera, & M. Ledbetter (Eds.), Clinical interpretations of the WAIS-III and WMS-III (pp. 181–210). San Diego, CA: Academic Press.
- Heaton, R., Grant, I., & Matthews, C.G. (1991). Comprehensive norms for an expanded Halstead-Reitan Battery: Demographic corrections, research findings, and clinical applications. Odessa, FL: Psychological Assessment Resources.
- Hedges, L. & Nowell, A. (1998). Black-White test score convergence since 1965. In C. Jencks & M. Phillips (Eds.), The Black-White test score gap (pp. 149–181). Washington, DC: The Brookings Institute.
- Hedges LV, Laine RD, Greenwald R. Does money matter? A meta-analysis of studies of differential school inputs on student outcomes. Educational Researcher. 1994;23:5–14. [Google Scholar]
- Helms, J.E. (1997). The triple quandary of race, culture, and social class in standardized cognitive ability testing. In D.P. Flanagan, J.L. Genshaft, & P.L. Harrison (Eds.), Contemporary intellectual assessment: Theories, tests, and issues (pp. 517–532). New York: Guilford Press.
- Helms J, Jernigan M, Mascher J. The meaning of race in psychology and how to change it: A methodological perspective. American Psychologist. 2005;60:27–36. doi: 10.1037/0003-066X.60.1.27. [DOI] [PubMed] [Google Scholar]
- Humphreys L. Trends in the level of academic achievement of blacks and other minorities. Intelligence. 1988;12:231–260. [Google Scholar]
- Jacobs DM, Sano M, Albert S, Schofield P, Dooneief G, Stern Y. Cross-cultural neuropsychological assessment: A comparison of randomly selected, demographically matched cohorts of English- and Spanish-speaking older adults. Journal of Clinical and Experimental Neuropsychology. 1997;19:331–339. doi: 10.1080/01688639708403862. [DOI] [PubMed] [Google Scholar]
- Kennepohl K, Douglas S, Nabors N, Hanks R. African American acculturation and neuropsychological test performance following traumatic brain injury. Journal of the International Neuropsychological Society. 2004;10:566–577. doi: 10.1017/S1355617704104128. [DOI] [PubMed] [Google Scholar]
- Kirsch, I.S., Jungeblut, A., Jenkins, L., & Kolstad, A. (2002). Adult literacy in America: A first look at the findings of the National Adult Literacy Survey. Washington, DC: U.S. Department of Education.
- Kongs, S.K., Thompson, L.L., Iverson, G.L., & Heaton, R.K. (2000). Wisconsin Card Sorting Test–64 Card computerized version. Odessa, FL: Psychological Assessment Resources.
- Lucas J, Ivnik R, Smith G, Bohac D, Tangalos E, Graff-Radford N, Petersen R. Mayo’s older Americans normative studies: Category fluency norms. Journal of Clinical and Experimental Neuropsychology. 1998;20:194–200. doi: 10.1076/jcen.20.2.194.1173. [DOI] [PubMed] [Google Scholar]
- Manly JJ. Acculturation, reading level, and neuropsychological test performance among African American elders. Applied Neuropsychology. 2004;11:37–46. doi: 10.1207/s15324826an1101_5. [DOI] [PubMed] [Google Scholar]
- Manly JJ. Advantages and disadvantages of separate norms for African Americans. The Clinical Neuropsychologist. 2005;19:270–275. doi: 10.1080/13854040590945346. [DOI] [PubMed] [Google Scholar]
- Manly JJ, Jacobs DM, Sano M, Bell K, Merchant CA, Small SA, Stern Y. African American acculturation and neuropsychological test performance among nondemented community elders. Journal of the International Neuropsychological Society. 1998a;4:77. doi: 10.1017/s135561779953302x. [DOI] [PubMed] [Google Scholar]
- Manly JJ, Jacobs DM, Sano M, Bell K, Merchant CA, Small SA, Stern Y. Cognitive test performance among nondemented elderly African Americans and Whites. Neurology. 1998b;50:1238–1245. doi: 10.1212/wnl.50.5.1238. [DOI] [PubMed] [Google Scholar]
- Manly JJ, Jacobs DM, Touradji P, Small SA, Stern Y. Reading level attenuates differences in neuropsychological test performance between African American and White elders. Journal of the International Neuropsychological Society. 2002;8:341–348. doi: 10.1017/s1355617702813157. [DOI] [PubMed] [Google Scholar]
- Manly JJ, Touradji P, Tang MX, Stern Y. Literacy and memory decline among ethnically diverse elders. Journal of Clinical and Experimental Neuropsychology. 2003;5:680–690. doi: 10.1076/jcen.25.5.680.14579. [DOI] [PubMed] [Google Scholar]
- Mason K, Campbell A, Hawkins P, Madhere S, Johnson K, Takushi-Chinen R. Neuropsychological functioning in HIV-positive African-American women with a history of drug use. Journal of the National Medical Association. 1998;90:665–674. [PMC free article] [PubMed] [Google Scholar]
- Mehta KM, Simonsick EM, Rooks R, Newman AB, Pope SK, Rubin SM, Yaffe K. Black and white differences in cognitive function test scores: What explains the difference? Journal of the American Geriatric Society. 2004;52:2120–2127. doi: 10.1111/j.1532-5415.2004.52575.x. [DOI] [PMC free article] [PubMed] [Google Scholar]
- Miller EN, Bing EG, Selnes OA, Wesch J, Becker JT. The effects of sociodemographic factors on reaction time and speed of information processing [abstract] Journal of Clinical and Experimental Neuropsychology. 1993;15:66. [Google Scholar]
- Miller S, Heaton R, Kirson D, Grant I. Neuropsychological (NP) assessment of African Americans [abstract] Journal of the International Neuropsychological Society. 1997;3:49. [Google Scholar]
- Norman MA, Evans JD, Miller SW, Heaton RK. Demographically corrected norms for the California Verbal Learning Test. Journal of Clinical and Experimental Neuropsychology. 2000;22:80–94. doi: 10.1076/1380-3395(200002)22:1;1-8;FT080. [DOI] [PubMed] [Google Scholar]
- Patton D, Duff K, Schoenberg M, Mold J, Scott J, Adams R. Performance of cognitively normal African Americans on the RBANS in community dwelling older adults. The Clinical Neuropsychologist. 2003;17:515–530. doi: 10.1076/clin.17.4.515.27948. [DOI] [PubMed] [Google Scholar]
- Richardson JL, Martin E, Jimenez N, Danley K, Cohen M, Carson V, Sinclair B, Racenstein J, Reed R, Levine A. Neuropsychological functioning in a cohort of HIV infected women: Importance of antiretroviral therapy. Journal of the International Neuropsychological Society. 2002;8:781–793. doi: 10.1017/s1355617702860064. [DOI] [PubMed] [Google Scholar]
- Satz P, Morgenstern H, Miller EN, Selnes OA, McArthur JC, Cohen BA, Wesch J, Becker JT, Jacobson L, D’Elia LF. Low education as a possible risk factor for cognitive abnormalities in HIV-1: Findings from the Multicenter AIDS Cohort Study (MACS) Acquired Immune Deficiency Syndrome. 1993;6(5):503–511. [PubMed] [Google Scholar]
- Stern RA, Silva G, Chaisson N, Evans L. Influence of cognitive reserve on neuropsychological functioning in asymptomatic human immunodeficiency virus-1 infection. Archives of Neurology. 1996;53:148–153. doi: 10.1001/archneur.1996.00550020052015. [DOI] [PubMed] [Google Scholar]
- Stern Y, Andrews H, Pittman J, Sano M, Tatemichi T, Lantigua R, Mayeux R. Diagnosis of dementia of in a heterogeneous population. Development of a neuropsychological paradigm-based diagnosis of dementia and quantified correction for the effects of education. Archives of Neurology. 1992;49:453–460. doi: 10.1001/archneur.1992.00530290035009. [DOI] [PubMed] [Google Scholar]
- Tang MX, Cross P, Andrews H, Jacobs DM, Small S, Bell K, Merchant C, Lantigua R, Costa R, Stern Y, Mayeux R. Incidence of AD in African-Americans, Caribbean Hispanics, and Caucasians in northern Manhattan. Neurology. 2001;56:49–56. doi: 10.1212/wnl.56.1.49. [DOI] [PubMed] [Google Scholar]
- Tulsky, D. & Price, L. (2003). Cross-validation of the joint factor structure of the WAIS-III and WMS-III: Examination of the structure by ethnic and age groups. In D. Tulsky, D. Saklofske, R.K. Heaton, G. Chelune, R. Ivnik, R.A. Bornstein, A. Prifitera, & M. Ledbetter (Eds.), Clinical interpretation of the WAIS-III and WMS-III. San Diego, CA: Academic Press.
- U.S. Department of Education. (2000). NEAP 1999 trends in academic progress: Three decades of student performance (NCES 2000-439). Washington, DC: Office of Educational Research and Improvement, National Center for Education Statistics.
- Wechsler, D. (1997). Wechsler Adult Intelligence Scale–Third edition: Administration and scoring manual. San Antonio, TX: Harcourt Brace.
- Welsh KA, Fillenbaum G, Wilkinson W, Heyman A, Mohs RC, Stern Y, Harrell L, Edland SD, Beekly D. Neuropsychological test performance in African-American and white patients with Alzheimer’s disease. Neurology. 1995;45:2207–2211. doi: 10.1212/wnl.45.12.2207. [DOI] [PubMed] [Google Scholar]
- Wilkinson, G. (1993). Wide Range Achievement Test (3rd ed.) administration manual. Wilmington, DE: Wide Range Inc.
- Woods SP, Rippeth JD, Frol AB, Levy JK, Ryan E, Soukup VM, Hinkin CH, Lazzaretto D, Cherner M, Marcotte TD, Gelman BB, Morgello S, Singer EJ, Grant I, Heaton RK. Interrater reliability of clinical ratings and neurocognitive diagnoses in HIV. Journal of Clinical and Experimental Neuropsychology. 2004;26:759–778. doi: 10.1080/13803390490509565. [DOI] [PubMed] [Google Scholar]