

Abstract
Exonic splicing enhancers (ESEs) are sequences that facilitate recognition of splice sites and prevent exon-skipping. Because ESEs are often embedded within proteincoding sequences, alterations in them can also often be interpreted as nonsense, missense or silent mutations. To correctly interpret exonic mutations and their roles in disease, it is important to develop strategies that identify ESE mutations. Potential ESEs can be found computationally in many exons but it has proven difficult to predict if a given mutation will have effects on splicing based on sequence alone. Here we describe a flexible in vitro method that can be used to functionally compare the effects of multiple sequence variants on ESE activity in a single in vitro splicing reaction. We have applied this method in parallel with conventional splicing assays to test for a splicing enhancer in exon 17 of the human MLH1 gene. Point mutations associated with hereditary nonpolyposis colorectal cancer (HNPCC) have previously been found to correlate with exon-skipping in both lymphocytes and tumors from patients. We show that sequences from this exon can replace an ESE from the mouse IgM gene to support RNA splicing in HeLa nuclear extracts. ESE activity was reduced by HNPCC point mutations in codon 659 indicating that their primary effect is on splicing. Surprisingly the strongest enhancer function mapped to a different region of the exon upstream of this codon. Together our results indicate that HNPCC point mutations in codon 659 affect an auxillary element that augments the enhancer function to ensure exon inclusion.
INTRODUCTION
The splicing of pre-mRNAs depends on the presence of a number of cis-acting RNA sequences important for the recognition of splice sites. In addition to canonical sequence elements adjacent to splice junctions (the 5′ splice site, branchpoint, polypyrimidine tract, 3′ splice site), more distant elements including both exonic splicing enhancers (ESEs) and exonic splicing silencers (ESSs) are required in many RNAs for correct splicing (1, 2). Although ESEs were first recognized for their importance in developmentally regulated alternate splicing, subsequent studies have shown them to be perhaps more common in constitutively spliced exons (3–6). Disruption of ESEs can lead to the utilization of alternative or cryptic splice sites, but most often results in the simple “skipping” of an exon from the processed mRNA. A number of mutations that disrupt specific ESEs have now been associated with human disease (7–13). However, the fact that ESEs are often embedded within protein coding sequences often leads to incorrect assumptions about the primary effect of point mutations within these sequences. ESE mutations are often initially interpreted based on the nominal change in the affected amino acid (i.e. as a missense mutation). Particularly striking are cases where mutations classified as “silent” occur in ESEs (14, 15). These mutations appear innocuous, resulting in a codon synonymous to the original one with respect to the encoded amino acid and therefore can easily be mistaken for an unimportant polymorphism associated with the disease allele. Because aberrant splicing results in different (and often more severe) effects on encoded proteins, it is important to develop approaches for discriminating which mutations affect ESEs and other splicing elements that reside in exons. In addition, knowledge that a disease-causing mutation exerts its primary effect at the level of splicing, opens up the possibility of developing alternate treatment strategies targeted at splicing factors and redirecting the selection of splice sites (16–20).
The properties of ESEs and ESSs have been well studied. A number distinct sequences with these activities have been defined and in most cases serve as binding sites for members of SR superfamily of proteins which function as splicing activators (21). Upon binding an ESE SR proteins promote the assembly of pre-spliceosomal complexes on splicing signals in the nearby introns (22–26). In at least some cases SR proteins antagonize binding of inhibiting factors that interact through exonic splicing silencer (ESS) sequences (27, 28).
Computational approaches have been developed to predict the locations of ESEs based on sequence information (4, 5, 29, 30). This has made it possible to identify exonic mutations that might disrupt splicing, and in a number of cases such analysis has led to studies associating nonsense, missense and silent mutations with observed splicing defects (8, 12, 13). However not all factors influencing whether a given sequence will act as an ESE are known. In addition, mutations in some ESEs have little effect because of redundant ESE functions in the same exon. To identify required ESEs with certainty functional assays that test the effects of mutations on splicing efficiency in the context of the neighboring exon sequences must be used.
Here we describe an in vitro method (COMPARE) for simultaneous comparison of the splicing enhancer function of exonic sequence variants. In this assay both mutant and wild type sequences are tested in the same reaction mixture allowing even subtle effects of point mutations on splicing efficiency to be reproducibly distinguished. The method is flexible and can be combined with linker scanning mutagenesis to simultaneously test multiple mutations and to survey exons for functional ESE and ESS sequences. We applied COMPARE to search for splicing enhancers in the human MLH1 gene. A previous study on patients with familial HNPCC-associated nonsense and missense point mutations in codon 659 of this gene found a pronounced increase in transcripts that omit exon 17 (31). This suggests that such mutations alter splicing signals in this exon or differentially affect the stability of RNA containing it. Our in vitro analysis shows that exon 17 contains a strong splicing enhancer activity that can substitute for an established ESE from mouse IgM RNA. Using the COMPARE method we mapped sequences required for the exon 17 ESE function and determined that an HNPCC-associated nonsense mutation in codon 659 decreases the splicing enhancer activity of the exon in vitro.
RESULTS
The COMPARE strategy
Shown in Figure 1 is the strategy for our Comparative Assay for Regulatory Elements (COMPARE). The critical feature of this approach is that a small population of RNAs with mutations are pooled and allowed to undergo splicing competitively in a single in vitro reaction. The pool of RNA products and precursors are amplified together by RT-PCR, and subjected to hot-stop PCR labeling (32) to eliminate heteroduplexes. The amplified DNA products deriving from spliced and unspliced RNAs are then isolated and labeled by a final round of linear amplification using a primer in the 3′ exon via the Hot- Stop approach (32) which eliminates heteroduplexes that would otherwise complicate later analysis. Each sequence variant produces a labeled Bst X1 restriction fragment of different size that derives from the 3′ exon. Because these labeled fragments do not span the intron junction, predictable bands corresponding to each variant from spliced and unspliced RNA comigrate and can be compared side-by-side to determine splicing efficiency (measured as the ratio of product deriving from the spliced and unspliced pools).
Figure 1. COMPARE strategy.
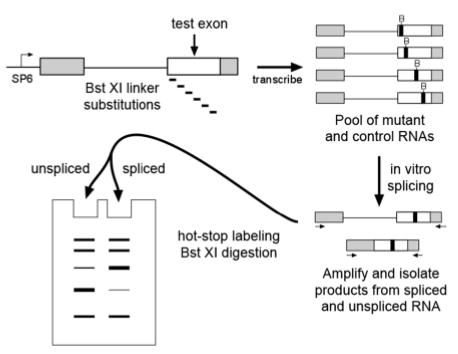
A schematic diagram of the major steps in the COMPARE strategy is shown. Exon sequences to be tested (white box) are inserted into a plasmid containing sequences of an enhancer-dependent RNA splicing substrate (grey boxes). The original test sequence and variants thereof are transcribed with a bacteriophage RNA polymerase (SP6) in vitro to produce a pool of splicing substrates. Represented in the upper part of the diagram is the production of labeled RNA substrates with various Bst XI linker substitution mutations (black boxes). The entire pool of RNA is subjected to in vitro splicing and RT-PCR amplification with primers on either side of the intron. Products corresponding to unspliced and spliced RNA are isolated and separately labeled with 32P-dNTPs by linear amplification (“hot-stop labeling”) then digested with Bst X1 or another diagnostic restriction enzyme. Fragments of different lengths represent each sequence variant in the original RNA population. The relative representation of these variants in the spliced and unspliced RNA populations can be compared side-by-side after gel electrophoresis. Sequences disrupting ESEs will be underrepresented in the spliced product lane and overrepresented in the unspliced lane.
COMPARE analysis of MLH1 exon 17
We first applied the COMPARE approach to the mapping of a suspected ESE located in exon 17 of the human MLH1 gene. To determine whether this 93 nt exon contains an ESE we substituted its central 88 nt in place of a 90 nt region from the mouse IgM gene. This region of the IgM gene contains a well-studied ESE required for splicing of the upstream IgM intron (33). As shown in Figure 2, the insertion of MLH1 exon 17 sequences (μM-MLH1) stimulated splicing to levels significantly higher than that of an RNA substrate without the MLH1 insertion (μMΔ). Splicing levels were comparable but slightly less than that obtained with an analogous IgM substrate that contains the native IgM ESE (μM1+2). Insertion of the same sequences in the reverse orientation did not stimulate splicing (data not shown) indicating that the effect is not due to a change in the linear spacing of RNA sequences in the parent construct.
Figure 2. MLH1 exon 17 contains a splicing enhancer.
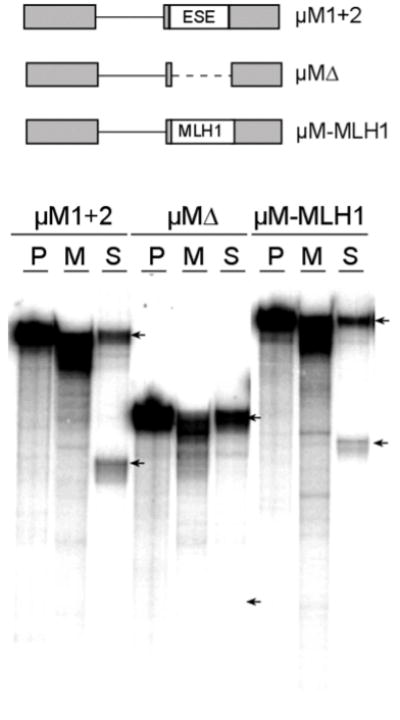
In the top part of the figure a schematic diagram shows splicing substrates used to test whether MLH1 exon 17 contains a splicing enhancer. Splicing substrates from the mouse IgM gene with its native ESE (μM 1+2), a deletion of the ESE (μMΔ), and a substitution of 88 nt from the exon 17 (μM-MLH1) are represented. In vitro splicing assays carried out in HeLa nuclear extracts are shown below the diagram. In each set of reactions the positions of the larger unspliced and smaller spliced RNAs are indicated by arrows. Three lanes are shown for each substrate. From left to right these are untreated precursor RNA (P), a mock reaction with extract but no ATP (M) and a splicing reaction with ATP (S). Note that the μMΔ substrate which lacks an ESE is not detectably spliced but that μM-MLH1 is spliced at a level similar to μM 1+2.
To determine if COMPARE could be used to map sequences responsible for ESE activity we produced a series of 23 nt linker substitution mutations (designated S1 to S4) in which Bst X1 sites were introduced in place of various MLH1 exon sequences (Figure 3A). In addition to these substitutions an RNA substrate (C2) in which a single base alteration generates a Bst X1 site after the 3′ end of the MLH1 insert was also produced and included as an internal control. In independent assays this control substrate was found to splice with the same efficiency as the wild type μM-MLH1 substrate (C1) (see Figure 4). Assays performed on a substrate in which the 23 nt linker alone was inserted in place of the IgM ESE demonstrated that it does not detectably enhance splicing (data not shown). As illustrated in Figure 3B, four different linker substitutions and the control RNAs were transcribed, pooled and subjected to COMPARE analysis using Bst X1 for the final restriction digest (see Methods for details). Two different approaches were used in the experiment shown. In one set of assays (DNA mix) the plasmids encoding the mutant and control RNA substrates were pooled and transcribed together followed by RNA splicing. In a parallel set of assays (RNA mix) each plasmid was transcribed separately and then equal amounts of the labeled RNA substrates were pooled and subjected to splicing reactions. The former method is simpler and produces consistent results, however differences in the efficiency of transcription within the pooled DNA led to low levels of control products (C2) (Figure 3B).
Figure 3. Linker substitution scanning for the exon 17 splicing enhancer.
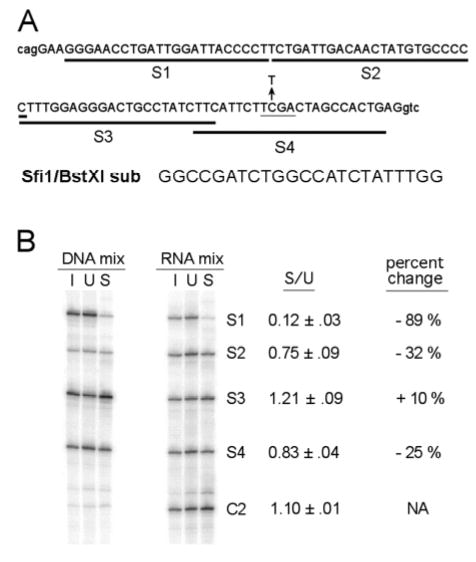
A series of 23 nt Bst X1 linker substitutions were used to scan exon 17 for splicing enhancer sequences. (A) The position of each substitution is indicated by the dark line under the exon 17 sequences. Capital letters indicate the exon 17 sequences and lower case letters indicate the flanking intron sequences of MLH1. The Bst XI substitution sequences used is in all four substitutions are also shown below the exon. The C>T mutation indicated with the arrow is associated with HNPCC and occurs in codon 659. This mutation disrupts a Taq I site (grey underline) (B) COMPARE analysis of the Bst X1 substitutions and control RNA. Two parallel assays are shown in the first set mutant and control substrates were pooled before transcription (DNA mix) in the second equal levels of transcript were pooled (RNA mix). The reactions compared in each set are Bst X1 restriction digests on hot stop labeled DNA from the original pooled DNA or RNA (I), from unspliced product (U) or spliced product (S). The mean spliced/unspliced ratio (S/U) of signals is shown for each substitution and for the control with standard errors. Percent changes in relation to the C2 control are also shown.
Figure 4. Conventional in vitro splicing assays carried out on the same μM-MLH1 substitutions and control RNAs that were used for COMPARE analysis.
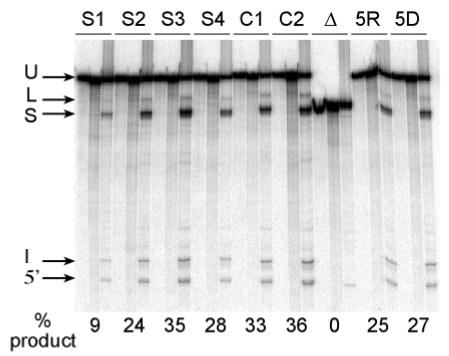
Bands indicated are unspliced precursor (U), lariat intermediate (L), spliced product (S), excised intron (I), and 5’ exon intermediate (5’). For each substrate the three lanes correspond to unspliced precursor, and reactions without and with ATP as in Figure 2. In addition to substitutions S1-S4 reactions are shown for control μM-MLH1 substrates both without (C1) and with (C2) an inserted Bst X1 site at the 3’ MLH1/IgM border, the μMΔ. substrate (Δ), the “RNA mix” substrate pool (5R) and the “DNA mix” substrate pool (5D). The percent of spliced product generated is given below each RNA tested.
In both sets of assays spliced products obtained from processing of the S1 substitution (affecting nt 4–26 of exon 17) were significantly underrepresented. The spliced to unspliced ratio (S/U) was reduced by 89% relative to the C2 control. Substitutions S2 (nt 28–50) and S4 (nt 69–91) caused reductions in S/U ratio of 32% and 25% respectively , while substitution S3 (nt 50–72) caused a slight increase in splicing efficiency (10%) relative to the control RNA. Control experiments on IgM substrates with mutations that have no known effect on RNA splicing show that the experimental variation between S/U ratios within COMPARE assays is usually small and averages around 5% in replicates (see Table 1). Thus the larger reductions in S/U ratio caused by the S1, S2 and S4 substitutions indicate that each of these sequences participate in the activation of splicing while the increase in this ratio caused by the S3 substitution indicates the possible presence of a splicing silencer in the sequences it affects.
Table 1.
Percent differences in S/U ratio observed between pairs of control transcripts in the same COMPARE experiments*
| wild type vs μM-ES2 | wild type vs μM-ES4 | |
|---|---|---|
| Experiment 1 | 3.0% | 6.7% |
| Experiment 2 | 2.3% | 0.6% |
| Experiment 3 | 6.3% | 8.5% |
| Mean | 3.9% | 5.3% |
The control transcripts used are μM1+2 (wild type), and two transcripts with substitutions in the M2 exon located outside the required enhancer. Neither substitution caused significant effects on splicing levels in our conventional in vitro assays. μM-ES2 is a substitution of nucleotides 61 to 73 of the M2 exon and μMES4 is a substitution of nucleotides 118 to 131.
To determine if the results obtained by COMPARE were similar to those that would be obtained by testing the same mutations in conventional assays we carried out individual in vitro splicing reactions in parallel to these experiments (Figure 4). Quantitation of these assays gave results similar to COMPARE for all 4 substitutions.. Substitution S1 again had the most pronounced effect with only 9% splicing as compared to the controls (C1 and C2) which gave 33 or 36% splicing. We conclude that COMPARE can be reliably used to detect differences in relative splicing efficiencies of multiple substrates.
Splicing enhancer and silencer elements within exon 17
To further define sequences that are necessary and/or sufficient for enhancer function we tested the splicing efficiency of a series of fragments from exon 17 for their ability to activate splicing (Figure 5). This analysis confirmed that nt 4–26 of exon 17 (corresponding to substitution S1), were necessary for full enhancer activity Figure 5, d6). However this region alone was not sufficient to activate splicing (Figure 5, d1) suggesting that the enhancer includes other elements. When downstream sequences were added splicing was gradually increased (Figure 5 d2 and d3). A fragment extending from nt 4–57 was found to confer full enhancer activity (Figure 5, compare d4 to wt). Also consistent with this idea deletion the reduction in splicing observed with the deletion of nt 4–26 became more severe when downstream sequences were removed. (Figure 5, compare d6 to d7 and d8).
Figure 5. Deletion mapping of ESE sequences in exon 17.
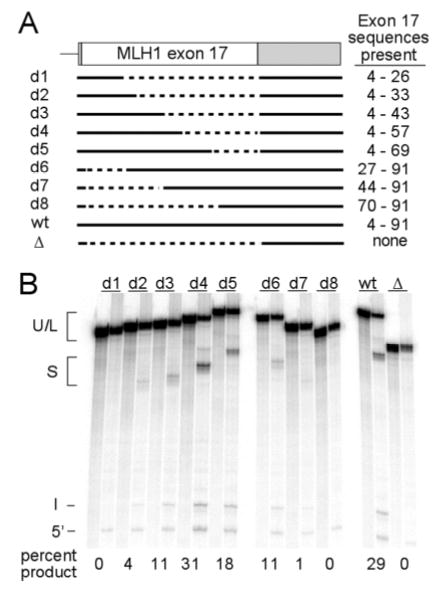
A series of deletions were generated from the μM-MLH1 plasmid and used to produce splicing substrates with exon sequences as shown in the top part of the figure. Solid lines indicate the sequences present. Dashed line indicates deleted sequences. Products from conventional in vitro splicing reactions are shown below the schematic. For each substrate two lanes are shown. In each pair the right lane is a reaction without ATP, the left lane is a reaction carried out with ATP. Percent of spliced product is indicated below the gel. On this gel lariat intermediates run just below unspliced precursor (U+L). The mobilities of spliced product (S), excised intron (I) and 5’ exon intermediate (5’) are also indicated.
The above findings identify the 5′ half of the exon as containing the primary enhancer function. However, point mutations observed in HNPCC patients with effects on exon 17 splicing are located near the 3′ end of the exon in codon 659 (corresponding to nt 79–81 of exon 17). Deletion of nt 70–91 of the inserted exon resulted in a reduction in splicing relative to the wild type control (Figure 5, compare d5 with wt). But this same segment was not sufficient to activate splicing (Figure 5, d8). This suggests that the 3′ end of the exon contains auxillary elements that facilitate enhancer function. It is worth noting here that deletion of a more extensive region from the 3′ end of the exon results in normal levels of splicing (Figure 5, compare d4 to d5). This is consistent with the increase in splicing levels observed with the S3 substitution in COMPARE experiments and suggests that part of a negative element is present in the region between nt 58 and 68. Taken together the above results are consistent with the previous substitution experiments and indicate the presence of multiple elements in exon 17 that influence splicing efficiency.
COMPARE analysis of a point mutation associated with HNPCC
Previous studies on HNPCC families identified 3 different types of point mutations in codon 659 near the 3′ end of exon 17 associated with exon skipping (31). In conventional in vitro splicing assays using μM-MLH1 fusions, we observed that exons containing either of two of these mutations (659 C>T or ΔCG) activated splicing less effectively than did wild type exon sequences (Figure 6A). A C>T mutation generating a nonsense codon (CGA > TGA) produced 20% RNA product as compared to wild type which produced 34% in a parallel reaction. A two nucleotide deletion in the exon (ΔCG) reduced splicing to 14% in the same experiment. Parallel assays on disease associated mutations that were not linked with effects on splicing in patients (codons 634 ΔG, 653 T>G or 654 C>T) revealed no significant effects on enhancer function. Given the potential for sample-to-sample variation in these experiments, we wished to test whether the COMPARE approach could be used to reliably detect the modest differences observed in codon 659 mutants. To do this we took advantage of the fact the nonsense mutation in this codon (CGA>TGA) also disrupts an overlapping Taq I restriction site (Figure 6B). COMPARE was carried out in duplicate on an equimolar mixture of μM-MLH1 substrates with wild type and nonsense sequences at this codon. As shown in Figure 6B spliced product with the mutant sequences had an average S/U ratio that was reduced by 29% relative to the wild type internal control. These results show that the COMPARE method can be used to detect even small differences in splicing efficiency and support the idea that this point mutation affects the exon’s splicing enhancer function.
Figure 6. Analysis of HNPCC associated exon 17 point mutations.
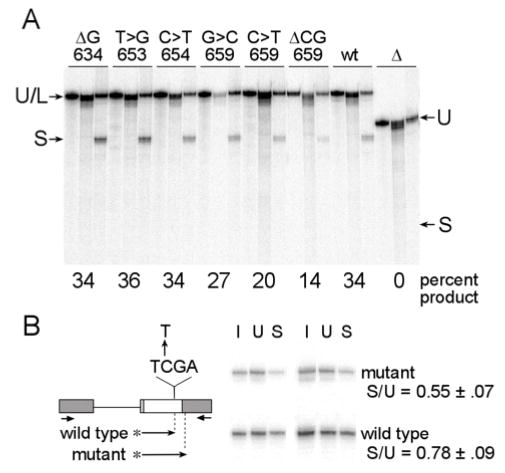
Splicing assays testing the effects of HNPCC mutations on splicing enhancer activity are shown. (A) Conventional splicing assays were carried out on RNA substrates based on μM-MLH1 with various point mutations. The three lanes shown for each mutation are in the same order as in Figure 4. The mobility of unspliced and lariat intermediates are indicated (U/L) as well as spliced RNA (S). Excised intron and 5’ exon migrated faster and are not shown in the figure. The point mutations and the affected codon are indicated above each reaction set. Unaltered μM-MLH1 (wt) and μMΔ (Δ) splicing substrates are included as controls. (B) RNA substrates based on μM-MLH1 (wild type) and a C>T point mutation in codon 659 of this substrate (mutant) were analyzed by COMPARE. The position and sequence of the mutation in the exon is indicated in the schematic as are the locations of the amplification primers (short arrows). Hot stop products were generated as indicated by the arrows with asterisks. Expected Taq I cleavage sites for wild type and mutant products are indicated by dotted vertical lines. Duplicate COMPARE reactions with lanes for the original pool (I), unspliced (U) and spliced (S) products are shown after electrophoresis in parallel.
DISCUSSION
The above studies show that the COMPARE approach can be used to identify differences in splicing enhancer activity among multiple variant exon sequences. This strategy has several strengths that we believe make it a desirable way to functionally scan exons for regions where disease-associated mutations may disrupt splicing. First, the method is simple requiring only routine molecular biology procedures and materials available from commercial sources. Second, because the tested RNAs undergo splicing in a common reaction mixture, the potential for random sample-to-sample variation is minimized and mutations with subtle effects on splicing can be detected more reliably. The approach is also extremely flexible and can readily be adapted to virtually any mutagenesis scheme that affects restriction site position including those generating insertions, substitutions, deletions or point mutations. In the studies performed here we have analyzed as many as five RNA variants simultaneously using COMPARE, but in principle the method is limited only by the number of distinct restriction site positions which can be resolved after gel electrophoresis. It is possible that a much larger number of variants could be tested if desired. A final advantage over other approaches is that COMPARE does not require the presence of large flanking intronic regions from the gene of interest. Instead it utilizes an established ESE-dependent splicing substrate into which any exon sequence can be inserted and tested.
It is worth noting that the IgM substrate used here is best suited to defining enhancers that activate upstream 3′ splice sites. It has been observed that some ESEs activate 5′ splice sites (34–36) and thus may not be detected using this substrate. However the COMPARE approach that we have described could easily be modified to address this by replacing the IgM based substrate with one where a 5′ splice site is known to require an upstream ESE.
Several other systematic approaches have been described for identifying ESE sequences. One successful strategy is to subject oligonucleotides, derived either from random synthetic mixtures or from natural RNA sequences, to multiple rounds of functional selection based on either their ability to activate splicing or bind SR proteins (37–41). A variation on this approach has also been described in which small fragments generated from an individual mRNA were each tested for enhancer function (42). These approaches are well-suited to identifying short elements with the ability to function independently as an enhancer. The COMPARE method differs in that it allows detection of ESEs required for splicing in the context of their natural surrounding exon sequence. Therefore, linker scanning of an exon by COMPARE could potentially miss enhancer elements that are functionally redundant with other sequences in the same exon. This apparent limitation, also provides an intrinsic advantage in that mutations in redundant ESE elements are less likely to have effects on splicing in patients than those that occur in uniquely required ESE elements. Thus COMPARE should selectively identify those elements that are of most interest when mapping sequences where point mutations may affect splicing. This is particularly important because sequences with predicted ESE function are fairly frequent in exons and have degenerate sequence specificities that are tolerant to some mutations.
Mutations that disrupt ESEs frequently result in “exon-skipping”, the appearance of transcripts missing the mutated exon. This occurs because the ESE is required for efficient recognition of flanking splicing signals by the general splicing machinery (43). SR proteins bind to most known ESEs. After binding they are thought to activate splicing by directly interacting with pre-spliceosomal components to recruit them or by contacting the neighboring intron’s branch site in a manner that facilitates base pairing of the U2 snRNA there (22–26). However exonic mutations can generate an increase in exonskipping by other mechanisms that do not involve affects on ESE function. For instance in some genes nonsense-associated altered splicing (NAS) leads to exon skipping triggered by the presence of a premature termination codon (PTC) in the affected exon (44). In addition, the stability of transcripts containing an exon with a PTC is often reduced by the nonsense mediated RNA decay (NMD) pathway (45). In RNAs where skipping of the exon results in an in-frame deletion, low levels of normal mRNA that omit the mutated exon would be expected to become more predominant as they do not have the premature termination codon and can escape NMD (15). Finally exon skipping could result from indirect feedback mechanisms that are activated in mutant cells or by secondary mutations such as those found in diseases with genetic instability such as cancer.
Here we found that both COMPARE and conventional splicing assays identify an active ESE in exon 17 of the MLH1 RNA. The presence of such an element was originally suggested in earlier studies in which four independent germline point mutations altering codon 659 were found to be associated with both HNPCC and elevated levels of exon 17 skipping in peripheral lymphocytes and tumors (31, 46). Two of these kindreds contained identical missense alleles, suggesting that the involvement of NMAS or NMD mechanisms was unlikely. Moreover, exon skipping in these patients occurred only in transcripts deriving from the mutant allele, arguing that the effect was not due to secondary mutations or a feedback mechanism.
In our experiments we directly tested the ability of exon 17 sequences to stimulate splicing of an ESE dependent intron in vitro using HeLa nuclear extracts. The ability of exon 17 sequences to functionally replace the ESE of the mouse IgM RNA in this assay indicates that it has a strong enhancer function. Mapping of this function through substitution mutations and COMPARE places the most important required elements of the enhancer between nucleotides 4 and 26 of this exon. Further experiments show that a somewhat larger region (nt 4–57) is sufficient to independently cause strong splicing activation. In agreement with our functional analysis the ESE-finder computer algorithm identifies three potential enhancer elements in the first 26 nt of the exon and two additional elements in the region between nucleotides 26 and 57 (Xu and Mattox, unpublished).
Although COMPARE can be used to determine the relative effects on splicing efficiency of sequence variants and identify exonic mutations in ESEs, it is unlikely to provide an absolute quantative measure of the effects that a particular mutation could have on the accumulation of alternative RNAs in vivo. For instance the proportion of transcript missing exon 17 in tumors carrying the codon 659 mutation (31) almost certainly exceeds the decrease in splicing we observed when COMPARE was used to test the same mutation. There are several reasons for this. Some splicing signals may display observable effects only in the context of natural neighboring introns and exons (47). Differences in the cellular environment relative to nuclear extracts are also very likely to play a role. Finally, other steps in RNA metabolism (nuclear export, stability) may be affected in vivo in a manner that alter transcript ratios.
Codon 659 lies near the 3′ end of the exon, well outside of the primary enhancer region we identified upstream. Substitutions or deletion of codon 659 and surrounding sequences had significantly smaller effects on the splicing activation function than did mutations in the upstream enhancer. This taken together with the observation that point mutations found in patients at this site cause a decrease in splicing activation in our in vitro assay suggests that, although the sequences surrounding codon 659 do not encode an autonomous splicing enhancer function, they do act as an auxiliary element that further stimulates splicing in the presence of upstream exonic sequences. Such an element might bind additional splicing activators in cooperation with core enhancer element to improve recognition of the upstream intron by the general splicing machinery. It is worth noting in this regard that a number of known ESEs appear to act more efficiently in their native context than they do when placed, in isolation, into a foreign exon. One factor that may contribute to such an effects is the loss of auxiliary elements such as the one found here.
In summary these results suggest that COMPARE can be usefully applied to defining and mapping elements of exonic splicing enhancers, and should be particularly useful in identifying sequences with unique functions in exons where point mutations may cause splicing defects.
MATERIALS AND METHODS
Plasmids and in vitro mutagenesis
The plasmids μM1+2 and μMΔ (33) were kindly provided by Adrian Krainer. μMΔ contains a deletion of the ESE normally found in exon M2 (nucleotides 3–92 of the exon are deleted and replaced by a Sal I restriction site). To produce μM-MLH1, Human MLH 1 sequences from nucleotides 4–91 of exon 17 were amplified with Pfu polymerase (Stratagene) from normal human circulating peripheral lymphocyte DNA (provided by Michael Siciliano) using primers from the sense (5′ TCAGTAGAGTCGACGGGAACCTGATTGGATTA) and antisense (5′ TACAGTGAGTCGACCAGTGGCTAGTCGAAGAAT) strands that incorporated Sal I restriction sites. The product was then inserted into the μMΔ plasmid at the position of the IgM ESE deletion and the construct was verified by DNA sequencing. Plasmids with linker substitutions were generated by amplification of μM-MLH1 with a pair of oppositely oriented phosphorylated primers that incorporated the inserted sequences at their 5′ ends. The PCR product was then circularized with T4 DNA ligase (New England Biolabs) and transformed into XL-1 Blue strain of E. coli. The presence of the desired mutations were verified by DNA sequencing in all cases.
In vitro splicing
For both COMPARE and conventional splicing assays individual 32P labeled splicing substrates were prepared from IgM based DNA templates linearized at the Xba I site in IgM M2 exon (40). Transcription and gel purification of substrate RNAs was carried out as previously described except that SP6 polymerase was used (48). A total of 105 dpm of substrate (individual RNAs or pooled mutant and control RNAs) was added to a 25 μl reaction mixture containing 30% HeLa nuclear extract (4C Biotech, Belgium), 1.5 mM magnesium chloride, 0.6% polyethylene glycol, 1.2 mM dithiothreitol, 0.5 mM ATP, 20 mM creatine phosphate, and 40 units RNase inhibitor (Roche) then incubated at 30°C for 1 hr. To view products of conventional splicing assays 250 μl of stripping buffer (0.7 M sodium chloride, 20 mM Tris pH 7.5, 20 mM EDTA, 1% sodium dodecyl sulfate) was added after incubation and the solution was extracted with phenol-chloroform. After precipitation with 2 volumes of ethanol the pellet was washed with 70% ethanol, resuspended in water and one third of the reaction was electrophoresed on a 5% polyacrylamide-Urea gel to resolve products and intermediates.
COMPARE procedure
For COMPARE analysis 3 μl of the splicing mixture from pooled RNA reactions was treated to remove genomic DNA using the DNA-free DNase Treatment and Removal Reagents (Ambion) based on the manufacturers instructions and 10 μl of this reaction was then used directly in RT-PCR amplification with the Superscript II Reverse Transcriptase Kit (Invitrogen). Reverse transcription was primed with RT2, an oligonucleotide homologous to the 3′ end of the IgM sequences in the substrate RNA (5′ AAGAAGACCATCTCAGAGATAAAAGC). The cDNA was amplified for 20 cycles (30 seconds at 94°C, 30 seconds at 55°C and 30 seconds at 72°C) with RT2 and SP6- IgM5′ (5′ GAATACACGGAATTCGGAGGAGG) a primer spanning the junction between the 5′ end of IgM sequences and plasmid vector. Amplimers from spliced and unspliced RNA products were separated on a 2% agarose gel and isolated using the Qiaex II gel extraction kit (Qiagen). To label the DNA with radioisotope and eliminate detection of products of various DNA heterodimers the fragments were then subjected to the Hot Stop labeling method (32), using the RT-2 primer for Bst XI digestions or the IgM2- mlh5′ primer (AGGGGAACCTGATTGGATTAC) for Taq I digestions. Products were purified using a Qiaquick PCR purification kit (Qiagen) and digested with 15 units of Bst X1 at 55°C or 10 units Taq I at 65°C for 3 hrs. 104 dpm of each digest were then loaded onto an 8% polyacrylamide-urea gel and electrophoresed.
Quantitative analysis of results
The signals produced by individual bands were quantitated using a Molecular Dynamics Storm phosphorimager and Kodak 1D quantitation software. For quantitation of conventional splicing assays the percent splicing was approximated as the sum of signals detected for spliced and intron products divided by the signal from the unspliced substrate RNA.
Acknowledgments
We thank Adrian Krainer for providing mouse IgM plasmids, Junlin Qi and Dawn Chandler for helpful comments on this manuscript. This work was supported by a grant from the National Institutes of Health to WM. DNA sequencing was carried out at the U.T. M.D. Anderson DNA Analysis Facility and supported by a grant # CA16672 (DAF) from the National Cancer Institute.
References
- 1.Faustino NA, Cooper TA. Pre-mRNA splicing and human disease. Genes Dev. 2003;17:419–437. doi: 10.1101/gad.1048803. [DOI] [PubMed] [Google Scholar]
- 2.Zheng ZM. Regulation of alternative RNA splicing by exon definition and exon sequences in viral and mammalian gene expression. J Biomed Sci. 2004;11:278–294. doi: 10.1159/000077096. [DOI] [PMC free article] [PubMed] [Google Scholar]
- 3.Schaal TD, Maniatis T. Multiple distinct splicing enhancers in the protein-coding sequences of a constitutively spliced pre-mRNA. Mol Cell Biol. 1999;19:261–273. doi: 10.1128/mcb.19.1.261. [DOI] [PMC free article] [PubMed] [Google Scholar]
- 4.Fairbrother WG, Yeh RF, Sharp PA, Burge CB. Predictive identification of exonic splicing enhancers in human genes. Science. 2002;297:1007–1013. doi: 10.1126/science.1073774. [DOI] [PubMed] [Google Scholar]
- 5.Zhang XH, Chasin LA. Computational definition of sequence motifs governing constitutive exon splicing. Genes Dev. 2004;18:1241–1250. doi: 10.1101/gad.1195304. [DOI] [PMC free article] [PubMed] [Google Scholar]
- 6.Wang J, Smith PJ, Krainer AR, Zhang MQ. Distribution of SR protein exonic splicing enhancer motifs in human protein-coding genes. Nucleic Acids Res. 2005;33:5053–5062. doi: 10.1093/nar/gki810. [DOI] [PMC free article] [PubMed] [Google Scholar]
- 7.D’Souza I, Poorkaj P, Hong M, Nochlin D, Lee VM, Bird TD, Schellenberg GD. Missense and silent tau gene mutations cause frontotemporal dementia with parkinsonism-chromosome 17 type, by affecting multiple alternative RNA splicing regulatory elements. Proc Natl Acad Sci U S A. 1999;96:5598–5603. doi: 10.1073/pnas.96.10.5598. [DOI] [PMC free article] [PubMed] [Google Scholar]
- 8.Liu HX, Cartegni L, Zhang MQ, Krainer AR. A mechanism for exon skipping caused by nonsense or missense mutations in BRCA1 and other genes. Nat Genet. 2001;27:55–58. doi: 10.1038/83762. [DOI] [PubMed] [Google Scholar]
- 9.Cartegni L, Krainer AR. Disruption of an SF2/ASF-dependent exonic splicing enhancer in SMN2 causes spinal muscular atrophy in the absence of SMN1. Nat Genet. 2002;30:377–384. doi: 10.1038/ng854. [DOI] [PubMed] [Google Scholar]
- 10.Caputi M, Kendzior RJ, Jr, Beemon KL. A nonsense mutation in the fibrillin-1 gene of a Marfan syndrome patient induces NMD and disrupts an exonic splicing enhancer. Genes Dev. 2002;16:1754–1759. doi: 10.1101/gad.997502. [DOI] [PMC free article] [PubMed] [Google Scholar]
- 11.Aznarez I, Chan EM, Zielenski J, Blencowe BJ, Tsui LC. Characterization of disease-associated mutations affecting an exonic splicing enhancer and two cryptic splice sites in exon 13 of the cystic fibrosis transmembrane conductance regulator gene. Hum Mol Genet. 2003;12:2031–2040. doi: 10.1093/hmg/ddg215. [DOI] [PubMed] [Google Scholar]
- 12.Zatkova A, Messiaen L, Vandenbroucke I, Wieser R, Fonatsch C, Krainer AR, Wimmer K. Disruption of exonic splicing enhancer elements is the principal cause of exon skipping associated with seven nonsense or missense alleles of NF1. Hum Mutat. 2004;24:491–501. doi: 10.1002/humu.20103. [DOI] [PubMed] [Google Scholar]
- 13.Pfarr N, Prawitt D, Kirschfink M, Schroff C, Knuf M, Habermehl P, Mannhardt W, Zepp F, Fairbrother W, Loos M, et al. Linking C5 deficiency to an exonic splicing enhancer mutation. J Immunol. 2005;174:4172–4177. doi: 10.4049/jimmunol.174.7.4172. [DOI] [PubMed] [Google Scholar]
- 14.Cooper TA, Mattox W. The regulation of splice-site selection, and its role in human disease. Am J Hum Genet. 1997;61:259–266. doi: 10.1086/514856. [DOI] [PMC free article] [PubMed] [Google Scholar]
- 15.Cartegni L, Chew SL, Krainer AR. Listening to silence and understanding nonsense: exonic mutations that affect splicing. Nat Rev Genet. 2002;3:285–298. doi: 10.1038/nrg775. [DOI] [PubMed] [Google Scholar]
- 16.Mansfield SG, Kole J, Puttaraju M, Yang CC, Garcia-Blanco MA, Cohn JA, Mitchell LG. Repair of CFTR mRNA by spliceosome-mediated RNA trans-splicing. Gene Ther. 2000;7:1885–1895. doi: 10.1038/sj.gt.3301307. [DOI] [PubMed] [Google Scholar]
- 17.Cartegni L, Krainer AR. Correction of disease-associated exon skipping by synthetic exon-specific activators. Nat Struct Biol. 2003;10:120–125. doi: 10.1038/nsb887. [DOI] [PubMed] [Google Scholar]
- 18.Chao H, Mansfield SG, Bartel RC, Hiriyanna S, Mitchell LG, Garcia-Blanco MA, Walsh CE. Phenotype correction of hemophilia A mice by spliceosome-mediated RNA trans-splicing. Nat Med. 2003;9:1015–1019. doi: 10.1038/nm900. [DOI] [PubMed] [Google Scholar]
- 19.Bruno IG, Jin W, Cote GJ. Correction of aberrant FGFR1 alternative RNA splicing through targeting of intronic regulatory elements. Hum Mol Genet. 2004;13:2409–2420. doi: 10.1093/hmg/ddh272. [DOI] [PubMed] [Google Scholar]
- 20.Scaffidi P, Misteli T. Reversal of the cellular phenotype in the premature aging disease Hutchinson-Gilford progeria syndrome. Nat Med. 2005;11:440–445. doi: 10.1038/nm1204. [DOI] [PMC free article] [PubMed] [Google Scholar]
- 21.Graveley BR. Sorting out the complexity of SR protein functions. RNA. 2000;6:1197–1211. doi: 10.1017/s1355838200000960. [DOI] [PMC free article] [PubMed] [Google Scholar]
- 22.Zuo P, Maniatis T. The Splicing Factor U2af(35) Mediates Critical Protein-Protein Interactions In Constitutive and Enhancer-Dependent Splicing. Genes Dev. 1996;10:1356–1368. doi: 10.1101/gad.10.11.1356. [DOI] [PubMed] [Google Scholar]
- 23.Graveley BR, Hertel KJ, Maniatis T. The role of U2AF35 and U2AF65 in enhancer-dependent splicing. RNA. 2001;7:806–818. doi: 10.1017/s1355838201010317. [DOI] [PMC free article] [PubMed] [Google Scholar]
- 24.Graveley BR, Maniatis T. Arginine/serine-rich domains of SR proteins can function as activators of pre-mRNA splicing. Mol Cell. 1998;1:765–771. doi: 10.1016/s1097-2765(00)80076-3. [DOI] [PubMed] [Google Scholar]
- 25.Shen H, Kan JL, Green MR. Arginine-serine-rich domains bound at splicing enhancers contact the branchpoint to promote prespliceosome assembly. Mol Cell. 2004;13:367–376. doi: 10.1016/s1097-2765(04)00025-5. [DOI] [PubMed] [Google Scholar]
- 26.Shen H, Green MR. A pathway of sequential arginine-serine-rich domain-splicing signal interactions during mammalian spliceosome assembly. Mol Cell. 2004;16:363–373. doi: 10.1016/j.molcel.2004.10.021. [DOI] [PubMed] [Google Scholar]
- 27.Zhu J, Mayeda A, Krainer AR. Exon identity established through differential antagonism between exonic splicing silencer-bound hnRNP A1 and enhancer-bound SR proteins. Mol Cell. 2001;8:1351–1361. doi: 10.1016/s1097-2765(01)00409-9. [DOI] [PubMed] [Google Scholar]
- 28.Shen H, Kan JL, Ghigna C, Biamonti G, Green MR. A single polypyrimidine tract binding protein (PTB) binding site mediates splicing inhibition at mouse IgM exons M1 and M2. RNA. 2004;10:787–794. doi: 10.1261/rna.5229704. [DOI] [PMC free article] [PubMed] [Google Scholar]
- 29.Cartegni L, Wang J, Zhu Z, Zhang MQ, Krainer AR. ESEfinder: A web resource to identify exonic splicing enhancers. Nucleic Acids Res. 2003;31:3568–3571. doi: 10.1093/nar/gkg616. [DOI] [PMC free article] [PubMed] [Google Scholar]
- 30.Fairbrother WG, Holste D, Burge CB, Sharp PA. Single nucleotide polymorphism-based validation of exonic splicing enhancers. PLoS Biol. 2004;2:E268. doi: 10.1371/journal.pbio.0020268. [DOI] [PMC free article] [PubMed] [Google Scholar]
- 31.Nystrom-Lahti M, Holmberg M, Fidalgo P, Salovaara R, de la Chapelle A, Jiricny J, Peltomaki P. Missense and nonsense mutations in codon 659 of MLH1 cause aberrant splicing of messenger RNA in HNPCC kindreds. Genes Chromosomes Cancer. 1999;26:372–375. doi: 10.1002/(sici)1098-2264(199912)26:4<372::aid-gcc12>3.0.co;2-v. [DOI] [PubMed] [Google Scholar]
- 32.Uejima H, Lee MP, Cui H, Feinberg AP. Hot-stop PCR: a simple and general assay for linear quantitation of allele ratios. Nat Genet. 2000;25:375–376. doi: 10.1038/78040. [DOI] [PubMed] [Google Scholar]
- 33.Watakabe A, Tanaka K, Shimura Y. The role of exon sequences in splice site selection. Genes Dev. 1993;7:407–418. doi: 10.1101/gad.7.3.407. [DOI] [PubMed] [Google Scholar]
- 34.Humphrey MB, Bryan J, Cooper TA, Berget SM. A 32- nucleotide exon-splicing enhancer regulates usage of competing 5’ splice sites in a differential internal exon. Mol Cell Biol. 1995;15:3979–3988. doi: 10.1128/mcb.15.8.3979. [DOI] [PMC free article] [PubMed] [Google Scholar]
- 35.Muro AF, Iaconcig A, Baralle FE. Regulation of the fibronectin EDA exon alternative splicing. Cooperative role of the exonic enhancer element and the 5’ splicing site. FEBS Lett. 1998;437:137–141. doi: 10.1016/s0014-5793(98)01201-0. [DOI] [PubMed] [Google Scholar]
- 36.Heinrichs V, Ryner LC, Baker BS. Regulation of sex-specific selection of fruitless 5’ splice sites by transformer and transformer-2. Mol Cell Biol. 1998;18:450–458. doi: 10.1128/mcb.18.1.450. [DOI] [PMC free article] [PubMed] [Google Scholar]
- 37.Tacke R, Manley JL. The human splicing factors ASF/SF2 and SC35 possess distinct, functionally significant RNA binding specificities. EMBO Journal. 1995;14:3540–3551. doi: 10.1002/j.1460-2075.1995.tb07360.x. [DOI] [PMC free article] [PubMed] [Google Scholar]
- 38.Tian H, Kole R. Selection of novel exon recognition elements from a pool of random sequences. Mol Cell Biol. 1995;15:6291–6298. doi: 10.1128/mcb.15.11.6291. [DOI] [PMC free article] [PubMed] [Google Scholar]
- 39.Coulter LR, Landree MA, Cooper TA. Identification of a new class of exonic splicing enhancers by in vivo selection [published erratum appears in Mol Cell Biol 1997 Jun;17(6):3468] Mol Cell Biol. 1997;17:2143–2150. doi: 10.1128/mcb.17.4.2143. [DOI] [PMC free article] [PubMed] [Google Scholar]
- 40.Liu HX, Zhang M, Krainer AR. Identification of functional exonic splicing enhancer motifs recognized by individual SR proteins. Genes Dev. 1998;12:1998–2012. doi: 10.1101/gad.12.13.1998. [DOI] [PMC free article] [PubMed] [Google Scholar]
- 41.Kim S, Shi H, Lee DK, Lis JT. Specific SR protein-dependent splicing substrates identified through genomic SELEX. Nucleic Acids Res. 2003;31:1955–1961. doi: 10.1093/nar/gkg286. [DOI] [PMC free article] [PubMed] [Google Scholar]
- 42.Woerfel G, Bindereif A. In vitro selection of exonic splicing enhancer sequences: identification of novel CD44 enhancers. Nucleic Acids Res. 2001;29:3204–3211. doi: 10.1093/nar/29.15.3204. [DOI] [PMC free article] [PubMed] [Google Scholar]
- 43.Staknis D, Reed R. SR proteins promote the first specific recognition of Pre-mRNA and are present together with the U1 small nuclear ribonucleoprotein particle in a general splicing enhancer complex. Mol Cell Biol. 1994;14:7670–7682. doi: 10.1128/mcb.14.11.7670. [DOI] [PMC free article] [PubMed] [Google Scholar]
- 44.Wang J, Chang YF, Hamilton JI, Wilkinson MF. Nonsenseassociated altered splicing: a frame-dependent response distinct from nonsensemediated decay. Mol Cell. 2002;10:951–957. doi: 10.1016/s1097-2765(02)00635-4. [DOI] [PubMed] [Google Scholar]
- 45.Conti E, Izaurralde E. Nonsense-mediated mRNA decay: molecular insights and mechanistic variations across species. Curr Opin Cell Biol. 2005;17:316–325. doi: 10.1016/j.ceb.2005.04.005. [DOI] [PubMed] [Google Scholar]
- 46.Nystrom-Lahti M, Wu Y, Moisio AL, Hofstra RM, Osinga J, Mecklin JP, Jarvinen HJ, Leisti J, Buys CH, de la Chapelle A, et al. DNA mismatch repair gene mutations in 55 kindreds with verified or putative hereditary non-polyposis colorectal cancer. Hum Mol Genet. 1996;5:763–769. doi: 10.1093/hmg/5.6.763. [DOI] [PubMed] [Google Scholar]
- 47.Singh NN, Androphy EJ, Singh RN. In vivo selection reveals combinatorial controls that exon in the spinal muscular atrophy genes. RNA. 2004;10:1291–1305. doi: 10.1261/rna.7580704. [DOI] [PMC free article] [PubMed] [Google Scholar]
- 48.Chandler DS, Qi J, Mattox W. Direct Repression of Splicing by transformer-2. Mol Cell Biol. 2003;23:5174–5185. doi: 10.1128/MCB.23.15.5174-5185.2003. [DOI] [PMC free article] [PubMed] [Google Scholar]